Localized SiO emission triggered by the passage of the W51C SNR shock
Abstract
The region towards W51C is a convincing example of interaction between a supernova remnant and a surrounding molecular cloud. Large electron abundances have been reported towards the position W51C-E located in this interaction region, and it was proposed that the enhanced ionization fraction was due to cosmic ray particles freshly accelerated by the SNR shock. We present PdB interferometer observations of the H13CO+(1-0) and DCO+(2-1) emission lines centered at position W51C-E. These observations confirm the previous scenario of cosmic-ray induced ionization at this location. In addition, SiO(2-1) emission has been successfully mapped in the close vicinity of W51C-E, with a spatial resolution of 7″. The morphology and kinematics of the SiO emission are analyzed and strongly suggest that this emission is produced by the passage of the SNR primary shock. Put in conjunction with the enhanced ionization fraction in this region, we give a consistent picture in which the W51C-E position is located downstream of the shock, where a large reservoir of freshly accelerated particles is available.
1 Introduction
Cosmic Rays (CR) permeate our Galaxy, playing a major role in setting the prevalent physical conditions, notably because they are responsible for the ionization of the dense part of the molecular clouds where stars form. Galactic CRs are thought to originate mostly from the shock of supernovae remnants (SNR) where they can be accelerated up to PeV energies. Their presence can be inferred from the effects of their interaction with their environment. High energy CRs ( GeV) can be tracked down because, when they hit a large mass of gas, they cause bright -ray emission, due to inelastic proton–proton interactions (Kelner et al. 2006). On the other hand, low energy ( GeV) CR can be probed by the enhancement of the ionization that they cause in nearby molecular gas (Padovani et al. 2009). In fact, ionization is the only way to probe the low-energy end of the CR spectrum. Hence, SNR interacting with molecular clouds are particularly promising sites to study both the properties of freshly accelerated CR (e.g. density, spectrum) and their feedback on their environment (diffusion, ionization). In this context, the presence of both an enhanced ionization degree and gamma-ray emission associated with dense molecular clouds close to SNR can provide additional evidence of CR acceleration from sub-GeV (ionization) to multi TeV (VHE gamma-rays) energies.
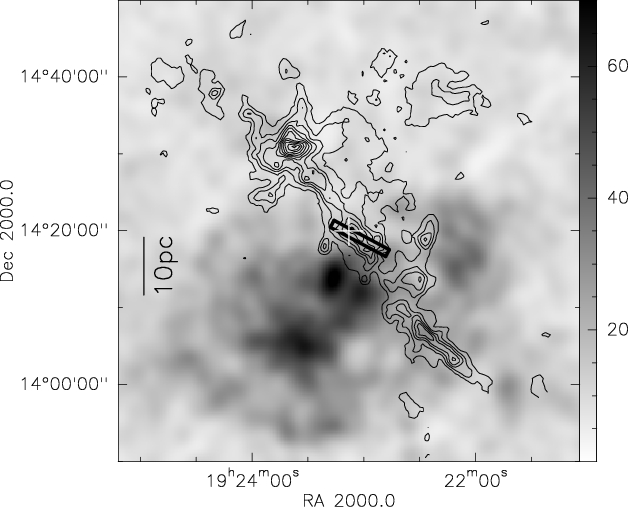
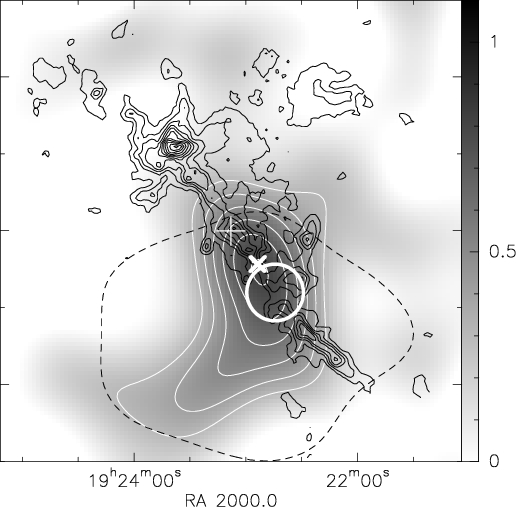
The first dense molecular cloud where the association of enhanced ionization and gamma-ray emission has been detected is associated with the SNR W51C (Ceccarelli et al. 2011 hereinafter CHMD2011). W51C is 5° away from the galactic plane, at a distance of 5.5 kpc (Cyganowski et al. 2011). It extends about 30′ and its age is yrs (Koo et al. 1995). Figure 1 presents the environment of W51C. The thermal X-ray emission (Fig. 1 left panel), tracing the SNR primary shock, extends north-west beyond the molecular cloud, hinting that the SNR is situated behind the W51B cloud complex (Koo et al. 1995). A bright and extended GeV-TeV -ray source has been detected towards W51C by Feinstein et al. (2009), Abdo et al. (2009) and Aleksić et al. (2012) who concluded that the origin of such emission is the interaction between the SNR and the nearby molecular cloud (Fig. 1, right panel). OH masers and high velocity H i and molecular emission are observed coincidently in the overlapping region of W51C and the W51B complex, which suggests that they are associated with the SNR shock (Koo et al. 1995, Green et al. 1997, Brogan et al. 2000), although that is still under debate (Tian & Leahy 2013).
CHMD2011 sampled several lines-of-sight toward this interaction region with the IRAM-30m single dish telescope. They found that the CR ionization rate is about 100 times larger than in standard galactic molecular clouds in the direction of the position W51C-E ; , situated north west of the SNR, at the edge of the gamma-ray emission detected by Fermi/LAT and MAGIC as shown in Fig. 1 (right panel) and about 2′ north of the Hii region G49.2-0.3. The CR ionization rate was derived by measuring the abundance ratio DCO+/HCO+, following the method described in Guélin et al. (1977, see CHMD2011 for further details on the method used). The observations were sensitive to the ionization of the gas in the 28″ beam, corresponding to a linear distance of pc.
Promptly after the publication of this measurement, NIR observations of the region revealed the presence of a protostar at the edge of the beam of the DCO+ and HCO+ observations (Cyganowski et al. 2011), which could alter the interpretation of the results of the CHMD2011 work. In practice, CHMD2011 assumed that all the detected DCO+ and HCO+ emission come from ionization of the dense gas by the CR. However, UV flux from a star formation region and potential outflows could also ionize the surrounding molecular gas. Therefore, if CHMD2011 single-dish observations were contaminated by emission towards the protostar, the beam-averaged measured ionization rate may not be related to the CR. Therefore, we carried out high spatial resolution observations of the same region with the Plateau de Bure Interferometer (PdBI) in order to verify whether the spatial distribution of DCO+ and HCO+ emission, used to derive the high CR ionization rate, is linked to the protostar.
We describe here the results of these observations that provide additional evidence for an overdensity of freshly accelerated low energy CR in W51C-E. In addition we discuss the shocked regions probed by the SiO(2-1) emission detected by these PdBI observations.
2 Observations and data reduction
W51C-E was observed with Plateau de Bure Interferometer between June and July 2012 in the D configuration with 5 antennae, providing baselines between 15 m and 111 m. We used the 2mm receivers tuned at 144.077GHz and the 3mm receivers tuned at 86.754GHz, to map the emission lines DCO+(2-1) and H13CO+(1-0), respectively. A total bandwidth of about 230 MHz with a spectral resolution of 0.156 MHz was used for both set-ups. At 3mm, the set-up covers the SiO(2-1) line at 86.847 GHz. In parallel, the wideband correlator WideX offers a total of 3.6 GHz of bandwidth at 1.95 MHz resolution. The phase center of the observations was at ; . MWC349 was used as flux calibrator and the quasar J1923+210 was used as phase calibrator and observed every 23min. At 3 mm (respectively 2 mm), the primary beam is 58″ (respectively 32″) with a conversion factor of 22 Jy K-1 (respectively 29 Jy K-1).
The data reduction was done with the standard IRAM GILDAS111http://www.iram.fr/IRAMFR/GILDAS software packages CLIC and MAPPING (Guilloteau & Lucas 2000). Each day of observations was calibrated separately and single datasets were created at 2 mm and 3 mm for both the narrow band correlator and WideX. Pure continuum and continuum subtracted data cubes were then created and deconvolved separately, using natural weighting leading to a beam size of at 2 mm and at 3 mm. In the case of the WideX data, all detected emission lines were cleaned independently. The final natural weighted data cubes have a rms of 4.8 mJy bean-1 in a channel width of 1.3 km s-1 (0.625 MHz) at 2 mm and 1.1 km s-1 (0.3125 MHz) at 3 mm.
In addition, we obtained a x map of the SiO(2-1) line with the IRAM-30m telescope. The observations were carried out in January 2013. We used simultaneously the EMIR bands E090 and E230 and tuned the Fast Fourier Transform Spectrometer (FFTS) backends on H13CO and 13CO transitions, respectively. The mapping of the region was conducted in the on-the-fly mode over hours, reaching a rms of 90 mK in 0.67 km s-1 channel width at 3 mm and 275 mK in 0.27 km s-1 channel width at 1 mm. The weather was good and values were typically lower than 150 K at 3 mm and 350 K at 1 mm.
We used a reference position about RA=300″, dec=-400″ away from the mapped area. The amplitude calibration was done typically every 15 minutes, and pointing and focus were checked every 1 and 3 hours, respectively, ensuring 2″ pointing accuracy. All spectra were reduced using the CLASS package (Hily-Blant et al. 2005) of the IRAM GILDAS software. Residual bandpass effects were subtracted using low-order () polynomials. Table 1 lists the set-ups used and the emission lines mapped with these single-dish and interferometric observations.
3 Results
3.1 DCO+ and H13CO+
We find no compact DCO+ or H13CO source within the beam covered by previous IRAM-30m observations of W51C-E by CHMD2011. Therefore no emission associated to the nearby protostar is contaminating the measurements by CHMD2011. This result supports the conclusions by these authors that the entire region traced by the 30m beam has an enhanced CR ionization flux.
3.2 SiO(2-1)
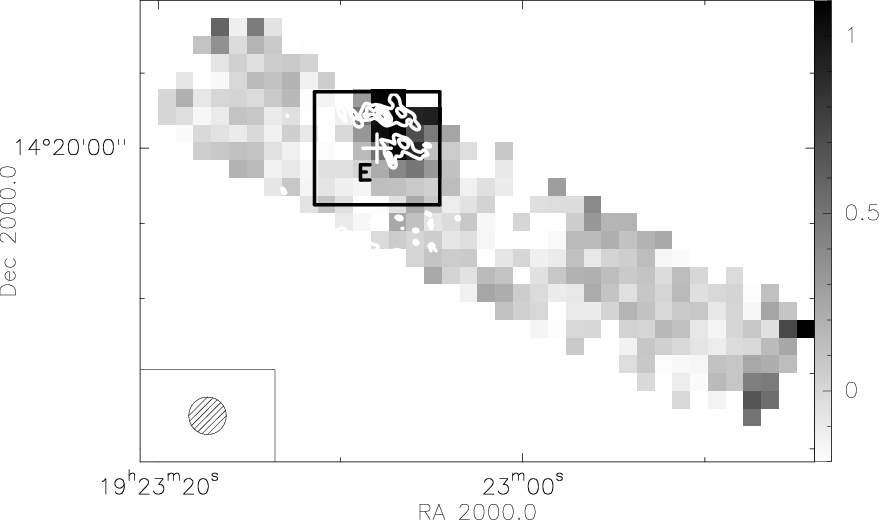
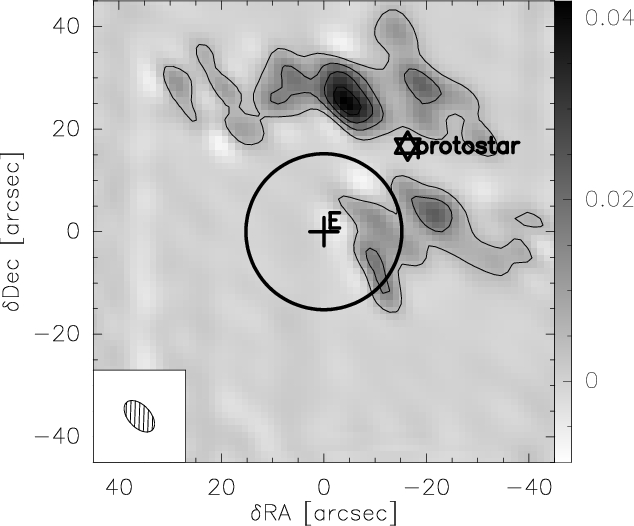
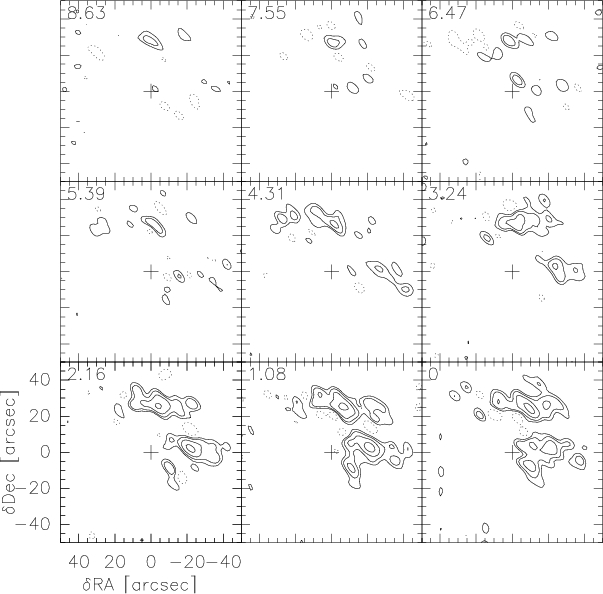
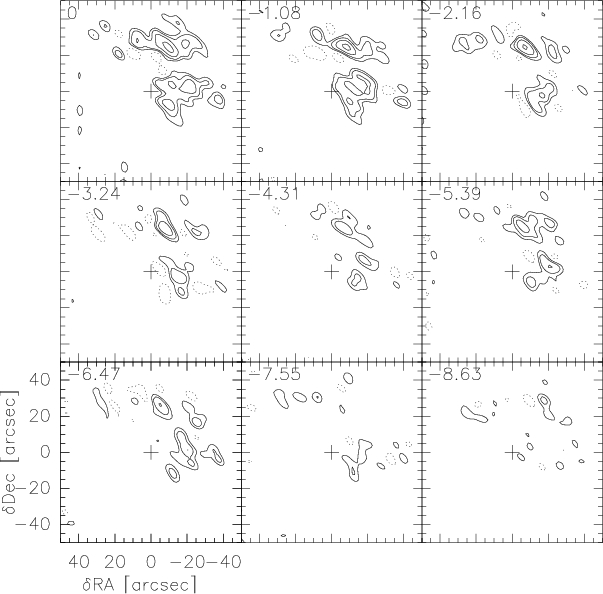
Figure 2, left panel shows the IRAM-30m map of the SiO emission. Strong emission is detected only around the position of the W51C-E source. The PdB SiO integrated map around that position is shown in the right panel of Fig. 2. The SiO emission is concentrated in two regions, north and south of the protostar, respectively. The north region is split into three clumps, aligned in the west-east direction over a length of about 1.2 pc (45″). The southern SiO structure is weaker and splits into two emitting regions with about a 45 deg angle and an elongation of about 0.5 pc (20″). These SiO clumps are barely resolved, with an average size of about 0.3 pc (10″), and have a velocity dispersion between 5 and 7 km s-1. Figures 3 and 4 present the channel maps of the SiO emission, at 1.08 km s-1 velocity resolution. The first thing to note, no velocity gradient nor structure apparently associated with the protostar is evident in these maps. The emission is only present from -6.5 to +6.5 km -1 around the systemic velocity (67 km s-1, CHMD2011) with almost constant intensity in both north and south structures.
4 Discussion
The first important result of this work is that the position observed by CHMD2011 does not have any compact region of DCO+ emission, which supports the idea that the whole region encompassed by the IRAM-30m beam is permeated by gas with a CR ionization rate about 100 times larger than the standard one. In other words, the protostar in the field has no impact on the determination of the ionization of the region.
The second, unexpected result is the presence of SiO emission, concentrated in that region. As shown from the large scale map (Fig. 2, left panel), SiO is only associated with W51C-E, which adds support to the conclusions by CHMD2011 that it is a peculiar region. The obvious questions are: why is SiO present, what does it trace, and has it anything to do with the enhanced CR ionization rate in the region ? Under typical dark cloud conditions, silicon is almost tied up in interstellar grains, and its abundance in the gas phase is typically or less (see Lucas & Liszt 2000 and references therein)lucas2000, because Si is trapped in the refractory interstellar grains and/or mantles that envelop them. However, in shocked regions, the grains can be shattered and the mantles be sputtered (Flower et al. 1996, Schilke et al. 1997, Gusdorf et al. 2008), so that SiO, the major Si-bearing reservoir in molecular gas, becomes orders of magnitude more abundant, up to . In fact, SiO is commonly used to trace molecular shocks (Bachiller 1996). Our observations do not allow us to give an estimate of the abundance nor of the physical conditions of the gas emitting the SiO(2-1) transition. However, it is likely that the two observed structures have an enhanced SiO abundance with respect to the rest of the whole region (over the x length of the IRAM-30m map). Even though we cannot quantify the strength of the shock, there is no doubt that two shocked regions are present, probed by the SiO emission. The next question is: what is the origin of this shock? One would first think that it is powered by the protostar outflow. To check this possibility, we show the SiO emission channel maps in Fig. 3 and Fig. 4. The spatial shift between the red and blue shifted emission parts, which is a signpost of protostellar outflow (e.g. Gueth & Guilloteau 1999) is not seen. Therefore, we conclude that the observed SiO emission is not associated with an outflow driven by this star. This is in agreement with previous studies detecting no outflow associated with the protostar (de Buizer & Vacca 2010, Cyganowski et al. 2011)
Then the second more plausible explanation is that the detected shock is connected, in a way or another, to the SNR primary shock that may have created the large flux of CR probed by the enhanced ionization in W51C-E. Fig. 1 shows the high energy environment of the SNR. In particular the W51C-E position (black cross in the right panel of Fig. 1) lies at the edge of the gamma-ray emission detected by Fermi/LAT and MAGIC. This leads us to conclude that the W51C-E position where enhanced ionization has been detected is situated in the vicinity of the SNR shock. In general, SNR shocks are believed to be the main accelerators of Galactic CRs. Their velocities exceed km s-1 in the initial phase of the evolution of SNRs, and gradually decrease as the SNRs age (Vink 2012). Koo et al. (1995) derived a forward shock velocity of and a dynamical age of years from the thermal X-ray emission. Even at this late stage, shocks are believed to be strong enough to accelerate CRs up to GeV energies and possibly more (Ptuskin & Zirakashvili 2003). Theory predicts that if molecular clumps of dense gas obstruct the passage of the primary shock, its propagation stalls while a complex system of shocks develops in and around the clump (e.g. Jones & Kang 1993, Inoue et al. 2012). The localized SiO emission that we detect in W51C-E could thus arise from a cloud overrun by the SNR. Assuming a primary shock speed , a cloud overdensity with respect to the ambient density would give a typical transmitted shock speed in the clump , enabling grain sputtering (Gusdorf et al. 2008). If correct, this interpretation implies that W51C-E is located downstream of the shock, where a large reservoir of ionizing CRs is available. This is further supported by the general picture that the primary shock, as traced by the thermal X-ray emission, extends north west beyond the W51B complex (Fig. 1). Only a part of the SNR is interacting with the north east portion of the W51B complex, as evinced from the presence of shocked atomic and molecular material coincident with the centroid of the gamma-ray emission, about 20 pc (10′) south-west from our observations (Koo & Moon 1997a, 1997b, Brogan et al. 2013). In principle, the shock traced by SiO emission might also be responsible for the enhanced CR ionization rate of W51C-E. Reflected shocks are expected to be significantly weaker than the primary shock, hence less efficient in accelerating CRs unless the primary shock is CR dominated (Jones & Kang 1993). Though this possibility cannot be ruled out here, it seems less natural as the low-energy CR would also have to escape the clump rapidly to fill in the pc region where we detect an overionization. Probably, a way to test this explanation is observing a gradient of CR ionization rate in positions close to W51C-E: if the SiO shock is responsible for the CR acceleration, then the larger the distance from the SiO shocks, the lower the ionization.
5 Conclusions
We have presented PdBI observations of the position W51C-E in the interacting region of the SNR W51C with the nearby molecular cloud. Our first result is that we confirm that this region studied by CHMD2011 is filled up with gas ionized by a enhanced flux of CRs. We also report the presence of two structures probed by SiO(2-1) emission, approximately elongated in the east-west direction, and we propose that these structures are tracing a low-velocity shock caused by the passage of the primary SNR shock through a dense clump. We conclude that the W51C-E region is downstream of the SNR forward shock, exactly where the CRs accelerated at the forward shock would accumulate and cause the enhanced ionization measured there. Although less probable, it is possible that the shock traced by the SiO emission is responsible for the acceleration of low ( 1 GeV) CRs, which would contribute to the ionization of the dense gas in this region.
References
- (1) Abdo, A. A. et al. 2009, ApJ 706, L1
- (2) Aleksić, J. et al. 2012, A&A 541, 13
- (3) Bachiller, R. 1996, ARA&A 35, 111
- (4) Brogan, C. et al. 2000, ApJ 537, 875
- (5) Brogan, C. et al. 2013, ApJ 771, 91
- (6) de Buizer, J. M. & Vacca, W. D. 2010, ApJ 140, 196
- (7) Ceccarelli, C.; Hily-Blant, P.; Montemerle, T.; Dubus, G.; Gallant, Y. & Fiasson, A. 2011, ApJL 740, L4 (CHMD2011)
- (8) Cyganowski, C. J.; Brogan, C. L.; Hunter, T. R. & Churchwell, E.. 2011, ApJ 743, 56
- (9) Feinstein, F. et al. 2009, AIPC 1112 54F
- (10) Flower, D. R.; Pineau des Forets, G.; Field, D. & May, P. W. 1996, MNRAS 280, 447
- (11) Greaves, J.S.; Ohishi, M. & Nyman, L.-A. 1996, A&A 307, 898
- (12) Green, A. J.; Frail, D. A.; Goss, W. M. & Otrupcek, R. 1997, AJ 114, 2058
- (13) Guélin, M.; Langer, W.D.; Snell, R.L. & Wootten, H.A. 1977, ApJ 217, L165
- (14) Gueth, F. & Guilloteau, S. 1999, A&A 343, 571
- (15) Guilloteau, S. & Lucas, R. 2000, ASPC 217, 299
- (16) Gusdorf, A.; Pineau des Forets, G.; Cabrit, S. & Flower, D. R. 2008, A&A 490, 695
- (17) Hily-Blant, P.; Pety, J., & Guilloteau, S. 2005 CLASS Manual, http://www.iram-institute.org/medias/uploads/class-evol1.jpeg
- (18) Inoue, T.; Yamazaki, R.; Inutsuka, S.-I. & Fikui, Y. 2012, ApJ 744, 71
- (19) Jackson, J. M. et al. 2006, ApJS 163, 145
- (20) Jones, T. W. & Kang, H. 1993, ApJ 402, 560
- (21) Kelner, S. R.; Aharonian, F. A. & Bugayov, V. V. 2006, Phys. Rev. D 74, 034018
- (22) Koo, B-C.; Kim, K-T. & Seward, F.D. 1995, ApJ 447, 211
- (23) Koo, B-C. & Moon, D-S. 1997, ApJ 475, 194
- (24) Koo, B-C. & Moon, D-S. 1997, ApJ 485, 263
- (25) Lucas, R. & Liszt, H. S. 2000, A&A 355, 327
- (26) Padovani, M.; Galli, D. & Glassgold, A. E. 2009, A&A 501, 619
- (27) Ptuskin, V. S. & Zirakashvili, V. N. 2003, A&A 403, 1
- (28) Schilke, P.; Walmsley, C. M.; Pineau de Forets, G. & Flower, D. R. 1997, A&A 321, 293
- (29) Tian, W. W. & Leahy, D. A. 2013, ApJL, 769, L17
- (30) Vink, J. 2012, A&ARv 20, 49
| PdBI observations | 2 mm | 3 mm |
|---|---|---|
| central frequency | 144.077 GHz | 86.754 GHz |
| beam size | ||
| velocity resolution | 1.3 km s-1 | 1.1 km s-1 |
| rms (mJy beam-1) | 3.1 | 4.8 |
| emission lines | DCO+(2-1) | H13CO+(1-0); SiO(2-1) |
| primary beam | 32″ | 58″ |
| conversion factor (Jy K-1) | 29 | 22 |
| 30m observations | 1 mm | 3 mm |
| central frequency | 220.399 GHz | 86.754 GHz |
| beam size | 11″ | 28″ |
| velocity resolution | 0.27 km s-1 | 0.67 km s-1 |
| rms (mK) | 275 | 90 |
| emission lines | 13CO(2-1) | H13CO+(1-0); SiO(2-1) |