Star-forming galaxies as the origin of diffuse high-energy backgrounds: Gamma-ray and neutrino connections, and implications for starburst history
Abstract
Star-forming galaxies have been predicted to contribute considerably to the diffuse gamma-ray background as they are guaranteed reservoirs of cosmic rays. Assuming that the hadronic interactions responsible for high-energy gamma rays also produce high-energy neutrinos and that PeV cosmic rays can be produced and confined in starburst galaxies, we here discuss the possibility that star-forming galaxies are also the main sources of the high-energy neutrinos observed by the IceCube experiment. First, we compute the diffuse gamma-ray background from star-forming galaxies, adopting the latest Herschel PEP/HerMES luminosity function and relying on the correlation between the gamma-ray and infrared luminosities reported by Fermi observations. Then we derive the expected intensity of the diffuse high-energy neutrinos from star-forming galaxies including normal and starburst galaxies. Our results indicate that starbursts, including those with active galactic nuclei and galaxy mergers, could be the main sources of the high-energy neutrinos observed by the IceCube experiment. We find that assuming a cosmic-ray spectral index of 2.1–2.2 for all starburst-like galaxies, our predictions can be consistent with both the Fermi and IceCube data, but larger indices readily fail to explain the observed diffuse neutrino flux. Taking the starburst high-energy spectral index as free parameter, and extrapolating from GeV to PeV energies, we find that the spectra harder than are likely to be excluded by the IceCube data, which can be more constraining than the Fermi data for this population.
1 Introduction
The existence of the extragalactic diffuse gamma-ray background (EGRB) has been revealed long ago [1]. Its importance is related to the fact that it encodes unique information about high-energy processes in the Universe. The EGRB has an isotropic sky distribution by its definition, and is contributed by gamma rays produced from leptonic processes or by cosmic rays interacting with the surrounding gas and radiation fields. It is most probably made of the superposition of contributions from unresolved extragalactic sources including star-forming galaxies, active galactic nuclei (AGN), gamma-ray bursts, intergalactic shocks produced by structure formation, etc. (see Refs. [2, 3, 4, 5, 6, 7]).
Before Fermi and IceCube data being available, star-forming galaxies had been expected to contribute to the diffuse GeV-TeV gamma-ray background, see for example Refs. [8, 9, 10, 11], and possibly to the cumulative sub-PeV neutrino background [12, 13, 14, 15, 16]. Their main emission component above GeV energies is due to cosmic-ray interactions with the diffuse gas. Diffuse emission from the Milky-Way galaxy (MW) is, in fact, the brightest feature of the gamma-ray sky. Gamma rays primarily arise from the decay of mesons produced in inelastic collisions of cosmic rays with the interstellar gas. As the MW, it is expected that other star-forming galaxies emit gamma rays through the same interactions providing substantial contribution to the EGRB.
A special subset of star-forming galaxies is a less numerous, but individually more luminous population: The starburst galaxies. Starbursts undergo an epoch of star formation in a very localized region at an enhanced rate (i.e., –year) in comparison to normal galaxies such as the MW (–year). This activity is often triggered by galaxy mergers or by galactic bar instabilities where the dynamical equilibrium of the interstellar gas is disturbed and leads to the formation of high-density gas regions, usually at the center of the galaxy. For example, M82 and NGC 253 are located relatively nearby (–4.0 Mpc) and they can be defined as prototypical starbursts; each of them has an intense star-forming region in the center (with a radius of pc). These starbursts are expected to have high supernova rates of about 0.03–0.3 yr-1 (see Ref. [14] for a detailed study on the characteristics of these sources). Observationally, EGRET detected only the MW and Large Magellanic Cloud [17], but Fermi has also detected the Small Magellanic Cloud [18], the starburst galaxies M82 and NGC 253 [19] as well as starbursts with Seyferts NGC 4945 and NGC 1068 [20], and some others more recently [5, 21].
Our understanding of how galaxies form and evolve has increased dramatically over the last decade (see Ref. [22] for a review). A wide range of surveys shows that the star formation rate density rises up to –2 and reveal that the bulk of the stellar mass density seen in the universe today was formed between and 2. Understanding why the universe was much more active in the past and which processes or mechanisms drove galaxy evolution is one of the most important goals in the field of galaxy formation. In particular, one has to consider the energy absorbed by dust and re-emitted at longer wavelengths, in the infrared (IR) or sub-millimeter (sub-mm) range. Dust is responsible for obscuring the ultraviolet and optical light from galaxies. Since star formation is affected by dusty molecular clouds, far-IR and sub-mm data, where the absorbed radiation is re-emitted, are very important to provide a complete picture of the star formation history.
Surveys of dust emission performed with former satellites exploring the Universe in the mid- and far-IR domain (IRAS, ISO, and Spitzer) allowed the first studies of the IR-galaxy luminosity function (comoving number density of galaxies per unit luminosity range) up to [23, 24, 25, 26]. The detection of large numbers of high- sources, however, was not achievable before the Herschel Space Observatory [27], which has recently provided an estimate of the luminosity function up to . Strong evolution in both luminosity and density has been found, indicating that IR galaxies were more luminous and more numerous in the past [27, 28, 29, 30, 31]. Herschel even enabled, for the first time, the estimate of the luminosity functions of specific galaxy populations: normal galaxies, starbursts, and star-forming galaxies with obscured or low-luminosity AGNs, all of them contributing to the star-formation rate. We note, however, that our knowledge of the far-IR luminosity function is still affected by substantial uncertainties, because of source confusion and low detector sensitivity [32].
The IceCube neutrino observatory at the South Pole is presently the most sensitive instrument to uncover astrophysical neutrino sources in the TeV to PeV energy range. The IceCube Collaboration has recently reported evidence for extraterrestrial neutrinos, after the observation of three PeV neutrino cascades within three years of operation [33, 34, 35]. The recent data set consisting of events corresponds to a spectral excess with respect to the atmospheric background with a significance of more than [35]. This spectral excess is consistent with a diffuse neutrino flux with a spectrum, possible break/cutoff at a few PeV, and isotropic sky distribution. The flux for each neutrino species is well described with the following fit based on the data between TeV and PeV:
| (1.1) |
within error bars.
The energy distribution of the 37 neutrino events should provide additional clues about the candidate sources and several explanations have been indeed proposed to explain such high-energy events (see Refs. [36, 37] for recent reviews). Standard fluxes of the prompt neutrino background from the decay of charmed mesons are too low to have a significant contribution at PeV energies [38, 39]. A connection to cosmogenic neutrinos produced via the extragalactic background light seems unlikely [40, 41], unless one assumes the optimistic extragalactic background disfavored by Fermi observations of gamma-ray bursts along with relatively low maximum proton energies [42]. Early studies suggested a possible connection to the Glashow resonance [43], but this scenario was later disfavored by a follow-up analysis [33]. More exotic models such as the PeV dark matter decay scenarios have been suggested too [44, 45]. Galactic neutrino sources have been discussed, pointing out a possible association with the extended region around the Galactic center (see Refs. [46, 47] and references therein) or with the unidentified TeV gamma-ray sources [48]. The Galactic halo has been discussed as one of the possible options [46, 49, 50]. However, most of the observed events do not originate from the extended region around the Galactic center which makes the scenario of the Galactic origin slightly disfavored, and GeV-PeV gamma-ray observations have already put meaningful constraints on various Galactic possibilities including the Galactic halo scenario [46, 15]. The isotropic diffuse flux is most naturally explained with extragalactic sources. Among extragalactic scenarios, various PeV neutrino sources including gamma-ray bursts, peculiar supernovae, newborn pulsars, AGN, star-forming galaxies and intergalactic shocks had already been suggested before the discovery of the IceCube spectral excess. The observation can be most probably associated with various extragalactic PeV cosmic-ray accelerators, e.g. low-power gamma-ray burst jets [51], AGN [52, 53], star-forming galaxies including starbursts, galaxy mergers and AGN [12, 13, 14, 15, 54, 55, 16, 56, 57, 58], intergalactic shocks and active galaxies embedded in structured regions [15]. Mixed scenarios of Galactic and extragalactic neutrino sources have also been discussed [46, 47, 48, 49, 53, 59].
Since the star-forming galaxies are considered to be one of the main source classes of the diffuse gamma-ray background, we here consider them as a potential source population of the high-energy neutrinos observed by IceCube and compare our estimations with the observed IceCube flux. Making such a multi-messenger connection is one of the keys for revealing the origin of the diffuse neutrino flux observed by IceCube. As shown in Ref. [15], the multi-messenger connection based on the measured neutrino and gamma-ray data can provide crucial ways to constrain various extragalactic scenarios such as star-forming galaxies.
We rely our computations on the latest IR luminosity function provided by Herschel PEP/HerMES up to [27] as well as the well calibrated scaling relation between gamma-ray luminosity and IR luminosity [5]. Compared with previous studies on the EGRB estimates due to star-forming galaxies [10, 11, 60, 61, 62], we adopt the empirical relation obtained in the Fermi era as well as the luminosity functions of different populations of galaxies (normal galaxies, starbursts, galaxies containing obscured/low-luminosity AGN), separately, which became possible thanks to Herschel’s great statistics of various populations covering wide range of the IR spectrum. For our canonical model, where we assume that the spectral index of both gamma rays and neutrinos is from starburst-like sources, we show that a significant fraction (20–50%) of the IceCube flux may be explained with this source population given that the extrapolation from GeV to PeV energies is realized. If the starburst population features harder spectra than , then the IceCube data yield more stringent constraints on such a scenario than the Fermi data, allowing us to exclude these models.
This paper is organised as follows. We first calculate the EGRB intensity based on the Herschel PEP/HerMES luminosity function, and compare the EGRB estimation with the Fermi data in Sec. 2. We then present the associated diffuse neutrino background in comparison with the IceCube data in Sec. 3. We constrain the injection spectral index of starburst-like galaxies as well as their abundance in Sec. 4. In Sec. 5, we discuss caveats and issues of the star-forming galaxy scenario for the observed high-energy neutrinos, which should be addressed in the future. We finally give summary and discuss perspectives in Sec. 6.
2 Extragalactic gamma-ray diffuse background from star-forming galaxies
In this Section, we compute the EGRB adopting the Herschel PEP/HerMES IR luminosity function up to [27] and the relation connecting the IR luminosity to the gamma-ray luminosity presented by the Fermi Collaboration [5]. The luminosity function provides a fundamental tool to probe the distribution of galaxies over cosmological time, since it allows us to access the statistical nature of galaxy formation and evolution. It is computed at different redshifts and constitutes the most direct method for exploring the evolution of a galaxy population, describing the relative number of sources of different luminosities counted in representative volumes of the universe. Moreover, if it is computed for different samples of galaxies, it can provide a crucial comparison between the distribution of galaxies at different redshifts, in different environments or selected at different wavelengths.
2.1 Gamma-ray luminosity function inferred from infrared data
Up to now, the total emissivity of IR galaxies at high redshifts had been poorly known because of the scarcity of Spitzer galaxies at , the large spectral extrapolations to derive the total IR luminosity from the mid-IR, and the incomplete information on the redshift distribution of mid-IR sources [23]. Herschel is the first telescope that allows to detect the far-IR population to high redshifts (–5) and to derive its rate of evolution [27]. From stellar mass function studies, one finds a clear increase of the relative fraction of massive star-forming objects (with mass ) as a function of redshifts, starting to contribute significantly to the massive end of the mass functions at [28, 30, 29, 27, 31].
The IR population does not evolve all together as a whole, but it is composed of different galaxy classes evolving differently and independently. According to Ref. [27], among detected star-forming galaxies, IR observations report 38% of normal spiral galaxies (NG), the 7% of starbursts (SB), and the remaining goes in star-forming galaxies containing AGN (SF-AGN) at 160 m, being the latter ones star-forming galaxies containing either an obscured or a low-luminosity AGN but still contributing to the cosmic star-formation rate. (Note that, in general, the intrinsic fractions are functions of redshifts.) Here we consider all of them as gamma-ray (and neutrino) sources. The galaxy classification has been done with the IR spectral data, where those that have the far-IR excess with significant ultraviolet extinction are classified as SB, and those who exhibit mid-IR excess can be attributed to the galaxies containing obscured or low-luminosity AGNs (SF-AGN). Both systems (SB and SF-AGN) have bolometric emission dominated by star formation. The latter family, SF-AGN, according to Ref. [27] includes Seyferts, LINERs and ULRIGs containing AGN; we remark as the SF-AGN family, although containing AGNs, is dominated by star-formation and not by AGN processes. The specific star-formation rate obtained for the SB population is shown to be on average a factor 0.6 higher than that for the NG population [27].111Some literature adopts the values of the specific star-formation rate in order to define NG and SB populations. But we note that both conventions are consistent with each other as shown in Fig. 15 of Ref. [27].
The gamma-ray intensity is calculated with the gamma-ray luminosity function as
| (2.1) |
where is the gamma-ray luminosity function for each galaxy family , SB, SF-AGN}, is the differential gamma-ray flux at energy from a source at the redshift , the comoving volume per unit solid angle per unit redshift range. The factor takes into account the attenuation of high-energy gamma rays by pair production with ultraviolet, optical and IR extragalactic background light (EBL attenuation), being the optical depth. In our numerical calculations we assume and adopt the EBL model in Ref. [63].
For each population , we adopt a parametric estimate of the luminosity function for the IR luminosity between 8 and 1000 m at different redshifts [27]:
| (2.2) | |||||
which behaves as a power law for and as a Gaussian in for . We adopt the redshift evolution of and for each population as in Table 8 of Ref. [27], as well as the values of and . We then fix the normalization by fitting the data for and from Fig. 11 of Ref. [27]. Table 1 shows the local () values of these parameters as the result of such a fitting procedure.222We note that adopting for these parameters the values directly from Table 8 of Ref. [27] results in overestimate of the gamma-ray intensity, since the table summarizes the values of and for , which are different from the values at shown in Table 1.
By integrating the luminosity function, one obtains the IR luminosity density :
| (2.3) |
which is believed to be well correlated to the cosmic star-formation rate density. The adopted fitting functions for the luminosity function of each family reproduce the total IR luminosity density data summarized in Fig. 17 of Ref. [27].
| NG | Mpc-3 | |
|---|---|---|
| SB | Mpc-3 | |
| SF-AGN | Mpc-3 |
The Fermi data show a correlation between gamma-ray luminosity (0.1–100 GeV) and IR luminosity (8–1000 m). Although such correlation is not conclusive at present due to the limited statistics of starbursts found in gamma rays, we adopt the following scaling relation:
| (2.4) |
with the solar luminosity, and [5]. While this parameterization is calibrated in a local volume, we assume that it is also valid at higher redshifts (up to ) and for . Through this correlation relation, the gamma-ray and IR luminosity functions are related via
| (2.5) |
The physical origin of the above correlation is qualitatively understood as follows. Total IR luminosity at 8–1000 m is one of the well-established tracers of the star-formation history for late-type galaxies [64], since stellar emission is reprocessed by dust. Gamma rays are produced by cosmic rays and the cosmic-ray injection rate is expected to be proportional to the star-formation rate, so the gamma-ray luminosity is expected to be correlated with the IR luminosity [5]. However, further studies are needed to see if such a correlation largely holds from normal to starburst galaxies.
2.2 Gamma-ray flux
As for the distribution of gamma rays as a function of energy, we here adopt a broken power-law fit and parameterize it as [65]
| (2.8) |
We set the normalization by requiring
| (2.9) |
such that the energy flux integrated over energy gives the luminosity above 100 MeV divided by luminosity distance squared. The injection spectral index of the low energy part of the spectrum () has been chosen as a good fit to the gamma-ray spectrum [10]. As for the high-energy part of the spectrum, in our canonical model, we adopt , .
Concerning the SF-AGN spectral index, within our canonical model, we choose to adopt two different spectral indices following the evolution with the redshift of the IR luminosity density as in Fig. 18 and Tab. 9 of [27]. In fact, we subdivide the SF-AGN family in “SF-AGN (SB),” that resembles starburst galaxies, and “SF-AGN (non-SB),” that includes galaxies similar to the normal ones. We report in Table 2 the fraction of SF-AGN (SB), for which we assume a SB-like spectral index, and the remaining fraction, SF-AGN (non-SB), for which we take a spectral index equal to the one of normal galaxies, for each redshift range. In our canonical model, we assume the distribution reported in Table 2, and take: and . 333In the rest of the paper, we will always distinguish among three families of star-forming galaxies referring to the three correspondent luminosity functions defined in Sec. 2.1 for NG, SB and SF-AGN. However, in terms of the energy spectra, we assume that SF-AGN behave as normal galaxies or starbursts as a function of the redshift as pointed out in Table 2. In fact the SF-AGN activity is dominated by star formation and not by the AGN presence. Note that, in the picture of cosmic-ray diffusion, the spectral index difference is interpreted as the energy dependence of the diffusion coefficient.
| redshift range | SF-AGN (non-SB) | SF-AGN (SB) |
|---|---|---|
| 0.00.3 | 85 | 15 |
| 0.30.45 | 91 | 9 |
| 0.450.6 | 99 | 1 |
| 0.60.8 | 87 | 13 |
| 0.81.0 | 73 | 27 |
| 1.01.2 | 32 | 68 |
| 1.21.7 | 75 | 25 |
| 1.72.0 | 75 | 25 |
| 2.02.5 | 19 | 81 |
| 2.53.0 | 24 | 76 |
| 3.04.2 | 28 | 72 |
Other emission components such as the inverse-Compton scattering due to primary electrons can be also relevant especially at lower energies [62]. Although we do not take them into account in this work, including them will not change our main results and conclusions.
2.3 Results: Extragalactic diffuse gamma-ray background
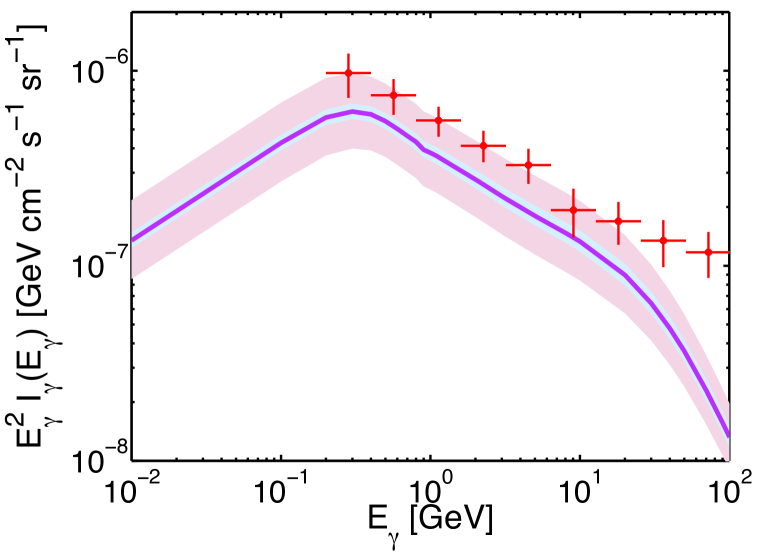
Adopting Eqs. (2.1), (2.2) and (2.4), we calculate the intensity of EGRB. Figure 1 shows as a function of the energy for our canonical model. The magenta line defines the EGRB obtained considering the diffuse gamma-ray intensity evaluated with the IR luminosity function, the light-blue band defines the error band obtained including the uncertainties in the measurements of the parameters in Eq. (2.2), while the pink band defines the uncertainties from Eq. (2.4). The Fermi data [5] are plotted in red.
Our canonical EGRB estimation falls below the Fermi data, especially at GeV and GeV energies, although they are very close to the upper bound of the astrophysical uncertainty region marked by the pink band. The attenuation of the spectrum due to the EBL correction affects the high-energy part of the diffuse EGRB ( GeV), suggesting other sources such as BL Lac objects may contribute to match the observed Fermi data [66]. Note that our EGRB estimation is in agreement with the estimation presented in Ref. [6] adopting the IR luminosity function (see Ref. [62] and Fig. 7 of Ref. [5] and references therein for comparison with previous models). Our canonical model explains about half of the diffuse EGRB in the 0.3–30 GeV range, which is consistent with the results presented in Ref. [62]. Considering the luminosity functions of normal and starburst galaxies only (without SF-AGN), about % of the diffuse EGRB can be explained, which is also in agreement with the results of Ref. [5].
As for NG, we assumed that they have steeper spectra than SB (i.e., ), but we note that this may not be the case at high redshifts since the column density may be higher and, as a result, the spectra might be closer to that of SB. Such an effect might modify our estimation enhancing the EGRB even further at high energies.
The EBL is the background of optical/IR light emitted by stars and AGN, including reprocessed components made by dust, over the lifetime of the Universe. Today this photon background consists of light emitted at all epochs, modified by dilution due to the expansion of the Universe and by the redshift correction. High-energy gamma rays interact with the EBL, and produce electron-positron pairs. This process therefore alters the observed spectra of extragalactic high-energy sources. We estimate that in Fig. 1, the EBL attenuation starts at about GeV and the suppression at GeV is by a factor of . This is slightly different from Fig. 7 of Ref. [5], where the suppression factor at 100 GeV is less than . This is partially because we consider contributions from sources at . If we only consider sources at , the suppression factor is reduced to for the EBL model adopted here. The remaining discrepancy of can be explained by the fact that the EBL model [67] used in Ref. [5] is more conservative (see Refs. [68, 69] for comparison between the EBL model of Ref. [67] adopted in Ref. [5] and our model [63]).
The latest Fermi data show that the EGRB spectrum extends to GeV [70]. Once the EBL attenuation is taken into account, therefore, a simple power-law injection spectrum with positive redshift evolution cannot explain the diffuse EGRB, leading to a very-high-energy gamma-ray excess compared to the EBL-attenuated spectrum [66]. The very-high-energy gamma-ray excess appears because the sum of components with NG and SB-like energy spectra lead to an effective spectral index (see Fig. 1). In principle, if we consider a harder injection spectrum, e.g., only the component with SB-like energy spectrum, it is possible to fit the diffuse EGRB spectrum within EBL uncertainties at high redshifts (see Ref. [15]). However, in the star-forming galaxy scenario, this requires optimistic assumptions. We need a higher starburst fraction and/or smaller values of to achieve smaller effective spectral indices, and the sufficiently large ratio of to is required to adjust the overall normalization. Although we have not included electromagnetic cascades that can relax this tension, our results will not change much as long as we consider . Hence, although we do not exclude the possibility that the diffuse EGRB above 100 GeV energies is explained by galaxies with a SB-like energy spectrum, our canonical model predicts the necessity of another source population at GeV energies, such as BL Lac objects.
2.4 Composition of the extragalactic diffuse gamma-ray background from star-forming galaxies
In Ref. [27], the fraction of detected SB is found to be about of the total galaxies and the fraction of SF-AGN is about at 160 m. However, the starburst fraction is highly uncertain; it changes with the redshift, and several recent studies speculate that it tends to increase at higher redshifts [27, 30, 31]. Moreover, some of the star-forming galaxies containing AGN might have SB-like energy spectra, as we assume in our canonical model.
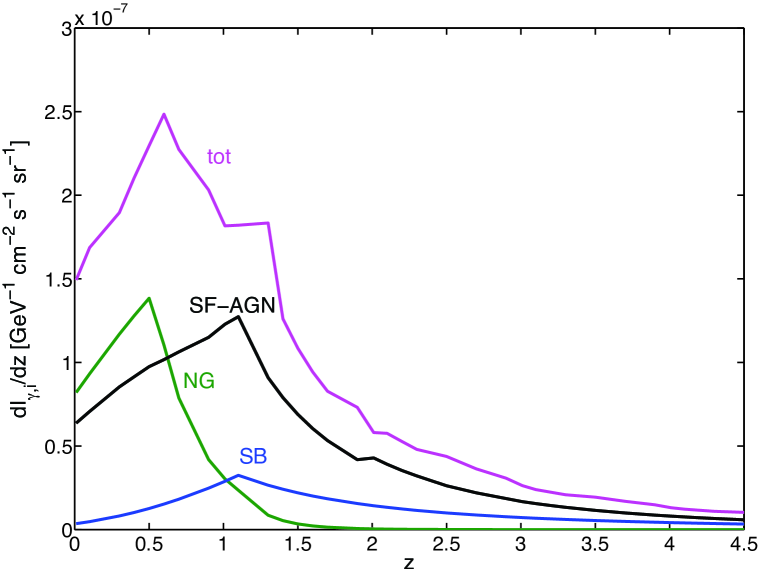
The contributions to the total EGRB from different redshift ranges is shown in Fig. 2, where we plot the differential intensities as a function of for NG (in green), SB (in blue), SF-AGN ( SF-AGN (SB) + SF-AGN (non-SB), in black), and their sum (in magenta) at GeV. The largest contribution to the EGRB comes from and from SF-AGN (including SF-AGN (SB) and SF-AGN (non-SB)). At the EGRB is dominated by NG () and SF-AGN (). The abundance of normal galaxies steeply decreases for and they are practically negligible at , while SF-AGN become the of the total EGRB and SB contribute to the remaining . In agreement with previous estimations, the SB contribution increases with the redshift, becoming 20–30% of the total at .
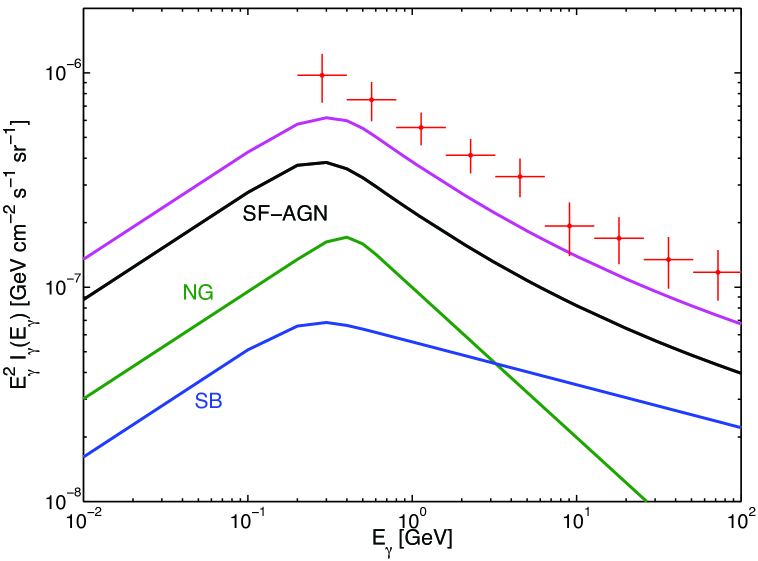
To estimate the contribution of the different families of star-forming galaxies as a function of the energy, Fig. 3 shows the total diffuse gamma-ray intensity without EBL attenuation (magenta line) in comparison with contributions from NG (in green), SB (in blue), SF-AGN (in black) where, within our canonical model, we have assumed that the SF-AGN component is given by the sum of SF-AGN (SB) and SF-AGN (non-SB) as described in Sec. 2.2. Note as the leading contribution comes from SF-AGN and they dominate the high-energy part of the EGRB together with SB with .
3 Diffuse neutrino background from star-forming galaxies
Neutrino production at TeV to PeV energies proceeds via pion production from proton-photon () or proton-gas () interactions. Such interactions produce gamma rays as well
as neutrinos. However the relative flux of neutrinos and gamma rays depends on the ratio of charged to neutral pions, , and the relative neutrino flux per flavor depends on the initial mix of to [71, 72]. In this work we focus on interactions, as they are the dominant hadronic process for the star-forming galaxies. In this case, and the flavor ratio after oscillations is (for both neutrinos and antineutrinos) [71, 72]. Hence, following Refs. [46, 15, 73] and ignoring the absorption during the propagation of photons and neutrinos, the relative differential fluxes of gamma rays and neutrinos are related as
| (3.1) |
with , where the subscript “no abs” means that we do not include the EBL attenuation in the gamma-ray intensity.
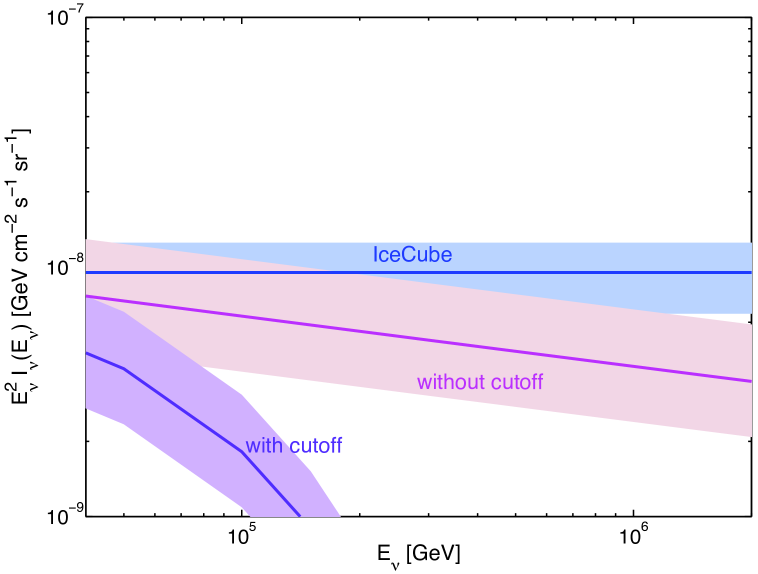
Using Eq. (3.1), the expected neutrino spectrum due to the star-forming galaxies is plotted in Fig. 4 as a function of the energy. The magenta line is our estimated diffuse neutrino intensity, the pink band defines the uncertainty band coming from Eq. (2.4). The blue line is the IceCube measured flux with its uncertainty band (in light blue) as in Eq. (1.1). Our estimated diffuse neutrino intensity is comparable, within the astrophysical uncertainties, to the IceCube measurement up to PeV energies. However, within our canonical model assuming , it is difficult to explain neutrino events around PeV energies. Thus, in order to explain all the IceCube data, we need to consider harder spectral indices (see Sec. 4) or another source component such as galaxy groups/clusters, AGN, and gamma-ray bursts. Note that the diffuse neutrino intensity at TeV-PeV energies is dominated by SB and SF-AGN (SB), and contributions from NG and SF-AGN (non-SB) are negligible because of our assumption of . In addition, we have assumed that the neutrino spectrum can be extrapolated up to PeV energies. However, as discussed below (see Sec. 5), this requires that protons are successfully accelerated to PeV energies, implying that the cosmic-ray spectrum of extragalactic star-forming galaxies is different from that in the MW. For comparison, the diffuse neutrino intensity including an exponential cutoff is plotted in violet, motivated by the fact that the MW cosmic-ray nucleon spectrum has a suppression at the knee [74].
4 Fermi and IceCube bounds on the starburst injection spectra and abundance
The injection spectra of the gamma rays of the starbursts are poorly constrained as well as the fraction of SF-AGN with an energy spectrum similar to SB as discussed in Secs. 2.1 and 2.4. In this Section, we first treat as a free parameter compared to our canonical model, and then change the fraction of SF-AGN with SB-like injection spectra. We compute the resultant diffuse intensities compatible with both the Fermi and IceCube data. It would be interesting to see if one could explain the diffuse neutrino and gamma-ray backgrounds simultaneously.
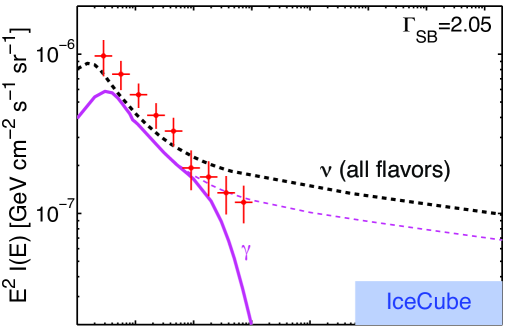
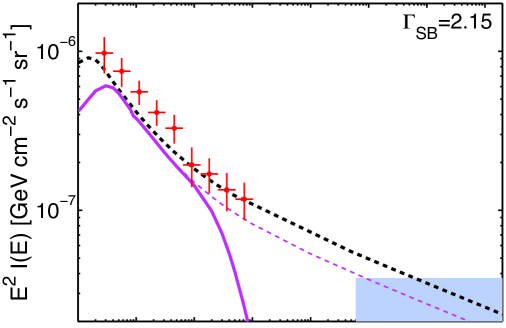
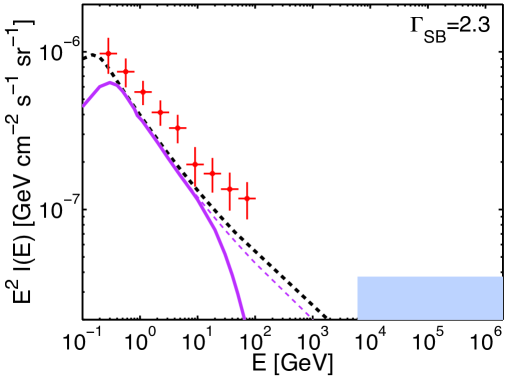
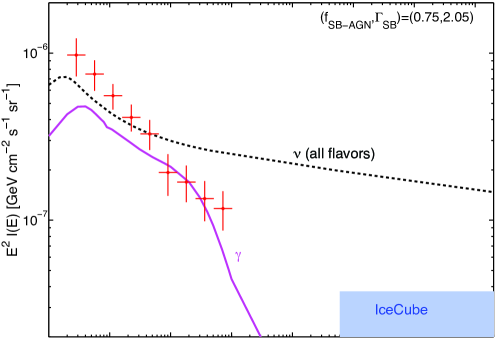
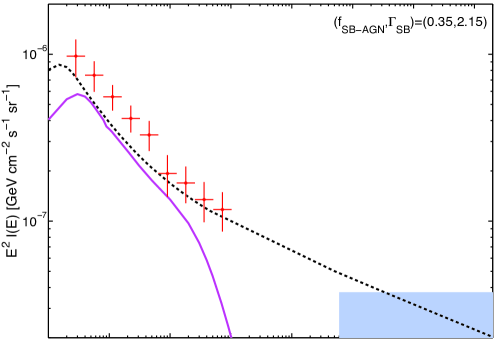
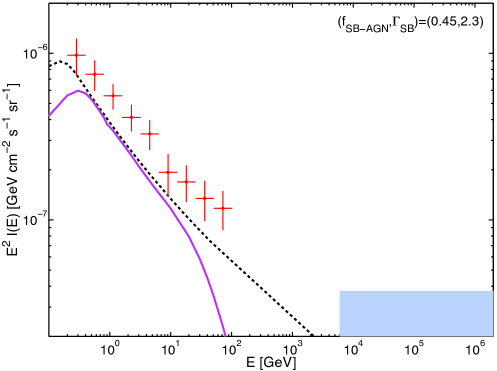
Figure 5 shows the expected diffuse gamma-ray (in magenta) and neutrino intensity (in dashed black) as a function of the energy for our canonical model, assuming and (from top to bottom), while the Fermi data [5] are marked in red and the IceCube region as from Eq. (1.1) in light blue. Although our estimation for the diffuse gamma-ray intensity is always slightly lower than the Fermi data, is currently excluded by the IceCube data (top panel). In order to allow such hard spectra, lower ratios of to are needed. On the other hand, interestingly, an injection spectral index can almost explain the Fermi and IceCube data at the same time (middle panel), although some contributions from other gamma-ray source populations are needed to fit the diffuse EGRB spectrum. The panel on the bottom shows the diffuse intensities of gamma rays and neutrinos for : The resultant gamma-ray intensity is lower than the one measured by Fermi and the corresponding neutrino flux falls below the IceCube band. In order to give an idea of the role of the EBL attenuation for various spectral indices, in Fig. 5 we plot the diffuse gamma-ray intensity without EBL attenuation (dashed magenta line). Note as it closely follows the diffuse neutrino intensity.
In our canonical model we have assumed the spectrum with and , as described in Sec. 2.2. However, besides , also is pretty uncertain and might not follow the distribution adopted in our canonical model. For example, Seyfert systems (belonging to the SF-AGN class) are classified as SF-AGN (non-SB) according to Herschel [27], while Fermi classifies the observed Seyferts systems NGC
1068 and NGC 4945 as starburst galaxies [5]. Similarly Fermi finds that the Circinus galaxy, containing an AGN, has a hard spectral index as SB-like galaxies [21]. Given the present uncertainties, we now leave the fraction of SF-AGN (SB) as free parameter constant with the redshift as well as its spectral index and discuss the expected EGRB. Therefore, here we assume that the fraction of galaxies containing AGN that behaves similarly to starbursts is constant with respect to the redshift (), and compute their allowed regions compatible with both the Fermi and IceCube data. For this purpose, we rewrite Eq. (2.1) as
| (4.1) | |||||
where adopts the IR luminosity function of SF-AGN but assumes the spectra at high energies. On the other hand, is the same except for spectra.
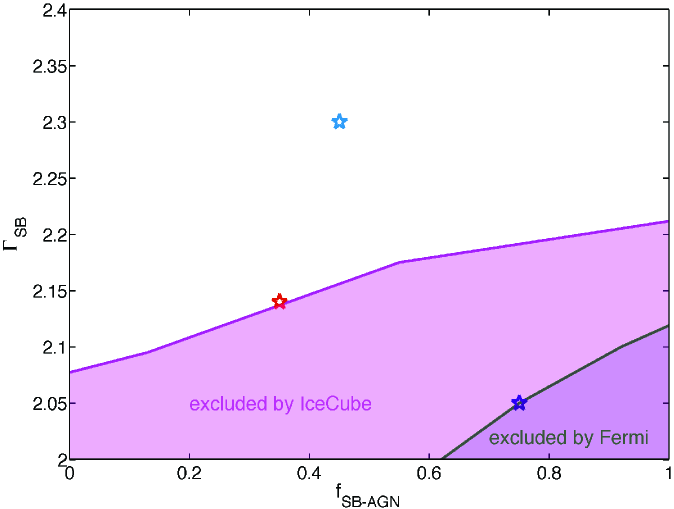
Figure 6 shows the parameter regions, in the plane defined by the injection spectral index () and the fraction of starbursts in the SF-AGN population (), incompatible with the Fermi data [5] or IceCube data as in Eq. (1.1). The Fermi data tend to exclude a smaller region of the parameter space than the IceCube ones. Hard spectra for SB (i.e., ) are excluded from present IceCube data and, as expected, both of the data allow harder spectra for smaller starburst fraction, since they give a lower contribution to the high-energy tail of the spectrum. Note that for , all SF-AGN behave as SB-like galaxies. Such assumption would be compatible with Fermi data for and with IceCube data for . Viceversa, for , all SF-AGN behave as normal galaxies; this is compatible with Fermi data for any and with IceCube data for .
Figure 7 shows the gamma-ray (in magenta) and neutrino (in dashed black) intensities for the three spots marked in Fig. 6. The top panel, corresponding to the blue spot in Fig. 6, shows a diffuse EGRB compatible with the high energy tail of the Fermi data, but a too high diffuse neutrino intensity with respect to the IceCube data. The middle panel, corresponding to the orange spot in Fig. 6, shows gamma-ray and neutrino intensities consistent with both Fermi and IceCube data as well as the bottom panel obtained for corresponding to the light blue spot in Fig. 6. Also in this case, we confirm the trend found in Fig. 5: The injection spectral index matching better the Fermi and IceCube data simultaneously is . Note as, for fixed , Fig. 5 and Fig. 7 look very similar for the adopted .
Independently of our work, Ref. [15] obtained constraints of for general scenarios explaining the IceCube data, in the case of star-formation rate evolution. Interestingly, we have reached the same conclusion in a complementary way. In our star-forming galaxy modeling, the expected EGRB flux should be lower than the Fermi data, and the consistency with the IceCube data holds only when . In particular, the IceCube data can be reproduced by , which is consistent with the above general constraints on scenarios. The diffuse EGRB data can also be explained by starbursts (including those with AGN), but with some contributions from other populations, and details are affected by EBL uncertainties at high redshifts. On the other hand, from Figs. 5, 6 and 7, only is allowed whereas smaller spectral indices are ruled out by both IceCube and Fermi data. Thus, in the star-forming scenario, we conclude that is required to explain % of the IceCube flux by interactions in SB and SF-AGN (SB).
5 High-energy end of the neutrino spectrum
As shown above, star-forming galaxies have enough energy budget to explain the diffuse neutrino intensity. However, there are other requirements to explain PeV neutrinos.
First, cosmic rays should be accelerated to sufficiently high energies. Since a significant contribution comes from –, the typical neutrino energy can be written as
| (5.1) |
where is the proton energy in the cosmic rest frame and is the typical source redshift. Thus, to have PeV neutrinos observed by IceCube, the energy per nucleon should exceed the knee energy at PeV. In the MW, it has been believed that Galactic supernova remnants are the main origin of Galactic cosmic rays [75], but the above equation means that galaxies responsible for PeV neutrinos have to contain more powerful accelerators than in the MW. Rather, neutrinos around a possible PeV break may be related to the origin of cosmic rays close to the second knee [15].
Second, cosmic rays around – PeV should be confined in galaxies, so that they can be sources of PeV neutrinos with sufficiently hard spectra. This implies that magnetic-field properties in these extragalactic starbursts should be different from that in the MW. The Galactic cosmic-ray composition is heavier above the knee, so the cosmic-ray nucleon
spectrum is significantly steeper above that energy. Since the neutrino energy is less for nuclei with the same energy, adopting the observed MW cosmic-ray spectrum leads to a break around 80 TeV in the neutrino spectrum, which looks insufficient to explain the IceCube data without introducing another component (see Fig. 4).
Below, we describe these issues in more detail. Some of them are pointed in Ref. [15], but more extended discussions are useful for the completeness of our work since the extrapolation from GeV to PeV energies is not guaranteed. In particular, we here point out that obscured or low-luminosity AGN in star-forming galaxies may supply sufficiently high-energy cosmic rays.
5.1 Maximum proton energy
Can we expect the proton maximum energy – PeV? Ref. [15] discussed the possibility that peculiar supernovae are responsible for – PeV cosmic rays. For example, gamma-ray bursts and transrelativisitic supernovae (or low-luminosity gamma-ray bursts) may accelerate cosmic rays up to ultrahigh energies, and their cosmic-ray energy generation rate can be –% of that of core-collapse supernovae [76, 77] relevant for the high-energy cosmic-ray spectra beyond the knee [78]. In particular, broadline Type Ibc, often called hypernovae (that are not necessarily relativistic), have kinetic energy erg [79, 80] and their rate is 1–2% of core-collapse supernova rate [81]. At the radius where the ejecta starts to decelerate, the so-called Sedov radius [82, 83], the proton maximum energy is estimated to be , which is the order of PeV. Here and are the ejecta energy and velocity, and is the ambient density [78]. However, these peculiar supernovae are much rarer than normal supernovae. Even though they could be more common at higher redshifts, it is not clear if the energy budget of these peculiar supernovae is comparable to that of normal supernovae. Alternatively, other speculations, including higher values of mG [15] and superbubbles consisting of multiple supernovae [84], have been discussed.
In this work, we have demonstrated that SF-AGN may give an important contribution to the gamma-ray and neutrino backgrounds. They are needed especially if (see Fig. 6). AGN are also potential cosmic-ray accelerators, as has been motivated by recent gamma-ray observations of nearby Seyfert galaxies, NGC 1068 and 4945 (e.g., [85] and references therein). Although the fraction of AGN associated with starbursts is highly uncertain, they are potentially important [53], and we here give quantitative estimates. Most of AGN in star-forming galaxies are radio-quiet quasars or Seyfert galaxies, which are obscured or low-luminosity AGN. Such radio-quiet AGN may have weak jets with luminosity – (e.g., Ref. [86] and references therein), and very-high-energy cosmic rays may be accelerated at shocks caused by the jets [87]. Assuming the jet opening angle and dissipation radius , the magnetic field is written as , where is the magnetic energy fraction. Applying the formula of the non-relativistic shock to the relativistic shock (which gives a rough estimate), we have
| (5.2) |
so that PeV protons may be accelerated by the weak jets. Note that such a low-power jet forms a bubble inside the intergalactic medium, and it will take many years to penetrate the host galaxy. In addition, recent observations have shown that fast outflows from AGN are ubiquitous [88, 89, 90]. The kinetic luminosity of such presumably disk-driven winds () is – percent of the AGN radiation luminosity, and cosmic rays may potentially be accelerated. At the dissipation radius pc, the outflow velocity is of the order of [88]. This leads to a magnetic field . Then, assuming the first-order Fermi acceleration mechanism at shocks, the maximum energy is estimated to be
| (5.3) |
In both the jet and wind cases, – PeV protons may be produced, where SF-AGN could be sources of PeV neutrinos. Note that a lot of possibilities have been suggested but they are not mutually exclusive. Possibly, if we consider transients, one source class could be the origin of cosmic rays from GeV to ultrahigh energies [16]. Our results are useful even in this case.
5.2 Cosmic-ray confinement
Even if the maximum proton energy somehow achieves PeV at the sources, there remains a theoretical question whether it is possible to trap PeV cosmic rays in the galaxies. The criterion is basically determined by comparing the cooling time () and cosmic-ray escape time (). The pionic loss time is given by , where is the column density and is the scale height. The escape time depends on properties of magnetic fields. If cosmic rays are well-trapped in the fluid, their escape is governed by advection losses via starburst-driven or AGN-driven outflows. Using the wind velocity , the advection escape time is estimated to be .
However, especially at high energies, the diffusion escape is expected to be more important. Here, we rely on the analogy with the diffusion model for the MW. To be consistent with and in our canonical model, let us consider as an example (see Ref. [15] for the Kolmogorov case). The confinement of 100 PeV protons requires the critical energy of , leading to the coherence length . The diffusion coefficient at is , so we have for . For the MW, the diffusion coefficient at GeV is . Magnetic fields of starbursts can be times higher, where one may naively expect . But it turns out to be insufficient, since this value is too large for cosmic rays to get confined. In principle, can be as low as . Thus, assuming and optimistically, the diffusion escape time is estimated to be
| (5.4) |
Then, for proton spectra, one would expect a spectral break at if . If , we have .
Prototypical starbursts such as M82 and NGC 253 indicate a column density of and a scale height of pc, so they have difficulty in trapping PeV cosmic-ray protons. Instead, the confinement of PeV cosmic rays may be possible in high redshift starbursts, if the diffusion coefficient around PeV is sufficiently close to that in the Bohm limit [91]. Although details are highly uncertain and beyond the scope of this work, such a situation could be realized, if turbulence is caused by merger shocks or outflows from AGN or continuously generated by supernova shocks. We hope that our work encourages further studies to give physical understandings of plasma and magnetohydrodinamic properties in starburst galaxies.
Finally, we summarize the high-energy end of neutrino spectra. For , we roughly expect
| (5.5) |
where . For , a broken power-law spectrum (that is smoothened by the line-of-sight integral)
| (5.6) |
is expected, where . Interestingly, the present IceCube data indicate a possible break or cutoff energy at a few PeV [35], for sufficiently small spectral indices . If this is the case, revealing this spectral structure is important, and future neutrino observations by IceCube or next-generation detectors will be able to discriminate between the two possibilities.
6 Conclusions
The importance of the EGRB is related to the fact that it encodes unique information about the high-energy processes in the universe, it has an isotropic sky distribution and is dominated by gamma rays induced by cosmic-ray protons and electrons interacting with the target gas and radiation fields. Although main contributions of the diffuse EGRB are likely to come from star-forming galaxies and blazars, such a diffuse background should also include other sub-leading contributions from unresolved extragalactic sources in the different energy range, such as radio galaxies, gamma-ray bursts, intergalactic shocks produced by structure formation, and dark-matter annihilation.
Star-forming galaxies are expected to largely contribute to the – GeV gamma-ray background, because of interactions of cosmic-rays with the diffuse gas. Besides normal galaxies, a special subset of star-forming galaxies are the less numerous, but individually more luminous, starburst galaxies. The starburst galaxies undergo an epoch of star formation in a very localized region at an enhanced rate in comparison to the normal galaxies, due to galaxy mergers or bar instabilities. According to the classification done by Herschel in terms of the luminosity functions, the largest fraction of star-forming galaxies is made by galaxies containing low luminosity or dim AGN, and such family could have an energy spectrum similar to normal galaxy or to starburst galaxies according to the cases. Our understanding of galaxy formation has dramatically improved in the last few years. In particular, the Herschel PEP/HerMES survey has recently provided an estimate of the IR luminosity function up to , finally allowing to explore the galaxy composition for , suggesting that galaxies containing AGN are largely abundant and that the starburst fraction can reach up to of the total at high .
We have provided an estimation of the EGRB adopting IR data at through the luminosity function provided in Ref. [27]. The luminosity function indeed provides a powerful tool to probe the distribution of galaxies over cosmological time, since it allows to access the statistical nature of galaxy formation and their evolution. Our estimation is compatible with the Fermi data in the 0.3–30 GeV range including the astrophysical uncertainties. In our canonical model, the sum of NG and SB components leads to , where we find that high-energy data are not explained due to the EBL attenuation. We identify the very-high-energy gamma-ray excess, which may indicate another population like BL Lac objects, although quantitative details are affected by EBL uncertainties.
High-energy neutrinos are also expected to be emitted by these sources together with gamma rays. Assuming that at least PeV cosmic rays are accelerated and confined in starburst galaxies, we estimated the expected diffuse neutrino background from star-forming galaxies, and find that it can be in agreement with the IceCube data, especially at low energies. Although such estimation needs to be taken with caution since better statistics of the IceCube high-energy events is required, the disagreement at high energies might suggest that the observed IceCube flux is given by the contribution of other sources such as gamma-ray bursts and AGN. In particular, in our star-forming galaxy scenario, we found that for both Fermi and IceCube data are consistently explained.
The Fermi and IceCube data could constrain the abundance and the injection spectral index of the fraction of galaxies containing AGN that behave similarly to starbursts. We find that hard spectra for SB and SB-like SF-AGN (i.e., ) are excluded from present IceCube data and, as expected, the data allow more abundant SB-like galaxies for softer spectra, since they give a lower contribution to the high energy tail of the spectrum.
In conclusion, our understanding of how galaxies evolve has dramatically increased over the last decade and, after the new discovered IceCube high-energy neutrinos, we have shown as a powerful multi-messenger connection between gamma rays and neutrinos can provide important new ways to constrain star-forming galaxy distribution as well as their spectral parameters.
Acknowledgments
We thank John Beacom, Caitlin Casey and Nick Scoville for useful discussions, and the anonymous referee for insightful comments. This work was supported by the Netherlands Organization for Scientific Research (NWO) through a Vidi grant (I.T. and S.A.) and by NASA through Hubble Fellowship Grant No. 51310.01 awarded by the STScI, which is operated by the Association of Universities for Research in Astronomy, Inc., for NASA, under Contract No. NAS 5-26555 (K.M.).
References
- [1] C.E. Fitchel et al., Astrophys. J. 217 (1977) L9.
- [2] C. D. Dermer, “The Extragalactic Gamma Ray Background,” AIP Conf. Proc. 921 (2007) 122 [arXiv:0704.2888 [astro-ph]].
- [3] Y. Inoue, “Extragalactic Gamma-ray Background Radiation from Beamed and Unbeamed Active Galactic Nuclei,” J. Phys. Conf. Ser. 355 (2012) 012037 [arXiv:1108.1438 [astro-ph.HE]].
- [4] A. A. Abdo et al. [Fermi-LAT Collaboration], “The Fermi-LAT high-latitude Survey: Source Count Distributions and the Origin of the Extragalactic Diffuse Background,” Astrophys. J. 720 (2010) 435 [arXiv:1003.0895 [astro-ph.CO]].
- [5] M. Ackermann et al. [Fermi LAT Collaboration], “GeV Observations of Star-forming Galaxies with Fermi LAT,” Astrophys. J. 755 (2012) 164 [arXiv:1206.1346 [astro-ph.HE]].
- [6] F. W. Stecker and T. M. Venters, “Components of the Extragalactic Gamma Ray Background,” Astrophys. J. 736 (2011) 40 [arXiv:1012.3678 [astro-ph.HE]].
- [7] M. Di Mauro, F. Donato, G. Lamanna, D. A. Sanchez and P. D. Serpico, “Diffuse -ray emission from unresolved BL Lac objects,” Astrophys. J. 786 (2014) 129 [arXiv:1311.5708 [astro-ph.HE]].
- [8] A. W. Strong, A. W. Wolfendale, and D. M. Worrall, Mon. Not. Roy. Astron. Soc. 175 (1976) 23.
- [9] A. M. Soltan and J. Juchniewicz, “FIR galaxies and the gamma-ray background,” Astrophysical Letters and Communications 39 (1999) 197 [arXiv:astro-ph/9811405].
- [10] V. Pavlidou and B. D. Fields, “The Guaranteed gamma-ray background,” Astrophys. J. 575 (2002) L5 [arXiv:astro-ph/0207253].
- [11] T. A. Thompson, E. Quataert and E. Waxman, “The Starburst Contribution to the Extra-Galactic Gamma-Ray Background,” Astrophys. J. 654 (2006) 219 [arXiv:astro-ph/0606665].
- [12] A. Loeb and E. Waxman, “The Cumulative background of high energy neutrinos from starburst galaxies,” JCAP 0605 (2006) 003 [arXiv:astro-ph/0601695].
- [13] T. A. Thompson, E. Quataert, E. Waxman and A. Loeb, “Assessing The Starburst Contribution to the Gamma-Ray and Neutrino Backgrounds,” astro-ph/0608699.
- [14] B. C. Lacki, T. A. Thompson, E. Quataert, A. Loeb and E. Waxman, “On The GeV and TeV Detections of the Starburst Galaxies M82 and NGC 253,” Astrophys. J. 734 (2011) 107 [arXiv:1003.3257 [astro-ph.HE]].
- [15] K. Murase, M. Ahlers and B. C. Lacki, “Testing the Hadronuclear Origin of PeV Neutrinos Observed with IceCube,” Phys. Rev. D 88 (2013) 121301 [arXiv:1306.3417 [astro-ph.HE]].
- [16] B. Katz, E. Waxman, T. Thompson and A. Loeb, “The energy production rate density of cosmic rays in the local universe is at all particle energies,” arXiv:1311.0287 [astro-ph.HE].
- [17] A. A. Abdo [Fermi/LAT Collaboration], “Observations of the Large Magellanic Cloud with Fermi,” Astron. Astrophys. 512 (2010) A7 [arXiv:1001.3298 [astro-ph.HE]].
- [18] A. A. Abdo et al. [Fermi LAT Collaboration], “Detection of the Small Magellanic Cloud in gamma-rays with Fermi/LAT” Astron. Astrophys. 523 (2010) A46 [arXiv:1008.2127 [astro-ph.HE]].
- [19] A. A. Abdo et al. [Fermi LAT Collaboration], “Detection of Gamma-Ray Emission from the Starburst Galaxies M82 and NGC 253 with the Large Area Telescope on Fermi,” Astrophys. J. 709 (2010) L152 [arXiv:0911.5327 [astro-ph.HE]].
- [20] A. A. Abdo et al. [Fermi LAT Collaboration], “The First Catalog of Active Galactic Nuclei Detected by the Fermi Large Area Telescope,” Astrophys. J. 715 (2010) 429 [arXiv:1002.0150 [astro-ph.HE]].
- [21] M. Hayashida et al., “Discovery of GeV Emission from the Circinus Galaxy with the Fermi Large Area Telescope,” Astrophys. J. 779 (2013) 131 [arXiv:1310.1913 [astro-ph.HE]].
- [22] J. S. Dunlop, “Observing the first galaxies,” Astrophysics and Space Science Library 396 (2013) 223 [arXiv:1205.1543 [astro-ph.CO]].
- [23] G. Rodighiero et al., “Mid- and Far-infrared Luminosity Functions and Galaxy Evolution from Multiwavelength Spitzer Observations up to ,” Astron. Astrophys. 515 (2010) A8 [arXiv:0910.5649 [astro-ph.CO]].
- [24] H. Dole et al., “The cosmic infrared background resolved by Spitzer. Contributions of mid-infrared galaxies to the far-infrared background,” Astron. Astrophys. 451 (2006) 417 [astro-ph/0603208].
- [25] M. G. Hauser and E. Dwek, “The cosmic infrared background: measurements and implications,” Ann. Rev. Astron. Astrophys. 39 (2001) 249 [astro-ph/0105539].
- [26] J. L. Puget et al., “Tentative detection of a cosmic far - infrared background with COBE,” Astron. Astrophys. 308 (1996) L5.
- [27] C. Gruppioni et al., “The Herschel PEP/HerMES Luminosity Function. I: Probing the Evolution of PACS selected Galaxies to ,” Mon. Not. Roy. Astron. Soc. 432 (2013) 23 arXiv:1302.5209 [astro-ph.CO].
- [28] M. J. Devlin et al., “Over half of the far-infrared background light comes from galaxies at ,” Nature 458 (2009) 737 [arXiv:0904.1201 [astro-ph.CO]].
- [29] M. Bethermin et al., “HerMES: deep number counts at 250, 350, and 500 microns in the COSMOS and GOODS-N fields and the build-up of the cosmic infrared background,” Astron. Astrophys. 542 (2012) A58 [arXiv:1203.1925 [astro-ph.CO]].
- [30] A. J. Barger et al., “Precise Identifications of Submillimeter Galaxies: Measuring the History of Massive Star-Forming Galaxies to ,” Astrophys. J. 761 (2012) 89 [arXiv:1209.1626 [astro-ph.CO]].
- [31] C. M. Casey, D. Narayanan and A. Cooray, “Dusty Star-Forming Galaxies at High Redshift,” arXiv:1402.1456 [astro-ph.CO].
- [32] G. L. Pilbratt et al., “Herschel Space Observatory - An ESA facility for far-infrared and submillimetre astronomy,” Astron. Astrophys. 518 (2010) L1 [arXiv:1005.5331 [astro-ph.IM]].
- [33] M. G. Aartsen et al. [IceCube Collaboration], “First observation of PeV-energy neutrinos with IceCube,” Phys. Rev. Lett. 111 (2013) 021103 [arXiv:1304.5356 [astro-ph.HE]].
- [34] M. G. Aartsen et al. [IceCube Collaboration], “Evidence for High-Energy Extraterrestrial Neutrinos at the IceCube Detector,” Science 342 (2013) 6161, 1242856 [arXiv:1311.5238 [astro-ph.HE]].
- [35] M. G. Aartsen et al. [IceCube Collaboration], “Observation of High-Energy Astrophysical Neutrinos in Three Years of IceCube Data,” arXiv:1405.5303 [astro-ph.HE].
- [36] E. Waxman, “IceCube’s Neutrinos: The beginning of extra-Galactic neutrino astrophysics?,” arXiv:1312.0558 [astro-ph.HE].
- [37] L. A. Anchordoqui et al., “Cosmic Neutrino Pevatrons: A Brand New Pathway to Astronomy, Astrophysics, and Particle Physics,” Journal of High Energy Astrophysics 1-2 (2014) 1 [arXiv:1312.6587 [astro-ph.HE]].
- [38] R. Enberg, M. H. Reno and I. Sarcevic, “Prompt neutrino fluxes from atmospheric charm,” Phys. Rev. D 78 (2008) 043005 [arXiv:0806.0418 [hep-ph]].
- [39] T. K. Gaisser, “Atmospheric leptons, the search for a prompt component,” EPJ Web of Conferences 52 (2013) 09004 [arXiv:1303.1431 [hep-ph]].
- [40] R. Laha, J. F. Beacom, B. Dasgupta, S. Horiuchi and K. Murase, “Demystifying the PeV Cascades in IceCube: Less (Energy) is More (Events),” Phys. Rev. D 88 (2013) 043009 [arXiv:1306.2309 [astro-ph.HE]].
- [41] E. Roulet, G. Sigl, A. van Vliet and S. Mollerach, “PeV neutrinos from the propagation of ultra-high energy cosmic rays,” JCAP 1301 (2013) 028 [arXiv:1209.4033 [astro-ph.HE]].
- [42] O. E. Kalashev, A. Kusenko and W. Essey, “PeV neutrinos from intergalactic interactions of cosmic rays emitted by active galactic nuclei,” Phys. Rev. Lett. 111 (2013) 041103 [arXiv:1303.0300 [astro-ph.HE]].
- [43] A. Bhattacharya, R. Gandhi, W. Rodejohann and A. Watanabe, “The Glashow resonance at IceCube: signatures, event rates and vs. interactions,” JCAP 1110 (2011) 017 [arXiv:1108.3163 [astro-ph.HE]].
- [44] B. Feldstein, A. Kusenko, S. Matsumoto and T. T. Yanagida, “Neutrinos at IceCube from Heavy Decaying Dark Matter,” Phys. Rev. D 88 (2013) 015004 [arXiv:1303.7320 [hep-ph]].
- [45] A. Esmaili and P. D. Serpico, “Are IceCube neutrinos unveiling PeV-scale decaying dark matter?,” JCAP 1311 (2013) 054 [arXiv:1308.1105 [hep-ph]].
- [46] M. Ahlers and K. Murase, “Probing the Galactic Origin of the IceCube Excess with Gamma-Rays,” Phys. Rev. D 90 (2014) 023010 [arXiv:1309.4077 [astro-ph.HE]].
- [47] S. Razzaque, “The Galactic Center Origin of a Subset of IceCube Neutrino Events,” Phys. Rev. D 88 (2013) 081302 [arXiv:1309.2756 [astro-ph.HE]].
- [48] D. B. Fox, K. Kashiyama and P. Mészáros, “Sub-PeV Neutrinos from TeV Unidentified Sources in the Galaxy,” Astrophys. J. 774 (2013) 74 [arXiv:1305.6606 [astro-ph.HE]].
- [49] J. C. Joshi, W. Winter and N. Gupta, “How Many of the Observed Neutrino Events Can Be Described by Cosmic Ray Interactions in the Milky Way?,” Mon. Not. Roy. Astron. Soc. 439 (2014) 3414 [arXiv:1310.5123 [astro-ph.HE]].
- [50] A. M. Taylor, S. Gabici and F. Aharonian, “A Galactic Halo Origin of the Neutrinos Detected by IceCube,” Phys. Rev. D 89 (2014) 103003 [arXiv:1403.3206 [astro-ph.HE]].
- [51] K. Murase and K. Ioka, “TeV-PeV Neutrinos from Low-Power Gamma-Ray Burst Jets inside Stars,” Phys. Rev. Lett. 111 (2013) 121102 [arXiv:1306.2274 [astro-ph.HE]].
- [52] F. W. Stecker, “Ice Cube Observed PeV Neutrinos from AGN Cores,” Phys. Rev. D 88 (2013) 047301 [arXiv:1305.7404 [astro-ph.HE]].
- [53] K. Murase, Y. Inoue and C. D. Dermer, “Diffuse Neutrino Intensity from the Inner Jets of Active Galactic Nuclei: Impacts of External Photon Fields and the Blazar Sequence,” Phys. Rev. D 90 (2014) 023007 [arXiv:1403.4089 [astro-ph.HE]].
- [54] H. -N. He, T. Wang, Y. -Z. Fan, S. -M. Liu, and D. -M. Wei, “Diffuse PeV neutrino emission from ultraluminous infrared galaxies,” Phys. Rev. D 87 (2013) 6, 063011 [arXiv:1303.1253 [astro-ph.HE]].
- [55] R. -Y. Liu, X. -Y. Wang, S. Inoue, R. Crocker, and F. Aharonian, “Diffuse PeV neutrinos from EeV cosmic ray sources: semi-relativistic hypernova remnants in star-forming galaxies,” Phys. Rev. D 89 (2014) 083004 [arXiv:1310.1263 [astro-ph.HE]].
- [56] K. Kashiyama and P. Mészáros, “Galaxy Mergers as a Source of Cosmic Rays, Neutrinos, and Gamma Rays,” Astrophys. J. 790 (2014) L14 [arXiv:1405.3262 [astro-ph.HE]].
- [57] L. A. Anchordoqui et al., “What IceCube data tell us about neutrino emission from star-forming galaxies (so far),” Phys. Rev. D 89 (2014) 127304 [arXiv:1405.7648 [astro-ph.HE]].
- [58] X. -C. Chang and X. -Y. Wang, “The diffuse gamma-ray flux associated with sub-PeV/PeV neutrinos from starburst galaxies,” arXiv:1406.1099 [astro-ph.HE].
- [59] P. Padovani and E. Resconi, “Are both BL Lacs and pulsar wind nebulae the astrophysical counterparts of IceCube neutrino events?,” Mon. Not. Roy. Astron. Soc. 443 (2014) 474 [arXiv:1406.0376 [astro-ph.HE]].
- [60] B. D. Fields, V. Pavlidou and T. Prodanovic, “Cosmic Gamma-Ray Background from Star-Forming Galaxies,” Astrophys. J. 722 (2010) L199 [arXiv:1003.3647 [astro-ph.CO]].
- [61] R. Makiya, T. Totani and M. A. R. Kobayashi, “Contribution from Star-Forming Galaxies to the Cosmic Gamma-Ray Background Radiation,” Astrophys. J. 728 (2011) 158 [arXiv:1005.1390 [astro-ph.HE]].
- [62] B. C. Lacki, S. Horiuchi and J. F. Beacom, “The Star-Forming Galaxy Contribution to the Cosmic MeV and GeV Gamma-Ray Background,” Astrophys. J. 786 (2014) 40 [arXiv:1206.0772 [astro-ph.HE]].
- [63] R. C. Gilmore, R. S. Somerville, J. R. Primack and A. Dominguez, “Semi-analytic modeling of the EBL and consequences for extragalactic gamma-ray spectra,” Mon. Not. Roy. Astron. Soc. 422 (2012) 3189 [arXiv:1104.0671 [astro-ph.CO]].
- [64] R. C. Kennicutt, Jr., “Star formation in galaxies along the Hubble sequence,” Ann. Rev. Astron. Astrophys. 36 (1998) 189 [arXiv:astro-ph/9807187].
- [65] S. ’i. Ando and V. Pavlidou, “Imprint of Galaxy Clustering in the Cosmic Gamma-Ray Background,” Mon. Not. Roy. Astron. Soc. 400 (2009) 2122. [arXiv:0908.3890 [astro-ph.HE]].
- [66] K. Murase, J. F. Beacom and H. Takami, “Gamma-Ray and Neutrino Backgrounds as Probes of the High-Energy Universe: Hints of Cascades, General Constraints, and Implications for TeV Searches,” JCAP 1208 (2012) 030 [arXiv:1205.5755 [astro-ph.HE]].
- [67] A. Franceschini, G. Rodighiero and M. Vaccari, “The extragalactic optical-infrared background radiations, their time evolution and the cosmic photon-photon opacity,” Astron. Astrophys. 487 (2008) 837. [arXiv:0805.1841 [astro-ph]].
- [68] J. D. Finke, S. Razzaque and C. D. Dermer, “Modeling the Extragalactic Background Light from Stars and Dust,” Astrophys. J. 712 (2010) 238 [arXiv:0905.1115 [astro-ph.HE]].
- [69] Y. Inoue et al., “Extragalactic Background Light from Hierarchical Galaxy Formation: Gamma-ray Attenuation up to the Epoch of Cosmic Reionization and the First Stars,” Astrophys. J. 768 (2013) 197 [arXiv:1212.1683 [astro-ph.CO]].
- [70] M. Ackermann, talk presented at “Fourth International Fermi Symposium,“ Monterey, USA (2012), http://fermi.gsfc.nasa.gov/science/mtgs/symposia/2012/.
- [71] T. Kamae, N. Karlsson, T. Mizuno, T. Abe and T. Koi, “Parameterization of Gamma, e+/- and Neutrino Spectra Produced by p-p Interaction in Astronomical Environment,” Astrophys. J. 647 (2006) 692 [Erratum-ibid. 662 (2007) 779] [arXiv:astro-ph/0605581].
- [72] S. R. Kelner, F. A. Aharonian and V. V. Bugayov, “Energy spectra of gamma-rays, electrons and neutrinos produced at proton-proton interactions in the very high energy regime,” Phys. Rev. D 74 (2006) 034018 [Erratum-ibid. D 79 (2009) 039901] [arXiv:astro-ph/0606058].
- [73] L. A. Anchordoqui, H. Goldberg, F. Halzen and T. J. Weiler, “Neutrino bursts from Fanaroff-Riley I radio galaxies,” Phys. Lett. B 600 (2004) 202 [arXiv:astro-ph/0404387].
- [74] M. Kachelriess and S. Ostapchenko, “Neutrino yield from Galactic cosmic rays,” arXiv:1405.3797 [astro-ph.HE].
- [75] J. Blumer, R. Engel and J. R. Horandel, “Cosmic Rays from the Knee to the Highest Energies,” Prog. Part. Nucl. Phys. 63 (2009) 293 [arXiv:0904.0725 [astro-ph.HE]].
- [76] K. Murase, K. Ioka, S. Nagataki and T. Nakamura, “High-energy cosmic-ray nuclei from high- and low-luminosity gamma-ray bursts and implications for multi-messenger astronomy,” Phys. Rev. D 78 (2008) 023005 [arXiv:0801.2861 [astro-ph]].
- [77] X. -Y. Wang, S. Razzaque, P. Mészáros and Z. -G. Dai, “High-energy Cosmic Rays and Neutrinos from Semi-relativistic Hypernovae,” Phys. Rev. D 76 (2007) 083009 [arXiv:0705.0027 [astro-ph]].
- [78] L. G. Sveshnikova, “The knee in galactic cosmic ray spectrum and variety in supernovae,” Astron. Astrophys. 409 (2003) 799 [astro-ph/0303159].
- [79] P. A. Mazzali et al., “The Aspherical Properties of the Energetic Type Ic SN 2002ap as Inferred from its Nebular Spectra,” Astrophys. J. 670 (2007) 592 [arXiv:0708.0966 [astro-ph]].
- [80] Y. -Z. Fan, B. -B. Zhang, D. Xu, E. -W. Liang and B. Zhang, “XRF 100316D/SN 2010bh: clue to the diverse origin of nearby supernova-associated GRBs,” Astrophys. J. 726 (2011) 32 [arXiv:1004.5267 [astro-ph.HE]].
- [81] N. Smith, W. Li, A. V. Filippenko and R. Chornock, “Observed Fractions of Core-Collapse Supernova Types and Initial Masses of their Single and Binary Progenitor Stars,” Mon. Not. Roy. Astron. Soc. 412 (2011) 1522 [arXiv:1006.3899 [astro-ph.HE]].
- [82] G. Taylor, “The formation of a blast wave by a very intense explosion. I. Theoretical discussion,” Proc. R. Soc. A 201 (1950) 159.
- [83] L. I. Sedov, “Motion of air in a strong explosion,” Dokl. Akad. Nauk. SSSR 52 (1946) 17.
- [84] A. M. Bykov and G. D. Fleishman, “On non-thermal particle generation in superbubbles,” Mon. Not. Roy. Astron. Soc. 255 (1992) 269.
- [85] T. M. Yoast-Hull, J. S. G. III, E. G. Zweibel and J. E. Everett, “Active Galactic Nuclei, Neutrinos, and Interacting Cosmic Rays in NGC 253 and NGC 1068,” Astrophys. J. 780 (2014) 137 [arXiv:1311.5586 [astro-ph.HE]].
- [86] M. Mezcua and M. A. Prieto, “Evidence of Parsec-scale Jets in Low-luminosity Active Galactic Nuclei,” Astrophys. J. 787 (2014) 62 [arXiv:1403.6675 [astro-ph.HE]].
- [87] A. Pe’er, K. Murase and P. Mészáros, “Radio Quiet AGNs as Possible Sources of Ultra-high Energy Cosmic Rays,” Phys. Rev. D 80 (2009) 123018 [arXiv:0911.1776 [astro-ph.HE]].
- [88] F. Tombesi et al., “Unification of X-ray winds in Seyfert galaxies: from ultra-fast outflows to warm absorbers” Mon. Not. Roy. Astron. Soc. 430 (2013) 1102 [arXiv:1212.4851 [astro-ph.HE]].
- [89] F. Tombesi and M. Cappi, “On the presence of ultra-fast outflows in the WAX sample of Seyfert galaxies,” Mon. Not. Roy. Astron. Soc. 443 (2014) L104 [arXiv:1406.2645 [astro-ph.HE]].
- [90] C. M. Harrison, D. M. Alexander, J. R. Mullaney and A. M. Swinbank, “Kiloparsec-scale outflows are prevalent among luminous AGN: outflows and feedback in the context of the overall AGN population,” Mon. Not. Roy. Astron. Soc. 441 (2014) 3306 [arXiv:1403.3086 [astro-ph.GA]].
- [91] R. M. Kulsrud, “Plasma Physics for Astrophysics,” Princeton University Press, Princeton, USA (2004).