Study of pressure-induced amorphization in sulfur using ab initio molecular dynamics
Abstract
We report results of ab initio constant-pressure molecular dynamics simulations of sulfur compression leading to structural transition and pressure-induced amorphization. Starting from the orthorhombic S-I phase composed of S8 ring molecules we find at room temperature and pressure of 20 GPa a transformation to monoclinic phase where half of the molecules develop a different conformation. Upon further compression, the monoclinic phase undergoes pressure-induced amorphization into an amorphous phase, in agreement with experiments. We study the dynamics of the amorphization transition and investigate the evolution of intra and intermolecular distances in the monoclinic phase in order to provide a microscopic insight into the rings disintegration process leading to amorphization. In the amorphous form we examine the structural properties and discuss its relation to the experimentally found amorphous form and to underlying crystal phases as well. The amorphous form we find appears to correspond to the experimentally observed low density amorphous form.
pacs:
61.43.Bn, 61.43.Dq, 61.43.-j, 64.70.kgI Introduction
Pressure is a key external variable determining structure and properties of solids. The most dramatic effect induced by pressure are structural transformations between different crystalline phases. Providing access to number of polymorphs, pressure-induced structural transitions are of academic as well as practical interest in solid-state physics and materials science. Besides transitions between stable or metastable crystalline forms, transitions from crystal to amorphous form have been observed in various materials, such as H2O Mishima et al. (1984), Si Deb et al. (2001), SiO2 Hemley et al. (1988), etc. The process has been called pressure-induced amorphization (PIA) and since it was first studied in compressed ice Mishima et al. (1984) its nature as well as the character of the amorphous form created in this way has been extensively discussed (see Refs. Arora (2002); Sharma and Sikka (1996) for a detailed review on this topic). Open questions include a number of issues. First is the connection of the amorphous form created in this way to liquid or crystalline phase. It was recognized that it might be structurally connected either to higher-temperature liquid phase (and its corresponding glass), or, alternatively, could represent a disordered version of some underlying crystalline phase. Another discussion concerns the mechanism of PIA and its thermodynamical description. PIA has been originally explained as metastable melting, recognizing that compressed ice amorphized upon crossing the negatively sloped melting line of water extrapolated to low temperatures Mishima et al. (1984). Another scenario referred as mechanical melting is based on observation that the structure collapse might be driven by elastic or lattice instabilities (by softening of certain elastic or phonon shear modes) at high pressure conditions Binggeli and Chelikowsky (1992); Brazhkin et al. (1997). Upon approaching PIA, it has been commonly observed that the x-ray diffraction patterns become less crystalline suggesting that creation of defects often precede the phenomenon of PIA.
In some materials the existence of more amorphous forms that differ in density and microscopic structure has been observed. This phenomenon was called polyamorphism, analogously to polymorphism. It has been found that at least two different forms exist which have been called low-density-amorphous (LDA) and high-density-amorphous (HDA) forms. Polyamorphism was first observed in compressed ice Mishima et al. (1985) and since then has been experimentally and theoretically studied in a number of other common elements and compounds like Si Deb et al. (2001); Daisenberger et al. (2007), Ge Principi et al. (2004), SiO2 Huang and Kieffer (2004); Trachenko and Dove (2003), etc. While in some cases the amorphous-amorphous transition (AAT) was found to be sharp Mishima et al. (1985); Daisenberger et al. (2007); Principi et al. (2004), in other systems it was observed to proceed gradually Huang and Kieffer (2004); Durandurdu and Drabold (2002). The sharpness of the transition might also be temperature dependent, as observed, e.g. in SiO2, where densification is promoted at elevated temperatures in certain pressure region associated with the ”reversibility window” Trachenko and Dove (2003); Trachenko et al. (2004). Similarly to the case of PIA, it has been found that there could be a connection of AAT to liquid-liquid transition at higher temperatures or to thermodynamical crystal-crystal transformation (see Refs. Sanloup (2010); McMillan (2004, 2002) for a review on the phenomenon of AAT).
Recently the existence of PIA as well as of polyamorphism has been reported also in sulfur Luo and Ruoff (1993); Sanloup et al. (2008); Gregoryanz et al. . Sulfur is one of the most common and important elements and its crystal structure at ambient conditions belongs to the most complex ones found among pure elements. Sulfur was experimentally studied in the pressure range from 0 to 230 GPa and at least ten different stable crystal structures have been identified. Thermodynamic phase diagram of sulfur is presented in Fig. 1. The diagram is based on data from number of experiments Meyer (1976); Degtyareva et al. (2005a, 2007a, b, 2007b, c); Hejny et al. (2005); Crapanzano et al. (2005); Zakharov and Cohen (1995); Luo and Ruoff (1993).
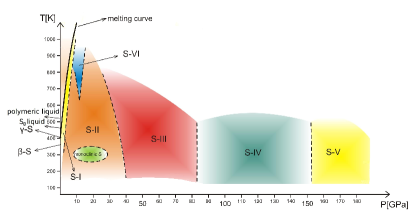
The stable structure of sulfur at ambient conditions is orthorhombic structure S-I which is highly complex as its unit cell consists of 128 atoms in 16 S8 ring molecules. At temperatures close to melting curve, S-I transforms to S-II upon pressure increase at 1.5 GPa and if thereafter quenched to room temperature, S-II transforms further to S-III at 36 GPa Degtyareva et al. (2007a). The structures of S-II and S-III are similar - both are polymeric and consist of chains. S-II is trigonal and formed by molecules with shape of triangular chains and S-III is tetragonal with square-shaped chains Fujihisa et al. (2004); Degtyareva et al. (2005a, 2007a, c). Both structures are very different from the molecular S-I phase and therefore one can expect that they are separated from S-I by high energy barriers. The complex transition mechanism between molecular and polymeric sulfur needs to include bond breaking in S8 molecules and complete reorganization of the entire structure.
At pressures over 83 GPa, S-III transforms into aperiodic incommensurately (IC) modulated monoclinic phase S-IV Hejny et al. (2005); Degtyareva et al. (2007b); Nishikawa (2008). Further increase of pressure above 135 GPa results into formation of phase S-V with rhombohedral -Po structure Degtyareva et al. (2005b, 2007b, c); Luo et al. (1993). The high-pressure phases of sulfur exhibit different electrical properties. While low-pressure phases up to S-II are insulating, S-III is a semiconductor and S-IV and higher-pressure phases are found to be metallic and superconducting Nishikawa (2008); Nishikawa et al. (1999); Zakharov and Cohen (1995); Luo et al. (1991); Dunn and Bundy (1977); Gregoryanz et al. (2002).
Sulfur at ambient pressure melts at 115C Meyer (1976) and then upon rising temperature undergoes a liquid-liquid transition at around 160C Bellissent et al. (1990); Kalampounias et al. (2003); Scopigno et al. (2007) from S8 molecular liquid to viscous polymeric liquid with rubberlike properties Monaco et al. (2005) that is metallic Springborg and Jones (1986). The process of ring-opening polymerization resulting into creation of helical chains was simulated in Refs.Tse and Klug (1999); Jones and Ballone (2004). By rapid quenching of this sulfur melt, amorphous version of solid sulfur that contains polymeric chains is created. Very stable version of amorphous sulfur prepared by a rapid compression to 2 GPa has been recently reported Yu et al. (2009).
Because of high barriers separating S-I from polymeric phases one can expect strong kinetic effects and metastability, in particular at low temperatures. Indeed, it was found that at room temperature compression of S-I results in a transformation to S-III only when pressure of 36 GPa is reached, thus completely skipping the S-II structure Degtyareva et al. (2007a). Metastability of the S-I molecular phase is found also in all experiments observing PIA, upon approaching the pressure of amorphization Luo and Ruoff (1993); Sanloup et al. (2008); Gregoryanz et al. .
Luo and Ruoff Luo and Ruoff (1993) compressed S-I at room temperature and found a transition to a monoclinic phase at about 5 GPa. It was, however, not possible to determine the exact structure of this phase. Upon further increase of pressure they observed a reversible amorphization starting at 18 GPa and completed at 25 GPa. Between 18 and 25 GPa they observed significant decrease in intensity and increase in width of diffraction peaks resulting in lower number of diffraction peaks observed. Recrystallization to an unknown phase was observed at 37 GPa Luo et al. (1993). Similar results were observed in Ref. Akahama et al. (1993).
In Ref. Luo and Ruoff (1993) authors proposed two possible mechanisms of PIA. In the first scenario the system attempts to transform into new structure but remains trapped in disordered state before completing the transition because of insufficient mobility of the atoms which does not allow the reorganization of the structure. The second scenario represents amorphization triggered by intramolecular bond breaking.
In Ref. Gregoryanz et al. , Gregoryanz et al. studied amorphization of sulfur at room temperature and below. They also observed that diffraction reflections first start to broaden and decrease in intensity at 25 GPa between 80 K and 175 K. Subsequently, PIA takes place and is completed at 47 GPa at 80 K, at 45 GPa at 175 K and at 37 GPa at 300 K. In addition to PIA, Ref. Sanloup et al. (2008) reported the observation of LDA-HDA polyamorphic transition in sulfur above 65 GPa at temperature 40 K. According to the density and coordination number measured for these forms, authors suggested that the LDA and HDA forms might correspond to their crystalline counterparts, namely polymeric S-III and metallic S-IV. They also pointed out that there is a crossing of the S-III/S-IV phase boundary behind the LDA-HDA transition. However, they also admit the possibility that besides a genuine polyamorphism the experimental data might be also compatible with the creation of small nanocrystals in the sample. This cannot be distinguished from the genuine amorphous form within the resolution of the x-ray diffraction technique.
In this paper we aim at resolving the open questions concerning the PIA and polyamorphism in sulfur by means of ab initio constant-pressure molecular dynamics. Both Refs. Luo and Ruoff (1993); Gregoryanz et al. indicate that before PIA the structure undergoes substantial changes. It is plausible to assume that in the conditions of strong overpressurization the S8 molecules do not remain intact and become distorted even before the onset of PIA. Since it was not possible to determine the precise character of these structural changes experimentally, it appears useful to complement the experiments by computer simulation. This could also shed light on the microscopic mechanism of the PIA and help to understand the subsequent polyamorphic transition. The paper is organized as follows. In section 2 we present the simulation method. In section 3 we describe the simulation protocol and discuss the results and compare them to experimental data. In the final section we draw some conclusions.
II Simulation methods and results
To perform ab initio molecular dynamics (MD) simulations we used VASP package Kresse and Furthmüller (1996a, b); Kresse and Hafner (1993, 1994). To simulate system under constant pressure, we used the idea based on the Berendsen barostat Berendsen et al. (1984). After performing 20 MD steps with time step of 2 fs in constant supercell (total simulated time of 40 fs), we rescaled parameters of the supercell according to the difference of external pressure and instantaneous internal pressure in the system following the Berendsen scheme. We note that our procedure is slightly different from the original one Berendsen et al. (1984) because we do not apply the scaling at every MD step.
The cell matrix where the three vectors span the simulation supercell, together with atomic positions and velocities were transformed by the scaling matrix following the rule
h, , ,
,
where is the bulk modulus of the system, is the time step of the transformation (40 fs in our case) and is the relaxation time scale defining how quickly the algorithm responds to pressure fluctuations (only the ratio is relevant).
All simulations were performed on a sample consisting of 512 atoms in a supercell (generated as supercell of S-I unit cell) with periodic boundary conditions. The core electrons were dealt with the projector augmented wave (PAW) pseudopotential method Blöchl (1994); Kresse and Joubert (1999). Each atom contributed to the electronic problem with 6 electrons from and sulfur valence orbitals. These electrons were treated by means of density functional theory (DFT) within the generalized gradient approximation (GGA) in the Perdew-Burke-Ernzerhof Perdew et al. (1996) (PBE) scheme. The Kohn-Sham equations Kohn and Sham (1965) were solved in a plane wave basis set with energy cutoff of 360 eV. Since the supercell was fairly large ( Å at 0 GPa) the k-point grid was well approximated by taking only the -point.
III Simulation results and discussion
III.1 Simulation protocol
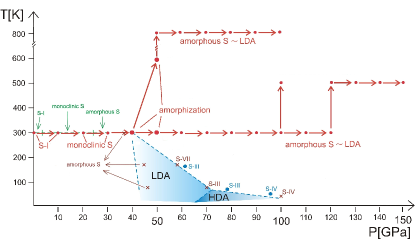
The simulation protocol together with the experimental data for amorphous sulfur from Refs. Luo and Ruoff (1993); Sanloup et al. (2008); Gregoryanz et al. is schematically shown on Fig. 2. We started the simulation from the optimized S-I structure at 0 GPa and 0 K and initially heated the system at zero pressure to 300 K. Afterwards we gradually increased pressure in 10 GPa steps keeping the temperature at 300 K. We allowed the system to equilibrate for 4 ps at pressures up to 30 GPa and for 10-30 ps at higher pressures where substantial structural changes take place. At 20 GPa we observed a transition to a new molecular phase with monoclinic lattice formed by S8 molecules with two different conformations. Upon further increase of pressure to 40 GPa we observed initial creation of structural defects in molecular structure where few bond interchanges between nearby molecules were present. From this point, we proceeded with simulation along three different paths. We extended the 40 GPa simulation up to nearly 30 ps which gave us access to detailed information about early stages of PIA. Second, after 4 ps run at 40 GPa, we increased pressure to 50 GPa and beyond, keeping the system at room temperature. Third, we increased both pressure to 50 GPa and temperature to 600 K in order to further accelerate PIA. PIA in our simulations was therefore observed at three different P-T conditions. The amorphous state created at 50 GPa thereafter persisted to very high P-T points (150 GPa, 500 K) and (100 GPa, 800 K) with no sign of progress in recrystallization or transition to different amorphous form (Fig. 2).
In the following subsections we discuss in detail the properties of the monoclinic phase, analyze the origin and dynamics of the PIA transformation and study the properties of the amorphous form. We shall denote the monoclinic and amorphous forms found in our simulations as m-S and a-S.
III.2 Monoclinic sulfur
As we increased pressure from 10 GPa to 20 GPa, the supercell of S-I distorted by lowering the angle from 90 to 86.5 at 40 GPa according to MD simulations at 300 K and subsequent geometric optimization at zero temperature. This change of supercell is compatible with change of lattice symmetry from orthorhombic to monoclinic. At the same time half of the originally identical S8 molecules deformed to less symmetric form. We denote these deformed S8 molecules in m-S as type B and the original ones as type A.
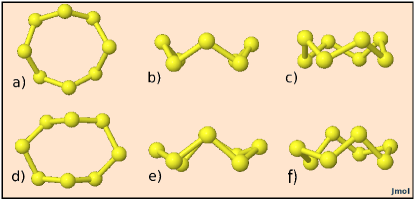
Type A molecules are naturally most common 8-atomic ring-puckered isomer with crown shape Meyer (1976); Jones and Ballone (2003); Hohl et al. (1988). This isomer forms , and -S structures and is also present in liquid sulfur. Type B molecules originated from deformation of type A molecules and possess lower symmetry. Their shape is shown and compared to the isomer in Fig. 3 together with the schematic view on the structure of m-S.
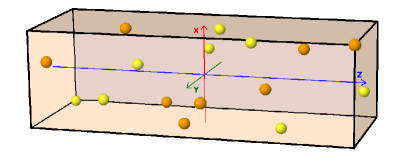
As far as m-S appears to be a new structure of sulfur, we optimized the 128 atom cell representing quarter of the simulation supercell. The relation of m-S to monoclinic-S found by Luo and Ruoff could not be determined because structural data for this phase are not available. We were not able to find the exact space group symmetry for this complex monoclinic phase with large unit cell.
We also calculated the equation of states (EOS) of S-I and m-S to compare their relative stability. According to the calculated EOS, we found that m-S at zero temperature is more stable than S-I at pressures greater than 29 GPa. We also found that optimization of the m-S unit cell at 50 GPa and higher pressures resulted into formation of amorphous form directly during structural optimization. This leads to the conclusion that 50 GPa is the upper limit of the metastability of molecular m-S structure and beyond 50 GPa m-S cannot exist anymore.
III.3 Mechanism and dynamics of pressure-induced amorphization
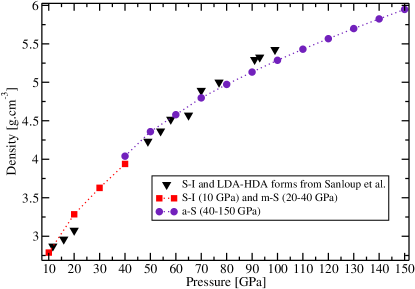
The 30 ps simulation run at 40 GPa gives us access to detailed information about the early stages of PIA. On Fig. 4 we show the evolution of the system density from the beginning of compression (at 0 ps) from 30 to 40 GPa till the end of the 40 GPa run. In this figure, the elastic and non-elastic parts of the density increase can be clearly recognized. The increase of density from 3.63 to 3.94 g cm-3 at 1.5 ps corresponds to the elastic compression of molecular m-S. At 1.5 ps, the pressure in the system is equilibrated to external 40 GPa, and the m-S structure in next 6.5 ps does not undergo any change. At 8 ps, however, the system spontaneously starts to amorphize and one can see a step-wise decrease of volume persisting until 21 ps of the MD run. Volume reduction during amorphization is accompanied by further decrease of the monoclinic angle from 86.5 to 83.2 in a-S at the end of the MD run. The resulting amorphous version of sulfur at 40 GPa has density of 4.04 g cm-3 that corresponds to density increase of 2.54% from m-S at 40 GPa. It is plausible to assume that the compression would further continue if longer simulation times were accessible. Amorphous versions of sulfur obtained at pressure of 50 GPa and temperatures of 300 and 600 K were investigated to much higher pressures (to 150 GPa in lower and to 100 GPa in higher temperature branch). We did not observe any significant jump in density that could be associated with the LDA to HDA polyamorphic transition. The graph of densities of sulfur from 10 to 150 GPa together with the data from Refs. Sanloup et al. (2008); Sanloup (2010) is shown in Fig. 5. Together with the increase of density, the process of amorphization between 8 ps and 21 ps leads into an increase of average energy while enthalpy decreases by 30 meV per particle.
Since during the amorphization transformation the atoms are likely to diffuse over finite distances away from their original positions in the crystalline phase we computed the time-dependent mean square displacement (MSD) of atoms and molecular mass-centers in order to monitor the diffusion during amorphization. The values of are evaluated as
,
where are the initial positions which are subtracted from the actual ones at every time step. We have plotted the time-dependent MSD of atoms and mass-centers for m-S and a-S at 40 GPa in the inset of Fig. 4. From the graph, one can see a clear difference between the character of MSD in crystalline and amorphous sulfur in the time interval where both phases exist. The crystalline case is recognized by a constant value of MSD between 1.5 and 8 ps, while during the amorphization, MSD of atoms and mass-centers grows even after 28 ps. This shows that despite volume is stabilized at 21 ps, the structure continues to evolve as amorphization proceeds. This also points to the intrinsic time-scale limitation of the ab initio study since following the evolution of this fairly large system over substantially longer time, although very desirable, would be prohibitively expensive.
In molecular crystals at low pressure the intermolecular distances between atoms are typically much larger than the corresponding intramolecular ones. Upon compression the former ones decrease as the molecules approach each other and when the two kinds of distances become comparable a transition from molecular to non-molecular, or polymeric phase, may take place. Examples are N2 Goncharov et al. (2000), CO2 Santoro et al. (2006), etc. It is plausible to assume that a similar scenario may apply here. In particular, the PIA of the strongly overpressurized ring-molecular phase could be triggered as the molecules approach each other closely.
In order to check this possibility we focused on the evolution of intramolecular bond lengths and intermolecular distances upon increasing pressure. Compression of m-S leads to considerable decrease in intermolecular space, while the intramolecular bond lengths remain practically unchanged. We also observed a lowering of the bond angles in molecules from 107 at 10 GPa to 97 at 40 GPa.
In Fig. 6 we present the distributions of the nearest neighbors (n.n.) intramolecular distances (bond lengths) and the nearest intermolecular distances in S-I and m-S at pressures from 10 to 40 GPa. Every molecule contributes with 8 values to both histograms and the nearest intermolecular distance is defined as the closest distance between the atom and all atoms in other molecules.
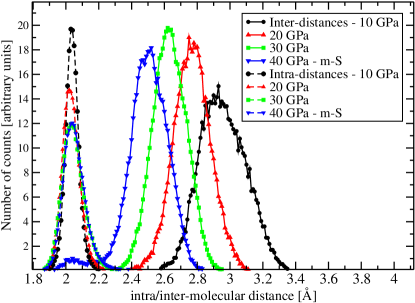
We see that up to the pressure of 30 GPa the two distributions are clearly separated and do not overlap. Under these conditions the molecular phase persists. At 40 GPa, we see that the intermolecular distribution develops a small peak located around the sulfur bond length. This points to the existence of structural defects in m-S where certain atoms from different molecules start bonding.
Even without existence of defects, the figure reveals that at 40 GPa molecules interact strongly as their intra and intermolecular distances distributions start to overlap. We note that in experiment at room temperature the PIA was observed at 37 GPa Gregoryanz et al. which is in perfect agreement with our results. The data suggest that PIA is likely to be primarily driven by the overlap of these two distributions, similarly to other cases of molecular to non-molecular transformation in crystals.
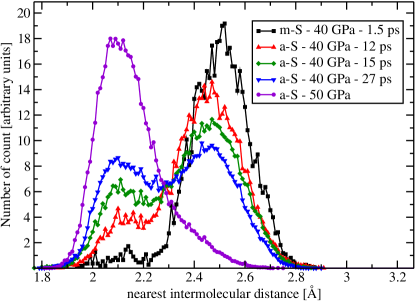
This scenario is further confirmed by analyzing the dynamics of the early stages of the PIA. We show in Fig. 7 the evolution of the nearest intermolecular distances histograms averaged over short time intervals at 12, 15 and at 27 ps of the 40 GPa run. As presented in the figure, the character of the nearest intermolecular distance distribution considerably changes at 12 ps when it develops a major peak weighted around the sulfur bond length. At the end of the 40 GPa run, many of the atoms are already forming covalent bonds with atoms from different - previously separated molecules. By visual inspection we also find that the amorphization process proceeds mainly around the original structural defects.
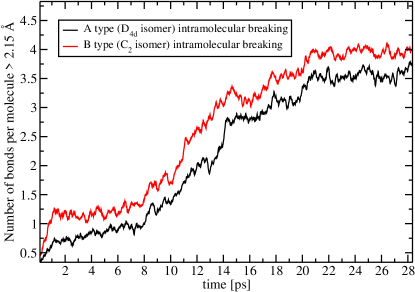
In order to further clarify the amorphization transformation, we also study the interactions between type A and type B molecules separately. In Fig. 8 we show the evolution of the number of intramolecular distances longer than 2.15 Å for A and B molecules. (This limit has been conventionally chosen and is 5.4 % longer than sulfur covalent diameter 2.04 Å). The number of bond lengths longer than 2.15 Å in type B molecules is always somewhat greater than in A molecules indicating that type B molecules are more likely to develop bond breakings than A molecules.
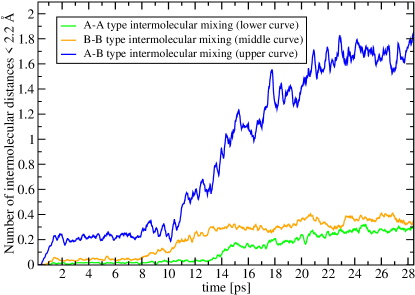
As a complementary information to bond lengths evolution, on Fig. 9 we investigate the number of intermolecular distances shorter than 2.2 Å (close intermolecular approachings) for A-A, B-B and A-B pairs separately. The figure confirms that B molecules are indeed more involved in the early stages of amorphization which starts by a sudden increase of the number of the B-B approachings at 8 ps. Only after next two picoseconds, molecules A and B start to mix together as the A-B curve starts to grow after 10 ps. The mixing of A molecules starts even later, 3 ps after the beginning of A-B mixing. At the end of the run at 40 GPa, approximately 30 % of all atoms have one atom from a different molecule closer than 2.2 Å, in average. This clearly shows that the amorphization at 40 GPa proceeds slowly and even after 30 ps we still observe early stages of the process.
Altogether, the analysis of bond lengths and intermolecular distances evolution during amorphization provides interesting information about the ring disintegration process leading to amorphization. In particular, we identify the different role played by the A and B molecules.
In order to further characterize the transition from crystalline to disordered structure, we also note that the mean intramolecular distance between previously identified n.n. grew from 2.06 Å in m-S at 40 GPa to 2.60 Å in a-S at 50 GPa. Although this quantity no longer represents any kind of bond length, it provides information about the amount of diffusion in the system, in addition to the previously shown time-dependent MSD.
III.4 Amorphous form
S-I at ambient pressure is a soft material with = 7.7 GPa. This reflects the presence of fairly large intermolecular space. The crystal to amorphous form transition at 40 GPa is accompanied by sharp increase of density (Figs. 4 and 5) possibly indicating the first-order nature of the transition as suggested in Ref. Sanloup et al. (2008).
After obtaining a-S at 50 GPa, we performed further simulations at higher pressures and also at higher temperatures (Fig. 2). Even at the highest pressure of 150 GPa and elevated temperature of 800 K at 100 GPa we have not found any evidence of recrystallization or transition to a distinct amorphous form. On the contrary, we have found a-S created at 50 GPa to remain without any serious change of structure, except for slow equilibration of the first peak of the radial distribution function (RDF) of a-S, as will be discussed later. The lack of observation of recrystallization in our simulations was most likely caused by short time scale of our simulations. In principle, the non-observation of transition to HDA form, if this indeed exists, could be related to the same time scale problem.
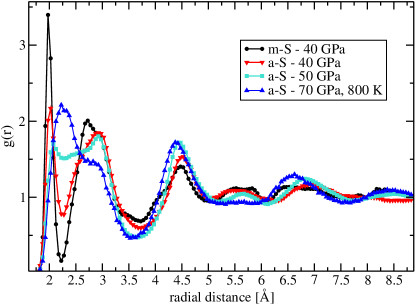
In Fig. 10, we present the RDFs of m-S at 40 GPa and a-S at 40, 50 and 70 GPa. The decrease of the first peak maximum and the filling of the first minimum is a consequence of breaking of intramolecular bonds. As molecules start to disintegrate and make more bonds with other molecules, the first two peaks start merging, although second peak remains recognizable even to highest P-T conditions investigated in our simulations. This persisting first peak separation indicates that some short-range order of m-S remains present during simulated PIA, since there is still some abundance of the next-to-n.n. distances. This implies that our a-S still contains some fragments of the original S8 molecules.
Next, we analyze the properties of a-S and its correspondence to the LDA form from Ref. Sanloup et al. (2008). We find that a-S and LDA are indeed very similar, but the possible relation of a-S to some underlying crystalline phase could not be clearly identified.
First, we observe that the RDF of a-S corresponds quite well to the RDF of LDA from Ref. Sanloup et al. (2008). We refer to the resemblance between the RDF of LDA at 65 GPa (Ref. Sanloup et al. (2008)) and the RDF of a-S at 70 GPa shown in blue in Fig. 10. The agreement of the densities between a-S and LDA is also very good, especially at 60 GPa.
Next, we find that the value of the coordination number in a-S at 50 GPa is NC = 16.2 (for Å) and NC = 16.1 at 70 GPa ( Å) which is again in close agreement with the experimental value of 16.1 at 65 GPa from Ref. Sanloup et al. (2008). This suggests that our a-S is indeed similar to the experimentally observed LDA form.
Now, we discuss the suggestion put forward in Ref. Sanloup et al. (2008), namely that the LDA form might be structurally related to crystal phase S-III. This suggestion was based on the comparison of density and coordination number, which is 17 in S-III for the same radius as for LDA. This relation also seems plausible taking into account the positions of the two forms in the phase diagram.
While NC in the S-III phase calculated to the first LDA minimum is 17, we found that NC for m-S at 40 GPa with cutoff = 3.8 Å (which is the first minimum of a-S at 40 GPa), equals 15.9. We note that in case of m-S the distance of 3.8 Å naturally corresponds to the second RDF minimum at 40 GPa. Therefore the simulated a-S could also be structurally related to its parent phase m-S, rather than to S-III.
Change of the structure of sulfur under pressure is also accompanied by change of its electronic properties. We found that the amorphization at 40 and at 50 GPa is also accompanied by metallization. According to the computed electronic density of states (DOS), we found m-S to be an insulator up to 30 GPa with energy band gap of 0.4 eV at 20 GPa and 0.1 eV at 30 GPa. At 40 GPa, we found a small elevation of the DOS minimum at Fermi energy to a non-zero value before amorphization of m-S started. In case of a-S at 40 GPa and at higher pressures, we find the amorphous form to be metallic. Due to the well-known problem of underestimation of energy gap in DFT calculations using approximate exchange-correlation functionals it is possible that the true gaps in respective phases might be larger.
IV Conclusions
We performed ab initio constant-pressure MD simulations of elemental sulfur on a sample containing 512 atoms. We observed two transitions - from S-I to m-S at 20 GPa and from m-S to a-S at 40 and 50 GPa. The structure of m-S is similar to S-I and might correspond to monoclinic-S observed by Luo and Ruoff in Ref. Luo and Ruoff (1993). It consists of distorted (called type B) and undistorted (type A) S8 molecules. While the a-S form we found appears rather similar to the experimentally found LDA form from Ref. Sanloup et al. (2008), we did not find a subsequent transition to HDA form. This could either reflect a too short time scale of our simulations, or the possibility put forward in Ref.Sanloup et al. (2008) that the observed LDA and HDA form might actually have nanocrystalline structure. The possible relation of a-S to underlying crystal phase is not clear since we found similarities to both m-S and S-III. The density-driven amorphization process starts at 40 GPa when the distributions of nearest intra and intermolecular distances begin to overlap. This leads to bond interchanges and eventually to molecular disintegration and formation of structurally disordered phase. We found that in the early stages of the amorphization process the B molecules are substantially more involved than A molecules. It would be interesting to obtain, if possible, high-quality diffraction pattern for the crystalline structure before PIA and compare it to our m-S.
Acknowledgements.
This work was supported by the Slovak Research and Development Agency under Contract No. APVV-0558-10 and by the project implementation 26220220004 within the Research & Development Operational Programme funded by the ERDF.References
- Mishima et al. (1984) O. Mishima, L. D. Calvert, and E. Whalley, Nature 310, 939 (1984).
- Deb et al. (2001) S. K. Deb, M. Wilding, M. Somayazulu, and P. F. McMillan, Nature 414, 528 (2001).
- Hemley et al. (1988) R. J. Hemley, A. P. Jephcoat, H. K. Mao, L. C. Ming, and M. H. Manghnani, Nature 334, 52 (1988).
- Arora (2002) A. K. Arora, in High Pressure Phenomena, edited by R. J. Hemley and G. L. Chiarotti (IOS PRESS, Amsterdam, The Netherlands, 2002), pp. 545–560, ISBN 1-58603-269-0.
- Sharma and Sikka (1996) S. M. Sharma and S. K. Sikka, Prog. Mat. Sci. 40, 1 (1996).
- Binggeli and Chelikowsky (1992) N. Binggeli and J. R. Chelikowsky, Phys. Rev. Lett. 69, 2220 (1992).
- Brazhkin et al. (1997) V. V. Brazhkin, A. Lyapin, O. Stalgorova, E. Gromnitskaya, S. Popova, and O. Tsiok, Jour. Non-cryst. Solids 212, 49 (1997).
- Mishima et al. (1985) O. Mishima, L. D. Calvert, and E. Whalley, Nature 314, 76 (1985).
- Daisenberger et al. (2007) D. Daisenberger, M. Wilson, P. F. McMillan, R. Q. Cabrera, M. C. Wilding, and D. Machon, Phys. Rev. B 75, 224118 (2007).
- Principi et al. (2004) E. Principi, A. DiCicco, F. Decremps, A. Polian, S. DePanfilis, and A. Filipponi, Phys. Rev. B 69, 201201 (2004).
- Huang and Kieffer (2004) L. Huang and J. Kieffer, Phys. Rev. B 69, 224203 (2004).
- Trachenko and Dove (2003) K. Trachenko and M. T. Dove, Phys. Rev. B 67, 212203 (2003).
- Durandurdu and Drabold (2002) M. Durandurdu and D. A. Drabold, Phys. Rev. B 65, 104208 (2002).
- Trachenko et al. (2004) K. Trachenko, M. T. Dove, V. Brazhkin, and F. S. El’kin, Phys. Rev. Lett. 93, 135502 (2004).
- Sanloup (2010) C. Sanloup, in High-Pressure Crystallography: From Fundamental Phenomena to Technological Applications, edited by E. Boldyreva and P. Dera (Springer, Dordrecht, The Netherlands, 2010), chap. 37, pp. 459–468, ISBN 978-90-481-9260-1(HB).
- McMillan (2004) P. F. McMillan, Jour. Mat. Chem. 14, 1506 (2004).
- McMillan (2002) P. F. McMillan, in High Pressure Phenomena, edited by R. J. Hemley and G. L. Chiarotti (IOS PRESS, Amsterdam, The Netherlands, 2002), pp. 511–541, ISBN 1-58603-269-0.
- Luo and Ruoff (1993) H. Luo and A. L. Ruoff, Phys. Rev. B 48, 569 (1993).
- Sanloup et al. (2008) C. Sanloup, E. Gregoryanz, O. Degtyareva, and M. Hanfland, Phys. Rev. Lett. 100, 075701 (2008).
- (20) E. Gregoryanz, C. Sanloup, O. Degtyareva, R. J. Hemley, and M. Hanfland, personal communication.
- Meyer (1976) B. Meyer, Chemical Reviews 76, 367 (1976).
- Degtyareva et al. (2005a) O. Degtyareva, E. Gregoryanz, M. Somayazulu, P. Dera, H. K. Mao, and R. Hemley, Nature materials 4, 152 (2005a).
- Degtyareva et al. (2007a) O. Degtyareva, E. Hernández, J. Serrano, M. Somayazulu, H. K. Mao, E. Gregoryanz, and R. Hemley, J. Chem. Phys. 126, 084503 (2007a).
- Degtyareva et al. (2005b) O. Degtyareva, E. Gregoryanz, M. Somayazulu, H. K. Mao, and R. J. Hemley, Phys. Rev. B 71, 214104 (2005b).
- Degtyareva et al. (2007b) O. Degtyareva, M. V. Magnitskaya, J. Kohanoff, G. Profeta, S. Scandolo, M. Hanfland, M. I. McMahon, and E. Gregoryanz, Phys. Rev. Lett. 99, 155505 (2007b).
- Degtyareva et al. (2005c) O. Degtyareva, E. Gregoryanz, H. K. Mao, and R. J. Hemley, High Press. Res. 25, 17 (2005c).
- Hejny et al. (2005) C. Hejny, L. F. Lundegaard, S. Falconi, M. I. McMahon, and M. Hanfland, Phys. Rev. B 71, 020101 (2005).
- Crapanzano et al. (2005) L. Crapanzano, W. A. Crichton, G. Monaco, R. Bellissent, and M. Mezouar, Nature materials 4, 550 (2005).
- Zakharov and Cohen (1995) O. Zakharov and M. L. Cohen, Phys. Rev. B 52, 12572 (1995).
- Oganov and Glass (2006) A. R. Oganov and C. W. Glass, J. Chem. Phys. 124, 244704 (2006).
- Pastorino and Gamba (2003) C. Pastorino and Z. Gamba, J. Chem. Phys. 119, 2147 (2003).
- Rudin and Liu (1999) S. P. Rudin and A. Y. Liu, Phys. Rev. Lett. 83, 3049 (1999).
- Fujihisa et al. (2004) H. Fujihisa, Y. Akahama, H. Kawamura, H. Yamawaki, M. Sakashita, T. Yamada, K. Honda, and T. LeBihan, Phys. Rev. B 70, 134106 (2004).
- Nishikawa (2008) A. Nishikawa, Journal of Physics: Conference Series 121, 012008 (2008).
- Luo et al. (1993) H. Luo, R. G. Greene, and A. L. Ruoff, Phys. Rev. Lett. 71, 2943 (1993).
- Nishikawa et al. (1999) A. Nishikawa, K. Niizeki, and K. Shindo, Phys. stat. sol. (b) 211, 373 (1999).
- Luo et al. (1991) H. Luo, S. Desgreniers, Y. K. Vohra, and A. L. Ruoff, Phys. Rev. Lett. 67, 2998 (1991).
- Dunn and Bundy (1977) K. J. Dunn and F. P. Bundy, J. Chem. Phys. 67, 5048 (1977).
- Gregoryanz et al. (2002) E. Gregoryanz, V. V. Struzhkin, R. J. Hemley, M. I. Eremets, H. K. Mao, and Y. A. Timofeev, Phys. Rev. B 65, 064504 (2002).
- Bellissent et al. (1990) R. Bellissent, L. Descotes, F. Boué, and P. Pfeuty, Phys. Rev. B 41, 2135 (1990).
- Kalampounias et al. (2003) A. G. Kalampounias, K. S. Andrikopoulos, and S. N. Yannopoulos, J. Chem. Phys. 118, 8460 (2003).
- Scopigno et al. (2007) T. Scopigno, S. N. Yannopoulos, F. Scarponi, K. S. Andrikopoulos, D. Fioretto, and G. Ruocco, Phys. Rev. Lett. 99, 025701 (2007).
- Monaco et al. (2005) G. Monaco, L. Crapanzano, R. Bellissent, W. Crichton, D. Fioretto, M. Mezouar, F. Scarponi, and R. Verbeni, Phys. Rev. Lett. 95, 255502 (2005).
- Springborg and Jones (1986) M. Springborg and R. O. Jones, Phys. Rev. Lett. 57, 1145 (1986).
- Tse and Klug (1999) J. S. Tse and D. D. Klug, Phys. Rev. B 59, 34 (1999).
- Jones and Ballone (2004) R. O. Jones and P. Ballone, in 3rd International Conference: Computational Modeling and Simulations of materials, edited by P. Vincenzini and A. Lami (2004), pp. 281–288.
- Yu et al. (2009) P. Yu, W. H. Wang, R. J. Wang, S. X. Lin, X. R. Liu, S. M. Hong, and H. Y. Bai, Appl. Phys. Lett. 94, 011910 (2009).
- Akahama et al. (1993) Y. Akahama, M. Kobayashi, and H. Kawamura, Phys. Rev. B 48, 6862 (1993).
- Kresse and Furthmüller (1996a) G. Kresse and J. Furthmüller, Phys. Rev. B 54, 11169 (1996a).
- Kresse and Furthmüller (1996b) G. Kresse and J. Furthmüller, Comput. Mat. Sci. 6, 15 (1996b).
- Kresse and Hafner (1993) G. Kresse and J. Hafner, Phys. Rev. B 47, 558 (1993).
- Kresse and Hafner (1994) G. Kresse and J. Hafner, Phys. Rev. B 49, 14251 (1994).
- Berendsen et al. (1984) H. J. C. Berendsen, J. P. M. Postma, W. F. van Gunsteren, A. DiNola, and J. R. Haak, J. Chem. Phys. 81, 3684 (1984).
- Blöchl (1994) P. E. Blöchl, Phys. Rev. B 50, 17953 (1994).
- Kresse and Joubert (1999) G. Kresse and D. Joubert, Phys. Rev. B 59, 1758 (1999).
- Perdew et al. (1996) J. P. Perdew, K. Burke, and M. Ernzerhof, Phys. Rev. Lett. 77, 3865 (1996).
- Kohn and Sham (1965) W. Kohn and L. J. Sham, Phys. Rev. 140, 1133 (1965).
- Jones and Ballone (2003) R. O. Jones and P. Ballone, J. Chem. Phys. 118, 9257 (2003).
- Hohl et al. (1988) D. Hohl, R. O. Jones, R. Car, and M. Parrinello, J. Chem. Phys. 89, 6823 (1988).
- (60) Jmol: an open-source java viewer for chemical structures in 3d. http://www.jmol.org/.
- Goncharov et al. (2000) A. F. Goncharov, E. Gregoryanz, H. K. Mao, Z. Liu, and R. J. Hemley, Phys. Rev. Lett. 85, 1262 (2000).
- Santoro et al. (2006) M. Santoro, F. A. Gorelli, R. Bini, G. Ruocco, S. Scandolo, and W. A. Crichton, Nature 441, 857 (2006).