Hα Spectral diversity of type II supernovae: correlations with photometric properties111This paper includes data gathered with with the 6.5 m Magellan Telescopes located at Las Campanas Observatory, Chile; and the Gemini Observatory, Cerro Pachon, Chile (Gemini Program GS-2008B−Q−56). Based on observations collected at the European Organisation for Astronomical Research in the Southern Hemisphere, Chile (ESO Programmes 076.A-0156, 078.D-0048, 080.A-0516, and 082.A-0526
Abstract
We present a spectroscopic analysis of the Hα profiles of
hydrogen-rich type II supernovae. A total of 52 type II supernovae having
well sampled optical light curves and spectral sequences were analyzed.
Concentrating on the Hα P-Cygni profile we measure its velocity
from the FWHM of emission and the ratio of absorption to emission () at
a common epoch at the start of the recombination phase,
and search for correlations between these spectral parameters and
photometric properties of the -band light curves. Testing the
strength of various correlations we find that appears to be
the dominant spectral parameter in terms of describing the diversity in our
measured supernova properties. It is found that supernovae with
smaller have higher Hα velocities, more rapidly
declining light curves from maximum, during the plateau and
radioactive tail phase, are brighter at maximum light and have shorter
optically thick phase durations. We discuss possible explanations
of these results in terms of physical properties of type II supernovae,
speculating that the most likely parameters which influence the
morphologies of Hα profiles are the mass and density profile of
the hydrogen envelope, together with additional emission components
due to circumstellar interaction.
Subject headings:
(stars:) supernovae: general1. Introduction
Type II Supernovae (SNe II) are produced by the final explosion of
massive ( M⊙) stars. They retain a significant part of
their hydrogen envelope at the time of the explosion, and hence their
spectra show strong Balmer lines. Studies of the variety of SNe II
have relied on photometric analysis, cataloging this group in two
sub-classes according to the shape of the light curve: SNe with a
plateau (quasi-constant luminosity for a period of a few months) are
classified as SNe IIP, while SNe with steeper declining linear
light curves as SNe IIL (Barbon et al., 1979).
However, despite the role played by
SNe II in stellar evolution, the impact on their environments and
their importance as standardized candles, an overall picture
describing the physics which underpins their diversity is lacking.
It has been suggested that SNe IIL are produced by progenitors which
explode with smaller mass H envelopes, which then lead to SNe with
more linearly declining light curves and shorter or non-existent
‘plateaus’ (Popov, 1993). Indeed, this was argued to
be the case for the prototype SN IIL 1979C (Branch et al., 1981).
This would imply that SNe IIL progenitors suffer from a higher level of
mass-loss than their IIP counterparts. In addition, a number of
SNe IIL have shown evidence for circumstellar (CSM) interaction at
late times (e.g. SN 1986E, Cappellaro et al. 1995;
SN 1979C, Milisavljevic et al. 2009), which has been interpreted as
evidence of interaction of the ejecta with the pre-supernova CSM
(see e.g. Sahu et al. 2006, Inserra et al. 2013).
However, a number of authors have also claimed evidence for signs of CSM
interaction in SNe IIP (e.g. SN 1999em, Pooley et al. 2002;
SN 2004et, Kotak et al. 2009; SN 2007od,
Inserra et al. 2011, Andrews et al. 2010;
SN 2009bw, Inserra et al. 2012).
In recent years many individual studies have been published focusing
on particular properties of individual SNe, but few statistical
studies where the spectral and photometric properties have been
directly related are available. Patat et al. (1994) found
correlations and anti-correlations between the maximum B-band magnitude
(), the color at maximum () and the ratio of
absorption to emission () in Hα, concluding that SNe IIL
have shallower P-Cygni profiles (larger values) than SNe IIP.
Hamuy & Pinto (2002) analysed 17 SNe IIP and found
that SNe with brighter plateaus have higher expansion velocities.
Similar results were found by Pastorello et al. (2004) with four SNe II,
who concluded that low luminosity SNe have narrow spectral lines indicating
low expansion velocities.
Hamuy (2003) used observations together with the analytical
models of Litvinova & Nadezhin (1983, 1985) to
derive physical SN IIP properties. He
found that more massive progenitors produce more
energetic explosions and in turn produce more nickel. These results were
confirmed by Pastorello et al. (2003) with a heterogeneous group
of SNe II that share a very wide range of physical properties.
Despite the above results, it is currently unclear whether underlying spectral and
photometric relations exist for the whole ensemble of SN II events.
Therefore, here we attempt to remedy this situation by presenting
an initial statistical analysis of various spectroscopic and photometric properties
of a large sample of SNe II.
In this letter we present results showing the diversity of Hα
P-Cygni profiles, and relations between spectral and photometric
parameters for a sample of 52 SNe. The letter is organized as follows.
In § 2 we outline our SN sample and we define the
measurements, then in § 3 we present the results. In § 4
possible physical explanations of those results are discussed, and finally
in § 5 we list our conclusions. We note that a detailed analysis
of the -band light curve properties of the currently analyzed sample of SN II
is being presented in Anderson et al. (submitted, hereafter A14).
2. SN II data and measurements
The sample of SNe II employed in this study was obtained by the Carnegie
Supernova Project (CSP, Hamuy et al. 2006) between 2004 and
2009 plus previous campaings: the Calan/Tololo Supernova Survey (CT),
the Cerro Tololo SN program, the Supernova Optical and Infrared Survey
(SOIRS) and the Carnegie Type II Supernova Survey (CATS). The full spectroscopic
sample will be published in an upcoming paper. Data reductions were
performed with IRAF222IRAF is distributed by the National Optical
Astronomy Observatories (NOAO), which are operated by the Association of
Universities for Research in Astronomy (AURA), Inc., under cooperative
agreement with the National Science Foundation. using the standard
routines (bias subtracted, flat-field correction, 1-D extraction and
wavelength correction). Detailed discussion of
spectroscopic observations and reductions for CSP was first presented in
Hamuy et al. (2006), then outlined further in
Folatelli et al. (2013). These are also applicable to previous data.
From this database we selected a sub-sample of events with sufficient
data to measure our spectral and photometric parameters.
SN IIn and SN IIb were not analysed in this work.
SNe II show a large diversity in their spectra. As the dominant
spectral feature is the Hα P-cygni profile,
for this initial study we concentrate on this line’s properties.
The Hα line presents a diversity that can
be derived from the shape and strength in the emission and absorption,
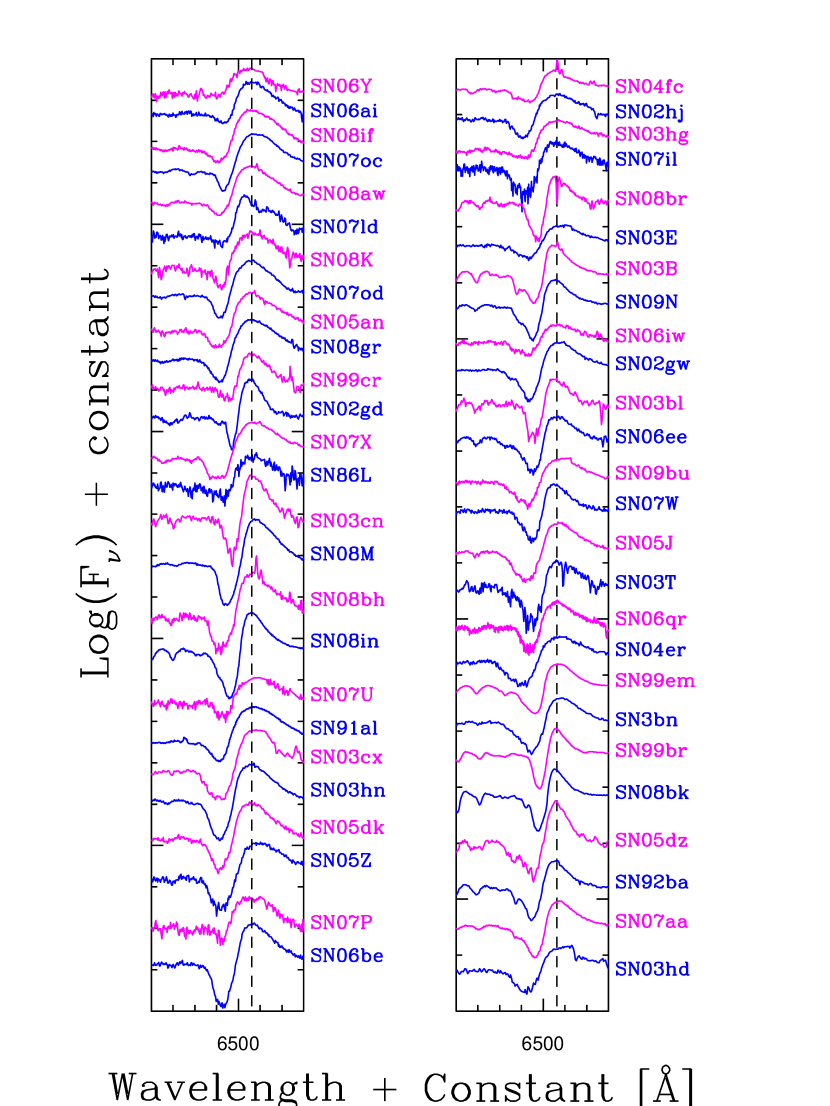
and in the line width. Figure 1 shows the variety in SNe II
Hα P-Cygni profiles, where the SNe are ordered in terms of
an increasing ratio of absorption to emission () components (as
defined below) around a common epoch at the start in the recombination phase.
We see that the absorption is the component which
changes most from one SN to another rather than the emission.
There are SNe with little absorption (e.g. SN 2006ai,
SN 2006Y), while there are others with boxy absorption profiles
(e.g. SN 2003cx, SN 2007X). One can observe in Figure 1 that the first
SNe show little absorption compared to emission. Gradually
the SNe change to show more classic P-Cygni profiles with significant
absorption components. A number of SNe show an
extra absorption component on the blue side of Hα
(e.g. SN 2003hn, SN 2007od, SN 2008aw).
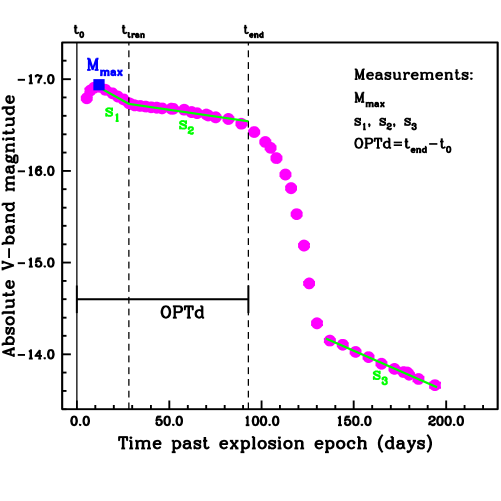
To analyze the SNe spectra within our sample we define two measurements: (1) the expansion velocity in Hα via the FWHM of the emission, and (2) the ratio of equivalent widths of absorption to emission components of Hα. This ratio was initially proposed by Patat et al. (1994) as the flux ratio of the emission to absorption. However, we choose because in a few SNe Hα shows an extremely weak absorption component. In order to relate spectral and light curve properties we use the V-band photometric properties as defined by A14: : initial decline from the maximum (magnitudes ), : ‘plateau’ decline rate (magnitudes ), : radioactive tail decline (magnitudes ), Mmax: magnitude at V-band maximum, and OPTd: optically thick phase duration (days): time from the explosion epoch through to the end of the plateau phase. We define a common epoch in order to measure spectral properties, which we identified in the light curves: the B-band transition time plus 10 days (, at the start of the recombination phase). The transition time is defined as the transition between and determined by chi-square minimization. It is measured in the B-band because the transition is more evident than in V-band, and therefore we can include more SNe in our analysis. We interpolate all the spectral measurements to this epoch. These parameters are all labeled in the light-curve parameter schematic presented in Figure 2 (left).
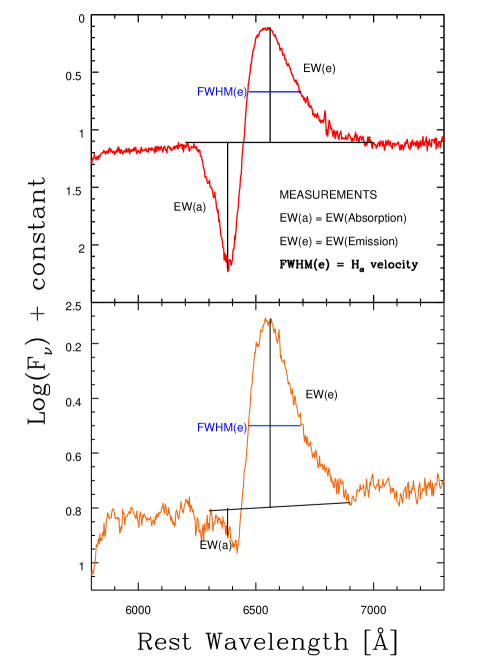
To estimate SN ejecta expansion velocities through Hα the minimum flux of the absorption component of P-Cygni line profile is commonly used. However, a few SNe in this sample present an extremely weak absorption component, complicating this method. Therefore, we employ the FWHM of emission line for velocity estimations. To verify the concordance between these methods we measure velocities from the minima of absorption and the FWHM of the emission in Hα in SNe with a well defined absorption, finding consistent results. The ratio of absorption to emission () in Hα was obtained by measuring the equivalent widths (EW) of each component. Examples of these measurements are shown in Figure 2 (right). The top panel shows a normal Hα P-Cygni profile, i.e., a profile with well defined absorption and emission components, while the bottom panel shows a peculiar profile with an extra absorption component on the blue side. Similar features were identified by Leonard et al. (2001), Leonard et al. (2002a) and Leonard et al. (2002b) in SN 1999em as high velocity (HV) features, while in the case of SN 2005cs the line was identified as Si II absorption (Pastorello et al., 2006). This peculiar structure complicates measurements of the EW of absorption, because it is hard to objectively define the continuum. Therefore, we simply trace a straight line along the absorption feature to mimic the continuum flux, which can be seen in Figure 2 (right). All spectral measurements were performed with IRAF using the splot package. The errors for the Hα velocity and are mainly dominated by how the continuum is defined. Errors were obtained by measuring many times the FWHM and the EW, respectively, changing the trace of the continuum. Using these multiple measurements we calculate a mean and take the standard deviation to be the error on that measurement.
3. Results
In Table 1 we list the measured spectral and photometric parameters:
Hα velocity, , , ,
, Mmax and OPTd for each SN, together with the host
galaxy, the heliocentric radial velocity and . We searched for correlations
between all seven of our defined parameters against each other at different
epochs: , , , , (measured
in B-band), and 30 and 50d since explosion. Using the Pearson
correlation test, was observed to be the dominant measured spectral parameter as
it has the highest correlation with all other parameters at all epochs. However, at
the correlations are strongest, hence this time was chosen as the common epoch.
This is justified from a physical point of view because at this epoch all SNe are entering to a
similar phase in their evolution, i.e. the recombination phase.
The photometric parameter has the highest mean correlation,
however it shows no correlation with the Hα velocity,
while shows high correlation with all parameters.
In A14 the photometric correlations are presented. Table 2 shows
the strength of the correlations between all our parameters, plus the number of events
(within each correlation), and the probability of finding such a correction by chance.
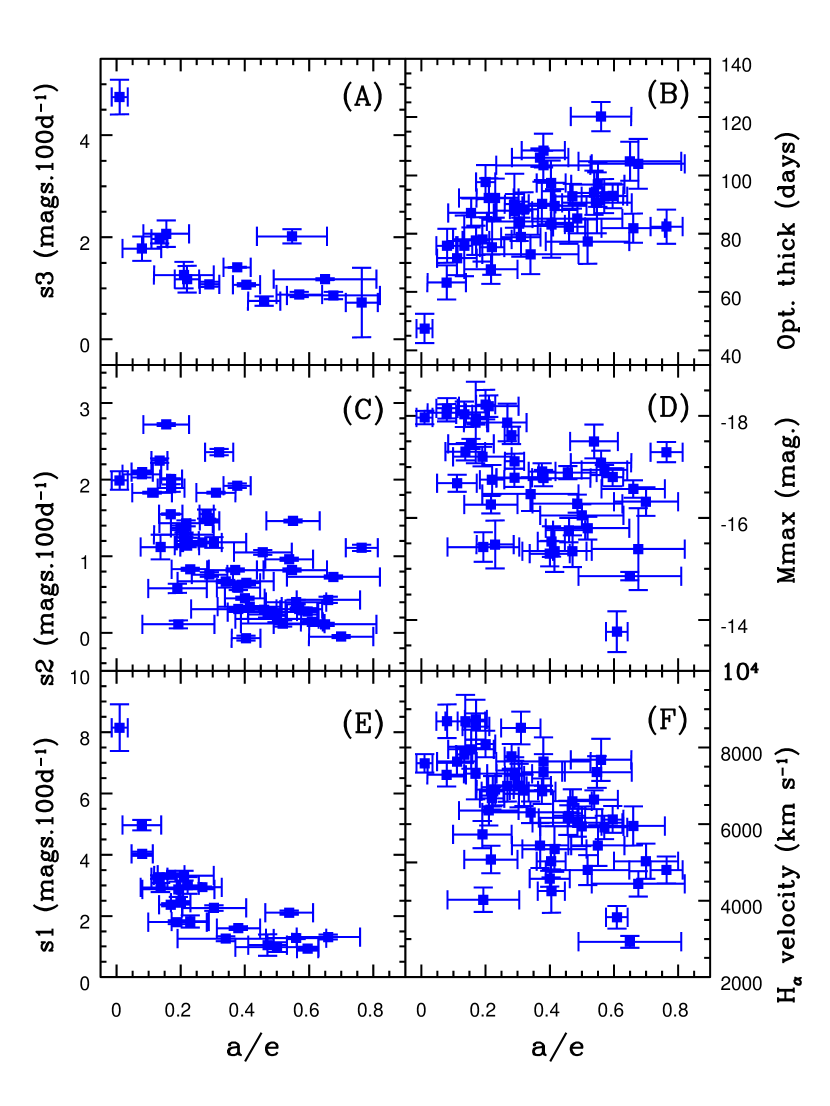
The light curve parameters plus the Hα velocity are plotted
versus in Figure 3. The plot shows that SNe with smaller
have higher Hα velocities, more rapidly declining light curves
after maximum, both in the ‘plateau’ and radioactive tail phases, are
brighter and have shorter OPTd values. SNe with higher show opposite
behavior. Given that OPTd and are most likely related to
the envelope/ejecta mass (see A14 for detailed discussion),
this would appear to imply that is also related to the mass retained by the
progenitor before explosion. Indeed, this further points to SNe historically
classified as IIL (high ) having smaller mass envelopes at the
epoch of explosion than their IIP (low ) counterparts.
Moreover, we see a continuum of events in terms of spectral
diversity, thus suggesting a possible continuum in pre-SN envelope masses.
In Figure 3 one can see an extreme object specifically in panels A, B and E,
SN 2006Y. To test whether this object drives our correlations we re-do the Pearson test for
all correlations removing this object. While of the strength of the correlations decrease
very slightly all correlations hold, and therefore this object is not driving our results.
We also searched for correlations between and the photospheric velocity,
derived from the minimum of absorption of the Fe II 5169 line at
the epoch defined above. However, perhaps surprisingly, no evidence for
correlation was found.
4. Discussion
We have presented and analysed the Hα
spectral diversity in 52 SNe II and their correlations with
photometric parameters. Analyzing the sample we see a variety in
the Hα P-Cygni profiles which can be derived from the shape
and strength in the emission and absorption, and in the line width.
Patat et al. (1994) found that M and
correlate with in Hα, concluding that SNe IIL have
larger values (i.e. small values). While in our sample we
have not made distinctive IIP-IIL classification, our results are
consistent with these of Patat et al. (1994), which show that SNe with
high values (faster declining light
curves) have small values and are more luminous.
Arcavi et al. (2012) identified a subdivision of SNe II
(based on 21 events in the R-band) suggesting that
SNe IIL and SNe IIP are not members of one continuous class and
may result from different physical progenitor systems.
However, A14 with a bigger sample (116 events in the V-band)
suggest an observational continuum of events which may be driven by differences
of envelope mass at the epoch of explosion,
a parameter which is most directly constrained in A14 through observations
of the optically thick phase duration (OPTd) and the decline rate
during the radioactive tail ().
This conclusion of an observational continuum is also
supported by the spectral analysis presented in this paper (see Figure 3), where
differences in the spectral parameters (especially ) may also be explained
by changes in the hydrogen envelope mass retained.
Schlegel (1996) discussed possible explanations for
the behavior of the Hα P-Cygni profile with the most likely
being: (1) extra emission fills in the absorption component
(as can be seen in SN 2008aw, Figure 2, bottom); (2) the
envelope mass is low; and (3) a steep density gradient
in the hydrogen envelope. The first explanation invokes scattering
of emission off either CSM or the outer envelope (in the case of very
extended envelope). The second
explanation is described in a low-mass envelope, where there is less
absorbing material, so little P-Cygni absorption component will be formed.
The third explanation argues that a very steep density gradient
implies less absorbing material at high velocities, and so does not
produce a well defined P-Cygni profile. Although these considerations
could explain the diversity found in our sample, numerous studies
discuss other explanations based on the complex P-Cygni
line profiles. Baron et al. (2000) granted the term
‘complicated P-Cygni profile’ to explain the double P-Cygni absorption
found in Balmer Series and He I in SN 1999em,
concluding that these absorption features arise in two velocity
regions in the expanding ejecta of the SN at different velocities.
Pooley et al. (2002) argue that this extra component
might be the signature of weak interaction with a low density CSM,
while Chugai et al. (2007) attributes these features to ejecta
wind interactions.
In conclusion, the change in Hα P-Cygni profile ( and FWHM of emission)
is most likely related to two parameters: changes in the envelope properties (i.e. its
mass and density profile) and the degree of CSM interaction.
Although the possible explanations for the behavior of the
Hα P-Cygni profile have been exposed, these
extra components could be attributed to HV H I features or, absorption
lines of other ions (Si II). This issue will be further explored after
a full spectral analysis. This will determine if similar features are also present in
the blue side of He I and Hβ.
5. Conclusions
We have presented an initial analysis of the spectral diversity Hα of SNe II and how this relates to light curve properties. It has been found that while much diversity and peculiarities exist, spectral and photometric properties do appear to be correlated which can be linked to pre-SN properties. We finally list our main conclusions:
-
•
is an important parameter describing the spectral diversity of SNe II.
-
•
SNe with low values appear to have high velocities and decline rates, are brighter and have a smaller OPTd values.
-
•
While any definitive spectral distinction between IIP and IIL is not clear, SNe with higher values (i.e. more ‘linear’ SNe) have smaller values, have higher Hα velocities, and are more luminous.
-
•
We speculate that the envelope mass retained before explosion and the density gradient play a very important role to determine the differences of Hα P-Cygni profile.
-
•
CSM interaction could also be a cause of the change in the P-Cygni profiles, suggesting that faster declining SNe have more intense interactions.
This paper presented a first analysis of SN II spectral from CSP. The full analysis of that sample (optical and near IR photometry and spectroscopy) promises to significantly further our knowledge of the SN II phenomenon.
References
- Andrews et al. (2010) Andrews, J. E., Gallagher, J. S., Clayton, G. C., et al. 2010, ApJ, 715, 541
- Arcavi et al. (2012) Arcavi, I., Gal-Yam, A., Cenko, S. B., et al. 2012, ApJ, 756, L30
- Barbon et al. (1979) Barbon, R., Ciatti, F., & Rosino, L. 1979, A&A, 72, 287
- Baron et al. (2000) Baron, E., Branch, D., Hauschildt, P. H., et al. 2000, ApJ, 545, 444
- Branch et al. (1981) Branch, D., Falk, S. W., Uomoto, A. K., et al. 1981, ApJ, 244, 780
- Cappellaro et al. (1995) Cappellaro, E., Danziger, I. J., & Turatto, M. 1995, MNRAS, 277, 106
- Chugai et al. (2007) Chugai, N. N., Chevalier, R. A., & Utrobin, V. P. 2007, ApJ, 662, 1136
- Folatelli et al. (2013) Folatelli, G., Morrell, N., Phillips, M. M., et al. 2013, ApJ, 773, 53
- Hamuy (2003) Hamuy, M. 2003, ApJ, 582, 905
- Hamuy & Pinto (2002) Hamuy, M., & Pinto, P. A. 2002, ApJ, 566, L63
- Hamuy et al. (2006) Hamuy, M., Folatelli, G., Morrell, N. I., et al. 2006, PASP, 118, 2
- Inserra et al. (2011) Inserra, C., Turatto, M., Pastorello, A., et al. 2011, MNRAS, 417, 261
- Inserra et al. (2012) —. 2012, MNRAS, 422, 1122
- Inserra et al. (2013) Inserra, C., Pastorello, A., Turatto, M., et al. 2013, A&A, 555, A142
- Kotak et al. (2009) Kotak, R., Meikle, W. P. S., Farrah, D., et al. 2009, ApJ, 704, 306
- Leonard et al. (2001) Leonard, D. C., Filippenko, A. V., Ardila, D. R., & Brotherton, M. S. 2001, ApJ, 553, 861
- Leonard et al. (2002a) Leonard, D. C., Filippenko, A. V., Li, W., et al. 2002a, AJ, 124, 2490
- Leonard et al. (2002b) Leonard, D. C., Filippenko, A. V., Gates, E. L., et al. 2002b, PASP, 114, 35
- Litvinova & Nadezhin (1983) Litvinova, I. I., & Nadezhin, D. K. 1983, Ap&SS, 89, 89
- Litvinova & Nadezhin (1985) Litvinova, I. Y., & Nadezhin, D. K. 1985, Soviet Astronomy Letters, 11, 145
- Milisavljevic et al. (2009) Milisavljevic, D., Fesen, R. A., Kirshner, R. P., & Challis, P. 2009, ApJ, 692, 839
- Pastorello et al. (2003) Pastorello, A., Ramina, M., Zampieri, L., et al. 2003, ArXiv Astrophysics e-prints
- Pastorello et al. (2004) Pastorello, A., Zampieri, L., Turatto, M., et al. 2004, MNRAS, 347, 74
- Pastorello et al. (2006) Pastorello, A., Sauer, D., Taubenberger, S., et al. 2006, MNRAS, 370, 1752
- Patat et al. (1994) Patat, F., Barbon, R., Cappellaro, E., & Turatto, M. 1994, A&A, 282, 731
- Pooley et al. (2002) Pooley, D., Lewin, W. H. G., Fox, D. W., et al. 2002, ApJ, 572, 932
- Popov (1993) Popov, D. V. 1993, ApJ, 414, 712
- Sahu et al. (2006) Sahu, D. K., Anupama, G. C., Srividya, S., & Muneer, S. 2006, MNRAS, 372, 1315
- Schlegel (1996) Schlegel, E. M. 1996, AJ, 111, 1660
| SN | Host | Recession velocity | Mmax | velocity | ||||||
|---|---|---|---|---|---|---|---|---|---|---|
| galaxy | (km s-1) | (MJD) | (mag) | (mag ) | (mag ) | (mag ) | (days) | (km s-1 ) | ||
| 1986L | NGC 1559 | 1305 | ||||||||
| 1991al | LEDA 140858 | 4575 | ||||||||
| 1992ba | NGC 2082 | 1185 | ||||||||
| 1999br | NGC 4900 | 960 | ||||||||
| 1999cr | ESO 576-G034 | 6069 | ||||||||
| 1999em | NGC 1637 | 717 | ||||||||
| 2002gd | NGC 7537 | 2676 | ||||||||
| 2002gw | NGC 922 | 3084 | ||||||||
| 2002hj | NPM1G +04.0097 | 7080 | ||||||||
| 2003B | NGC 1097 | 1272 | ||||||||
| 2003E | MCG -4-12-004 | 4470 | ||||||||
| 2003T | UGC 4864 | 8373 | ||||||||
| 2003bl | NGC 5374 | 4377 | ||||||||
| 2003bn | 2MASX J10023529 | 3831 | ||||||||
| 2003cn | IC 849 | 5433 | ||||||||
| 2003cx | NEAT J135706.53 | 11100 | ||||||||
| 2003hd | MCG -04-05-010 | 11850 | ||||||||
| 2003hg | NGC 7771 | 4281 | ||||||||
| 2003hn | NGC 1448 | 1170 | ||||||||
| 2004er | MCG -01-7-24 | 4411 | ||||||||
| 2004fc | NGC 701 | 1831 | ||||||||
| 2005an | SO 506-G11 | 3206 | ||||||||
| 2005dk | C 4882 | 4708 | ||||||||
| 2005dz | GC 12717 | 5696 | ||||||||
| 2005J | NGC 4012 | 4183 | ||||||||
| 2005Z | NGC 3363 | 5766 | ||||||||
| 2006Y | anon | 10074 | ||||||||
| 2006ai | ESO 005- G 009 | 4571 | ||||||||
| 2006be | IC 4582 | 2145 | ||||||||
| 2006ee | NGC 774 | 4620 | ||||||||
| 2006iw | 2MASX J23211915 | 9226 | ||||||||
| 2006qr | MCG -02-22-023 | 4350 | ||||||||
| 2007aa | NGC 4030 | 1465 | ||||||||
| 2007il | IC 1704 | 6454 | ||||||||
| 2007ld | SDSS J204929.40 | 8994 | ||||||||
| 2007oc | NGC 7418 | 1450 | ||||||||
| 2007od | UGC 12846 | 1734 | ||||||||
| 2007P | ESO 566-G36 | 12224 | ||||||||
| 2007U | ESO 552-65 | 7791 | ||||||||
| 2007W | NGC 5105 | 2902 | ||||||||
| 2007X | ESO 385-G32 | 2837 | ||||||||
| 2008aw | NGC 4939 | 3110 | ||||||||
| 2008bh | NGC 2642 | 4345 | ||||||||
| 2008bk | NGC 7793 | 227. | ||||||||
| 2008br | IC 2522 | 3019 | ||||||||
| 2008gr | IC 1579 | 6831 | ||||||||
| 2008if | MCG -01-24-10 | 3440 | ||||||||
| 2008in | NGC 4303 | 1566 | ||||||||
| 2008K | ESO 504-G5 | 7997 | ||||||||
| 2008M | ESO 121-26 | 2267 | ||||||||
| 2009bu | NGC 7408 | 3494 | ||||||||
| 2009N | NGC 4487 | 1034 |
Note. — Measurements made of our sample of SNe as mentioned in section 2. The first three columns present the SNe name and the host galaxy information: Host galaxy name and their recession velocities. From column 4 to column 9 the photometric measurements: (in B-band), Mmax, , , , and (in V-band) are presented. In column 10 we present the , followed by the velocity.
| Hα vel. | Mmax | Opt. thick | ||||||
|---|---|---|---|---|---|---|---|---|
| (52; | (23; ) | (52; | (15; 0.01) | (42; | (40; | |||
| Hα vel. | (52; | (23; 0.11) | (52; | (15; 0.05) | (42; ) | (40; 0.23) | ||
| (23; ) | (23; 0.11) | (23; | (4; 0.06) | (19; 0.02) | (17; | |||
| (52; | (52; | (23; | (15; 0.40) | (42; | (40; | |||
| (15; 0.01) | (15; 0.05) | (4; 0.06) | (15; 0.40) | (14; 0.08) | (15; | |||
| Mmax | (42; | (42; ) | (19; 0.02) | (42; | (14; 0.08) | (31; 0.12) | ||
| OPTd | (40; | (40; 0.23) | (17; | (40; | (15; | (31; 0.12) |