Superconducting and magnetic properties of Sr3Ir4Sn13
Abstract
Magnetization and muon spin relaxation or rotation (SR) measurements have been performed to study the superconducting and magnetic properties of Sr3Ir4Sn13. From magnetization measurements the lower and upper critical fields of Sr3Ir4Sn13 are found to be 81(1) Oe and 14.4(2) kOe, respectively. Zero-field SR data show no sign of any magnetic ordering or weak magnetism in Sr3Ir4Sn13. Transverse-field SR measurements in the vortex state provided the temperature dependence of the magnetic penetration depth . The dependence of with temperature is consistent with the existence of single -wave energy gap in the superconducting state of Sr3Ir4Sn13 with a gap value of 0.82(2) meV at absolute zero temperature. The magnetic penetration depth at zero temperature is 291(3) nm. The ratio indicates that Sr3Ir4Sn13 should be considered as a strong-coupling superconductor.
pacs:
74.25.Ha, 74.70.Dd, 76.75.+iRecently, ternary intermetallic stannide compounds, 3Ir4Sn13, where = Ca, Sr, etc., have attracted renewed interest because of the coexistence of superconducting and charge density wave states and the possible presence of pressure induced quantum structural phase transitions. Klintberg Sr3Ir4Sn13 superconducts below the transition temperature () of 5 K, whereas the sister compound, Ca3Ir4Sn13, becomes superconducting below 7 K. Remeika ; Espinosa Since the Ca atom is smaller in size than the Sr, the substitution of Ca on the Sr site corresponds to applying positive pressure, which then enhances the in the sister compound. This trend seems to continue in Ca3Ir4Sn13 even for physical pressure. Under hydrostatic pressure, the of Ca3Ir4Sn13 increases to 8.9 K in 4 GPa and then falls for higher pressures. Klintberg An increase of with increasing pressure has also been observed for Sr3Ir4Sn13, a behavior at variance with that of the majority of BCS-like superconductors. In Sr3Ir4Sn13, an anomaly at K has been detected in resistivity and susceptibility measurements. A similar anomaly at K has also been found in the compound Ca3Ir4Sn13 and initially attributed to ferromagnetic (FM) spin fluctuations, related to the superconductivity appearing at lower temperature. Yang Later, single crystal x-ray diffraction studies Klintberg showed that the anomaly in Sr3Ir4Sn13 is produced by a second-order superlattice transition from a simple cubic parent phase, the -phase, to a superlattice structure, the -phase, with a lattice parameter twice that of the -phase. It has been further argued that this superlattice transition is associated with a charge density wave (CDW) transition of the conduction electron system. Hall and Seebeck coefficient indicate gap opening and significant Fermi surface reconstruction at in Ca3Ir4Sn13. Wang Whereas a low ratio from thermoelectric data shows a weakly correlated superconductor, Wang other parameters such as the Wilson and Kadowaki-Woods ratios close to those of heavy fermions have been taken as indicative of stronger correlated system. Yang Specific heat measurements on 34Sn13 ( = Sr,La, =Ir, Rh) and Ca3Ir4Sn13 Kase ; Yang suggest nodeless superconductivity and strong coupling, but thermal conductivity data on Ca3Ir4Sn13 did not exclude some gap anisotropy, or multiple isotropic gaps with different magnitudes. Zhou Recent SR study on Ca3Ir4Sn13 Gerber determined a very high gap-to- ratio value = 5, which is unusually large even for a very strongly coupled BCS superconductor and much larger than the 2.53 inferred from macroscopic measurements. Hayamizu To obtain a better insight into the nature of the superconducting and magnetic state of these intermetallic stannide compounds and resolve the discrepancy between the experimental results, we have performed SR and magnetization measurements on Sr3Ir4Sn13, which is isoelectronic to Ca3Ir4Sn13.
From the magnetization measurements we extract the lower and upper critical fields of Sr3Ir4Sn13 of 81(1) Oe and 14.4(2) kOe, respectively. Zero-field (ZF)-SR results find no evidence of any magnetism in Sr3Ir4Sn13. Transverse-field (TF)-SR results show that, at low temperature, the superfluid density ( the magnetic penetration depth) becomes temperature independent, which is consistent with a fully gapped superconducting state. The can be well fitted with a single -wave gap model with a gap value of 0.82(2) meV at absolute zero temperature. This gives a gap to ratio of 2.1(1). The absolute value of the magnetic penetration depth is determined to be nm.
Single crystal samples of Sr3Ir4Sn13 were prepared and characterized as described in Ref. Wang, . Magnetization measurements were performed using an Oxford Instruments Vibrating Sample Magnetometer (VSM). The TF- and ZF-SR experiments were carried out at the Dolly instrument(E1 beam line) and at the new High field and Low Temperature instrument (HAL-9500) at the M3 beam line of the Paul Scherrer Institute (Villigen, Switzerland). The sample was cooled to the base temperature in zero field for the ZF-SR experiments and in 500 Oe for the TF-SR experiments. Typically million muon decay events were collected for each spectrum. The ZF- and TF-SR data were analyzed by using the free software package MUSRFIT. Suter
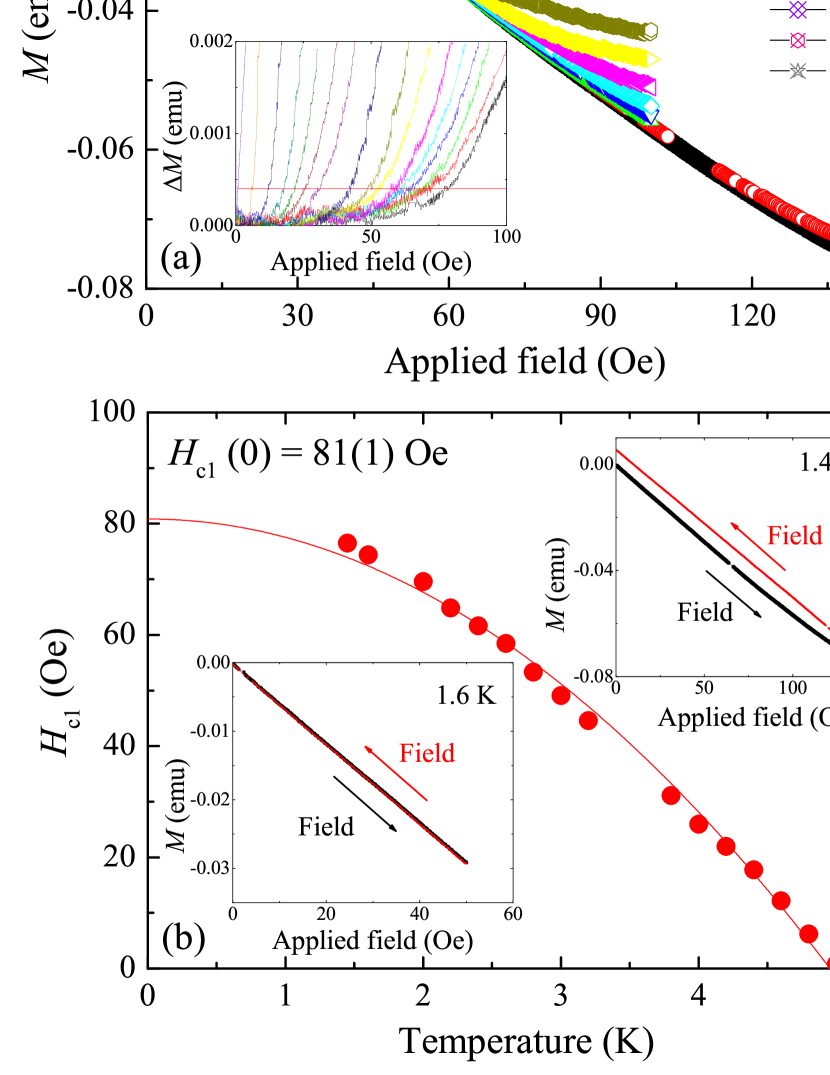
Figure 1(a) shows the virgin magnetization versus applied field curves for Sr3Ir4Sn13 collected at various temperatures. These measurements were performed to obtain the temperature dependence of lower critical field by estimating the first deviation from linearity in each of the vs. curves. To do this, a linear fit to the data was made between 0 to 10 Oe. The departure from linearity, was calculated by subtracting the linear fit from each of the vs. curves (see the inset of Fig. 1(a)). The temperature dependence of was then obtained by using the criteria emu, indicated in the figure as a solid horizontal line. Fig. 1(b) shows of Sr3Ir4Sn13. The solid line is a quadratic fit to the data using
| (1) |
Although, the quadratic fit to the data does not look very good but it certainly gives a fair estimate for . We obtain =81(1) Oe. We checked our estimation by following procedure. In a first attempt, at 1.45 K, we increased the applied field up to 150 Oe (well above Oe, estimated from the fitted curve) and then decreased the field back to zero. The presence of hysteresis in the data (see the top inset of Fig. 1(b)) implies that in this case some flux lines have entered the sample and that the sample has crossed the limit to the mixed state. In a second attempt, we increased the applied field up to 50 Oe at 1.6 K (below Oe). In this case, the curve is completely reversible (see the bottom inset of Fig. 1(b)) confirming that the applied field is well below the value at 1.6 K.
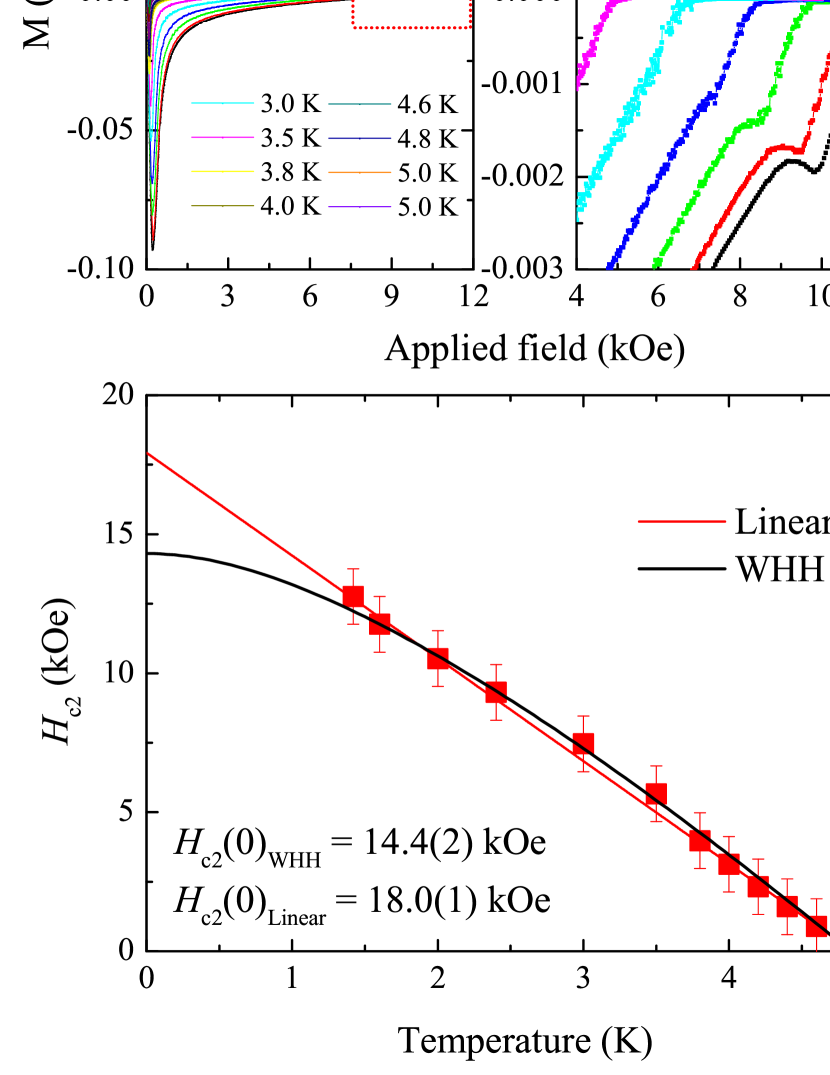
Figure 2(a) shows the first two quadrants of the vs. loops collected at different temperatures. Fig. 2(b) shows a magnification of the red dotted area in Fig. 2(a). A secondary peak or fish tail effect is detected in the magnetization loop at an applied field close to . The peak effect slowly disappears as we move to the higher temperatures. Similar peak effects have also been observed in many other weak pinning superconductors (see Ref. [Johansen, ] and references therein). The presence of such a peak effect in Sr3Ir4Sn13 may be a signature of additional pinning due to disorder. The temperature dependence of the upper critical field of Sr3Ir4Sn13, determined from the point in the loops where , is shown in Fig. 2(c). can be described using the Werthamer-Helfand-Hohenberg (WHH) model. Werthamer ; Helfand The WHH fit yields kOe at K. A simple linear extrapolation of the data to K gives kOe. 14
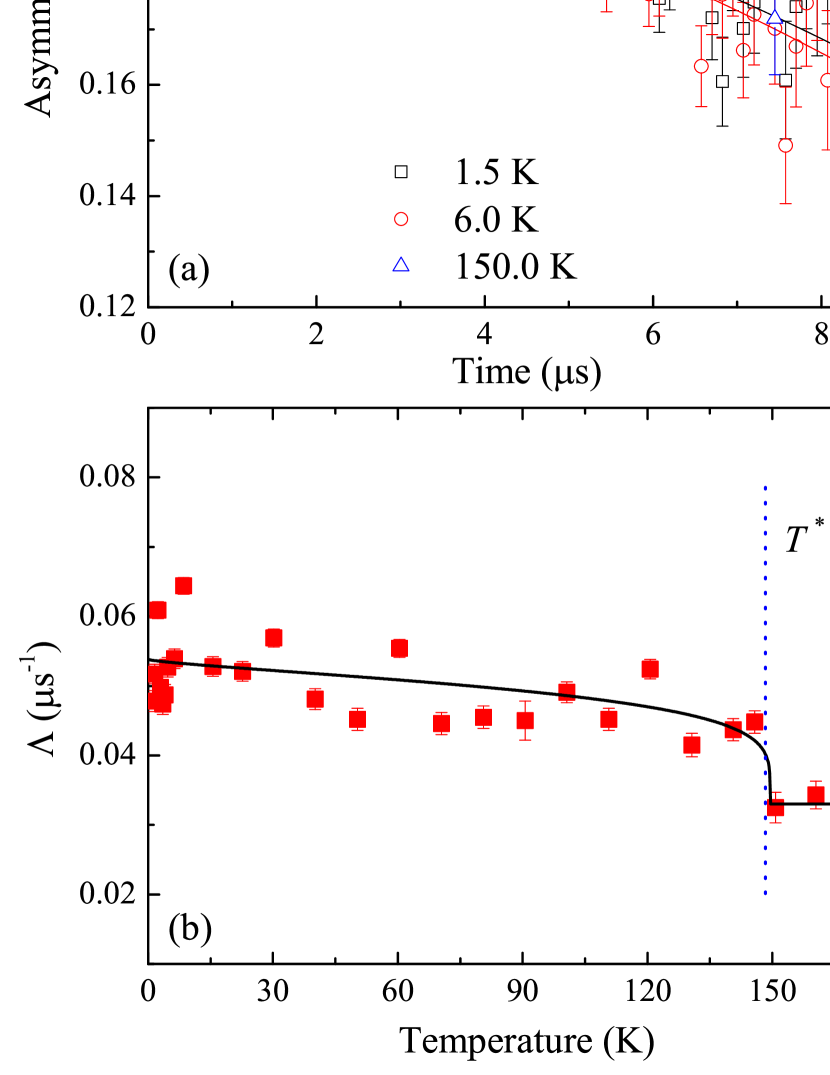
Figure 3(a) compares the ZF-SR signals collected above and below and above at 150 K. The signals at 1.5 and 6.0 K are practically identical, implying that no additional magnetic moments (either static or dynamic) appear below . In contrast, the ZF-SR signal taken at 150 K shows a lower relaxation rate. ZF-SR data can be well described using a Gaussian Kubo-Toyabe relaxation function, Kubo
| (2) |
where is the initial asymmetry and describes the muon spin relaxation rate due to the presence of static nuclear moments in Sr3Ir4Sn13. The temperature dependence of is shown in Fig. 3(b). The data show no apparent magnetic anomalies down to 1.5 K. However, a small but abrupt change in is observed at K, indicating a first-order type phase transition. Such a behavior is consistent with a structural transition or the onset of a CDW transition accompanied by strain or a lattice distortion. The muon probe is sensitive enough to detect such an effect, which arises due to the changes in the position of the muon stopping sites relative to the nuclear moments and hence the probed field distribution.
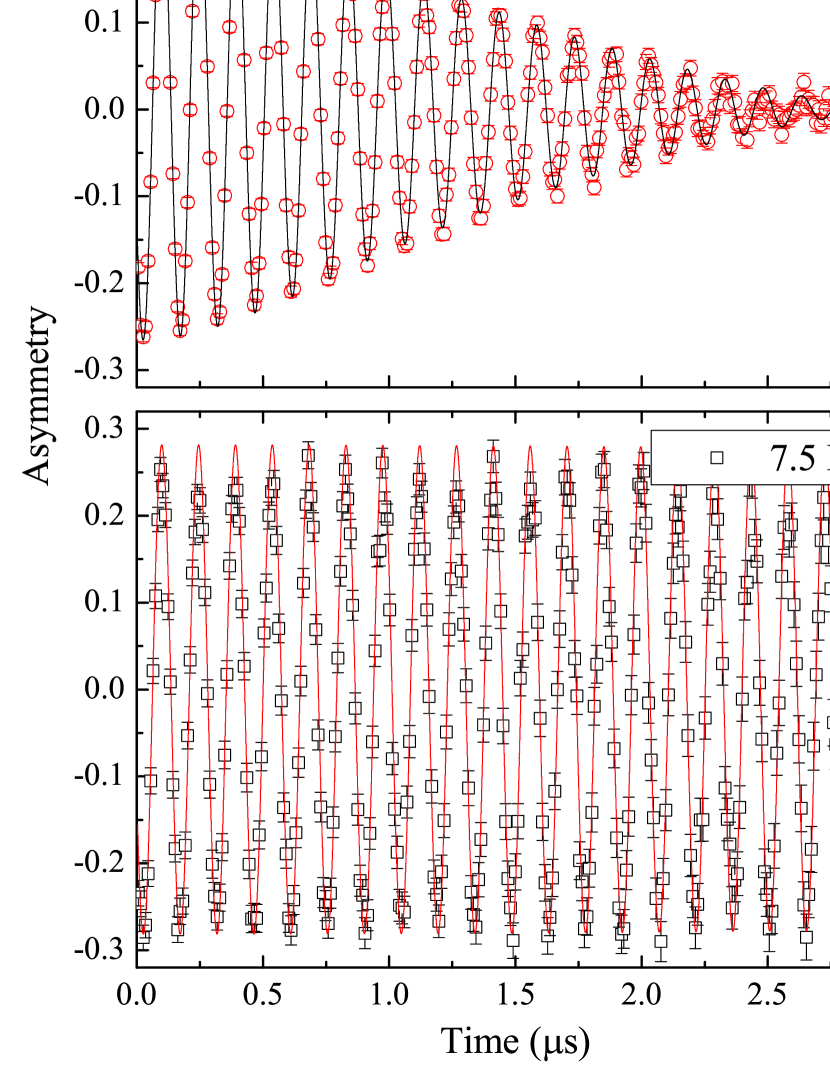
Figure 4 shows the TF-SR precession signals of Sr3Ir4Sn13 taken both above (at 7.5 K) and below (at 18 mK) in an applied field of 500 Oe. The signal in the normal state shows almost no damping, reflecting the homogeneous magnetic field distribution in the bulk of the material, whereas it decays very quickly below due to the inhomogeneous field distribution generated by the superconducting vortex lattice. Brandt
From the TF-SR spectra we can determine the second moment of the magnetic field distribution associated with the vortex state and from this the magnetic penetration depth. Since the field distribution can be represented well by a multi-component Gaussian curve, the muon time spectra are fitted to a sum of Gaussian components: Weber ; Maisuradze
| (3) |
where , , , and are the initial phase, asymmetry, relaxation rate, and mean field (first moment) of the th Gaussian component, respectively. and are the asymmetry and field, respectively due to background contribution. We found that two Gaussian components () are sufficient to fit the muon time spectra data. For , the first and second moments of are given by
| (4) |
and
| (5) |
where MHz/T is the muon gyromagnetic ratio and the muon depolarization rate. Fig. 5(a) shows the temperature dependence of of Sr3Ir4Sn13 for an applied field of 500 Oe. The inset shows the temperature dependence of the internal magnetic field at the muon site with the expected diamagnetic shift below . The solid line is a guide to the eye.
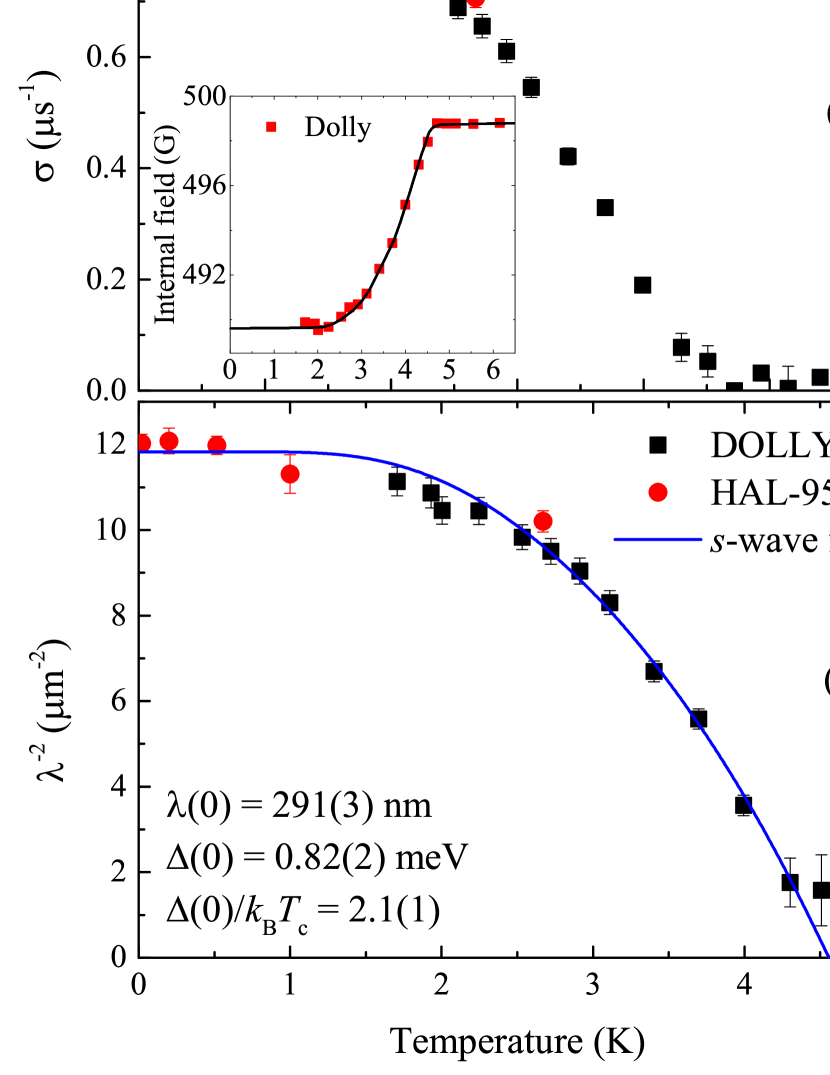
The superconducting contribution to is obtained by subtracting the nuclear moment contribution (measured above ) as . In an isotropic type-II superconductor with a hexagonal Abrikosov vortex lattice described by Ginzburg-Landau theory, the magnetic penetration depth is related to by the equation: Brandt
| (6) |
Here is a reduced magnetic field. In calculating , we have used the temperature dependence of as shown in Fig. 2(c). Fig. 5(b) shows the temperature dependence of . Below 1 K, , which is proportional to the effective superfluid density, appears to flatten as is the case for fully gapped superconductors. This indicates that there are no nodes in the energy gap of Sr3Ir4Sn13. The solid line in Fig. 5(b) represents a fit to the data using the BCS model: Tinkham ; Prozorov
| (7) |
Here is the zero-temperature value of the magnetic penetration depth, and is the Fermi function. Approximating the temperature dependence of the gap by Carrington , the fit yields K, nm, and meV. The gap to ratio is higher than the BCS value of 1.76, suggesting that Sr3Ir4Sn13 is a strong-coupling superconductor. Using as determined from resistivity measurements 14 in Eq. 6 does not change these values appreciably nm, meV and . This is due to the fact that the applied field we used was only 500 Oe and that the correction in Eq. 6 is small for the relevant temperature range.
Using kOe and its relation with the coherence length , , we calculate nm at 0 K. This gives a 19.
By combining the value of and our measured value of , we can calculate the value of using the expression: Brandt
| (8) |
We estimate Oe, which is in good agreement with the value of 81(1) Oe, extracted from the magnetization measurements. Our values of and gap-to- ratio obtained by a microscopic measurements are in good agreement with those obtained from specific heat measurements, Kase whereas is slightly larger (and smaller) than in Ref. Kase, , indicating a cleaner material.
In conclusion, magnetization and SR measurements have been performed on superconducting Sr3Ir4Sn13. From the magnetization measurements we determine the temperature dependences of the lower and upper critical fields. ZF-SR results do not find evidence of any magnetism in Sr3Ir4Sn13, but shows at a small increase in the muon spin relaxation rate consistent with a structural and/or CDW scenario accompanied by a lattice distortion.
TF-SR results show that the superfluid density, becomes temperature independent at low temperature, which is consistent with a fully gapped superconducting state, with well described within the single -wave gap scenario with meV and penetration depth, nm. There is no signature of multiple gaps, as it may be expected from the multiband structure of this material possibly indicating that the gaps have a similar magnitude. The value of the gap to ratio, 2.1(1) is higher than the BCS value of 1.76 and suggests that Sr3Ir4Sn13 is a strong-coupling superconductor. The results presented here will provide a reference point for studies under pressure to detect any changes of the superconducting and magnetic properties in this and related material. The prospect of suppressing the CDW-gap and increasing under hydrostatic pressure motivates further SR as well as other studies under pressure to understand the interplay between and in the ternary intermetallic stannides.
The SR experiments were performed at the Swiss Muon Source (SS), Paul Scherrer Institute (PSI, Switzerland). Work at Brookhaven is supported by the US DOE under Contract No. DE-AC02-98CH10886.
References
- (1) L. E. Klintberg, S. K. Goh, P. L. Alireza, P. J. Saines, D. A. Tompsett, P. W. Logg, J. Yang, B. Chen, K. Yoshimura, and F. M. Grosche, Phys. Rev. Lett. 109, 237008 (2012).
- (2) J. Remeika, G. S. Espinosa, A. S. Cooper, H. Barz, J. M. Rowell, D. B. McWhan, J. M. Vandenberg, D. E. Moncton, Z. Fisk, L. D. Woolf, H. C. Hamaker, M. B. Maple, G. Shirane, and W. Thomlinson, Solid State Commun. 34, 923 (1980).
- (3) G. P. Espinosa, Mater. Res. Bull. 15, 791 (1980).
- (4) J. Yang, B. Chen, C. Michioka, and K. Yoshimura, J. Phys. Soc. Jpn. 19, 113705 (2010).
- (5) K. Wang, and C. Petrovic, Phys. Rev. B 86, 024522 (2012).
- (6) N. Kase, H. Hayamizu, and J. Akimitsu, Phys. Rev. B 83, 184509 (2011).
- (7) S. Y. Zhou, H. Zhang, X. C. Hong, B. Y. Pan, X. Qiu, W. N. Dong, X. L. Li, and S. Y. Li, Phys. Rev. B 86, 064504 (2012).
- (8) S. Gerber, J. L. Gavilano, M. Medarde, V. Pomjakushin, C. Baines, E. Pomjakushina, K. Conder, and M. Kenzelmann, Phys. Rev. B 88, 104505 (2013).
- (9) H. Hayamizu, N. Kase, J. Akimitsu, J. Phys. Soc. Jpn. 80, SA114 (2011).
- (10) A. Suter, and B. M. Wojek, Physics Procedia 30, 69 (2012).
- (11) T. H. Johansen, M. R. Koblischka, H. Bratsberg, and P. O. Hetland, Phys. Rev. B 56, 11273 (1997).
- (12) N. R. Werthamer, E. Helfand, and P. C. Hohenberg, Phys. Rev. 147, 295 (1966).
- (13) E. Helfand and N. R. Werthamer, Phys. Rev. 147, 288 (1966).
- (14) Resistivity versus magnetic field measurements at fixed temperatures on this sample give a higher =37 kOe. However, such a determination may be influenced by impurity phases.
- (15) R. Kubo, Hyperfine Interact. 8, 731 (1981).
- (16) E. H. Brandt, Phys. Rev. B 68, 054506 (2003).
- (17) M. Weber, A. Amato, F. N. Gygax, A. Schenck, H. Maletta, V. N. Duginov, V. G. Grebinnik, A. B. Lazarev, V. G. Olshevsky, V. Yu. Pomjakushin, S. N. Shilov, V. A. Zhukov, B. F. Kirillov, A. V. Pirogov, A. N. Ponomarev, and V. G. Storchak, S. Kapusta, J. Bock, Phys. Rev. B 48, 13022 (1993).
- (18) A. Maisuradze, R. Khasanov, A. Shengelaya, and H. Keller, J. Phys.: Condens. Matter 21, 075701 (2009).
- (19) M. Tinkham, Introduction to Superconductivity (McGraw-Hill, New York, 1975).
- (20) R. Prozorov, and R. W. Giannetta, Supercond. Sci. Technol. 19, R41 (2006).
- (21) A. Carrington, and F. Manzano, Physica C 385, 205 (2003).