Catalog Dynamics: Impact of Content Publishing and Perishing on the Performance of a LRU Cache
Abstract
The Internet heavily relies on Content Distribution Networks and transparent caches to cope with the ever-increasing traffic demand of users. Content, however, is essentially versatile: once published at a given time, its popularity vanishes over time. All requests for a given document are then concentrated between the publishing time and an effective perishing time.
In this paper, we propose a new model for the arrival of content requests, which takes into account the dynamical nature of the content catalog. Based on two large traffic traces collected on the Orange network, we use the semi-experimental method and determine invariants of the content request process. This allows us to define a simple mathematical model for content requests; by extending the so-called “Che approximation”, we then compute the performance of a LRU cache fed with such a request process, expressed by its hit ratio. We numerically validate the good accuracy of our model by comparison to trace-based simulation.
I Introduction
Driven by video streaming, Internet data traffic is rapidly growing, up to 41% at the busy hour in 2012 according to a Cisco forecast. Content delivery networks (CDNs) are now a key component of the Internet architecture and play a central role in coping with such a demand. By means of caching and duplicating content near the end-users, CDNs provide an Internet experience with high performance and high availability. Additionally, as the cost of memory decreases faster than that of bandwidth, Internet Service Providers (ISPs) also locally resort to transparent caching to decrease the load on specific expensive links. This favorable bandwidth-memory trade-off has been confirmed by recent research [12, 9, 3]. As most practical replacement policies have a behaviour similar to that of Least-Recently-Used (LRU), we here follow [9] in using the LRU replacement policy as a representative one.
Video delivery is now the majority of traffic at the busy hour, simultaneously driven by User-Generated Content (UGC) traffic and by Video-on-Demand (VoD) services. YouTube, the best known of UGC sites today, has indeed emerged as an hyper-giant among the Content Providers, serving up to 25% of the traffic at the busy hour in ISP networks. On the other side, Video-on-Demand is growing rapidly, as examplified by the development of NetFlix. Understanding the performance of caches for video delivery becomes therefore crucial for network provisioning and operation. It allows simultaneously to decrease the network load, reduce dimensioning needs and decrease peering costs.
The versatility of content, however, raises a new challenge. As new content is continuously published, and (part of) the old content becomes outdated and non-popular, the popularity of a given document dynamically evolves with time. The dynamics of the content catalog has significant implication for caching performance. First, even with infinite memory, caches cannot manage to serve every request: in fact, the first request for any document will obviously not find the content present in the cache. Secondly, the request traffic is not stationary and caches never experience a steady state; indeed, the set of documents which are currently stored in the caches slowly evolves with time, as new content replaces the older one.
Moreover, as detailed in Section IV, the stationarity periods of the content requests process prove to be short. Consequently, due to the heavy tail of content popularity distributions, estimating the popularity of content during such a short period leads to significant variance. Additionally, the cache may not reach its steady state over short periods, and its performance will therefore depend on the recent past. Characterizing the cache performance at the busy hour is therefore a difficult task due to such inherent variance. This consequently leads us to express the cache performance as the long term average hit ratio, which estimates the average dimensioning gains and fully characterizes the peering gains.
In this paper, we provide a first answer to that dynamicity issue. Through basic manipulations, hereafter called semi-experiments, on two large traces of YouTube and VoD traffic collected from the Orange network, we determine the key invariants of the video request process and propose a model which captures them. This model is amenable to mathematical analysis: Using the so-called Che approximation [6], we express the hit ratio of a LRU cache fed by such a request process as a function of basic document statistics. We finally show via simulation that this approximation accurately matches the empirical hit ratio.
Our key findings are the following: (i) The document arrival process can be well represented by a Poisson point process; (ii) The document requests process can be well represented by a Poisson-Poisson cluster process; (iii) The hit ratio can be expressed in terms of the distribution of document request intensities and document lifespans only.
The remainder of the paper is organized as follows. Section II presents related work. Section III describes the dataset and the statistics drawn from traces. In Section IV, we apply the semi-experiment methodology and determine the structural invariants which are relevant for caching. Based on these observations, we then build a model (Section V) for the request process and estimate the hit ratio for a LRU cache. That estimate is applied to both YouTube and VoD traces and successfully compared to the empirical hit ratio in Section VI.
II Related Work
We describe two areas of related work: content-level traffic characterization and cache performance analysis.
The popularity distribution of documents has been extensively discussed since the 90’s. It has been shown to exhibit a light-tailed behavior (typically from a Weibull distribution) when considering the total number of requests for documents over a long period, and a heavy-tailed behavior (typically a Zipf distribution) when analyzing the viewing rate of documents (see [13, 4, 5, 20] for recent references).
The temporal pattern of document requests has also been studied. In [22], authors propose a Markov model with short term memory for document requests, but the set of available documents remains fixed. The lifespan of documents (defined as the time elapsed between the first and the last requests) has been studied in [8, 7]. Similarly, articles [24, 20] show that only a small portion of the documents are active at any moment, and that popular documents have a significant turnover. Document arrivals into the catalog are identified in [13] and their impact on the maximum achievable hit ratio is discussed. The distribution of requests for the same document over its lifetime is studied in [8, 5], but the results are aggregated over all documents, and therefore do not lead to a model for the request process. To the best of our knowledge, [26] is the single prior work aiming at a full description of the request process. Due to the short duration of the studied traces, however, the inclusion of catalog dynamics is rather simplistic in the proposed model. Finally, [12] proposes a simple model for the dynamics of documents which are requested only once, but the set of documents with several requests remains fixed. In terms of traffic characterization, the closest related work to ours is [14], although the latter focuses on packet-level traffic characterization. In particular, the authors introduce the so-called “semi-experimental methodology” that we use in section IV.
As regards cache performance literature, we here only report the recent literature focusing on the analytical characterization of the performance of caches applying to LRU policy. An asymptotic analysis of the LRU miss rate for either Zipf or Weibull requests distribution, with simple closed-form formulas, is provided in [15]. Che et al. [6] propose another approximation, which is asymptotically exact for a Zipf popularity [16] and also accurate for other types of distributions [11].
We are aware of a few works which do not assume i.i.d. request sequences. In particular, [17] studies the performance of a LRU cache fed by correlated requests, where the instantaneous request distribution depends on a stationary modulating Markov process; the asymptotic performance is identical to that under IRM, showing that such a short-term correlation does not fully capture the content dynamics. [21] also estimates the performance of a LRU cache when the requests form a Markov chain, but no closed-form formula is provided. [10] and [19] provide a theoretical analysis of a network of LRU cache, when requests for a given document form an arbitrary renewal process; correlation among requests can thus be incorporated, but the catalog of document remains static.
Reference [12] is the first published paper to address, though in a limited way, the dynamics of content catalog. It provides an asymptotic performance formula when requests for popular documents follow a Zipf law under IRM, and an exogenous stream of unique requests for an infinite set of “noise” documents is added. Finally, recent developments [1, 2], though not yet refereed, share the core intuitions of our paper; they also model the document request arrivals using a shot-noise (or Poisson cluster) process, where the document popularity profile is parametrized by both its average popularity and its lifespan. We differ, however, from these papers by the semi-experiment methodology that we use in section IV and which justifies the model we propose. We also validate our results on two different traces, corresponding to two different traffic profiles, namely YouTube and Video-on-Demand traffic. Finally, the long duration of our traces (respectively, 3 months and 3.5 years) enables us to better emphasize the impact of temporal locality on the request process.
III Dataset
III-A Data Collection
We have gathered two datasets from two services, which have different traffic profiles.
The first dataset, hereafter named YT, captures YouTube traffic of Orange customers located in Tunisia. We have access to the logs of a transparent caching system set up in order to offload the country’s international connection. This system is a commercial product from a large company specialized in the design and management of CDNs. In the observation period of January–March 2013, we collected around requests from about IP addresses to chunks. For each chunk request in this trace, the logs contain the user (anonymous) IP address, a video identifier, the timestamp of the end of session, the number of transmitted bytes, the duration of the HTTP connection and the beginning and ending position of the specific chunk requested, the latter information being available for of the data.
The second dataset, hereafter called VoD, comes from the Orange Video-on-Demand service in France. This service proposes to Orange customers both free catch-up TV programs and pay-per-view films and series episodes. Probes deployed at the access of the service platforms recorded video requests from June 2008 to November 2011. The data amounts to more than requests from users to videos. The records in this trace consist of the request timestamp, an internal client (anonymous) identifier and a video identifier.
III-B Processing
For simplicity and mathematical tractability, we focus our analysis at the document level rather than chunk level.
Since the YT trace consist of chunk requests, we consolidate them to identify the user video sessions. To this aim, we first identify the requests from a single user to a single object. Then, when the chunking information is available, we simply concatenate the requests corresponding to a chunk chain. For the requests without chunk identification, we aggregate all the requests made by the same user for the video, and with inter-arrival time smaller than 8 minutes. This threshold corresponds to the percentile of the length session distribution of requests with chunk data.111The reason to select a percentile instead of the maximum is that there are 185 chunk chains with extreme duration (in the order of days or even months), rendering the maximum a meaningless aggregation criterion. The result of this procedure is our working YT dataset consisting of more than requests to around unique documents.
In the case of the VoD trace there was no need of the above consolidation procedure. Nonetheless, the trace contained requests to movie trailers or to full content but with short duration. We consider these content “surfing” requests not relevant in terms of caching performance and thus we discarded them from the VoD dataset. The working VoD dataset contains around requests to more than different objects.
III-C Distribution of the Number of Requests
The logarithmic rank-frequency chart in Figure 1 shows two different popularity behavior for the traces. As expected, in the “short” YT trace, the ten thousand most popular documents follow a Zipf distribution with exponent 0.61, while the tail has an exponent of 1.03. As for the VoD trace, the popularity does not follow a power law, but is best fitted by a Weibull (also called Stretched-Exponential) distribution.
III-D Distribution of Lifespan and Request Rate
We here provide a finer characterization that considers not only the number of requests to a given document, but also the period of time during which the document is active. For a given document, let denote its lifespan, that is, the period where the users can address requests to it; let then be the corresponding average request rate to that document. We estimate these two quantities that form the basis of our analysis. 106366702000 Specifically, consider a given document with requests, and let and be the Initial and Final request times to that document in the observation window. We then estimate the catalog lifespan by the unbiased estimator
| (1) |
(in fact, assuming that the request times , …, are uniformly distributed on the interval with length , we easily calculate ).
Regarding intensity , our sample is biased by the fact that we collect only documents with at least one request. To take this bias into account, we assume that is a Poisson random variable with mean , given . We thus estimate the request rate by
| (2) |
where verifies equation (the latter is easily shown to have a unique positive solution ; note in practice that we can take for greater than 10). Both estimators and are valid only for documents for which we have at least two requests. Consequently, in the remaining of this section, we will make the analysis over the set of documents that have at least two requests.
Figure 2 shows a kernel density approximation of for each dataset. Note that the formula of allows a positive density for values larger thant the observation window, especially for documents with a small number of requests. Also, in the YT data, we observe a probability mass accumulation effect near the mark of three months, which is precisely the size of the observation window. This is a truncation effect and it is a sign that the lifespan of a video may be far longer than our current observation window in this dataset. As regards the VoD data, most documents have a lifespan shorter than one month. This corresponds to the numerous catch-up TV programs. The remaining documents have a different distribution, with lifespans varying on the range of a few weeks to the observation period (3.5 years). Due to the large observation period, the truncation effect is not visible.
In the case of , even though its estimator is biased, we were able to analyze it more throughly than estimator . In fact, with help of a maximum likelihood method, we have found that a (shifted) Gamma model fit the distribution of in the YT case and a Weibull model in the VoD case.
In the YT case we observe in Figure 3 that the fit on the subsample is considerably better than on . This is due an accumulation of mass at the right extreme of the distribution due to the fact that the estimation of when has a lot of variability and the latter subsample has more than half of the data. Indeed, we see this effect disappear on the subsample .
These fittings suggests that, in our traces, the random variable has a heavy tailed distribution 222 We here use the broader definition of “heavy tail” random variable in the sense that for every positive . This includes, in particular, power law tailed distributions. , which is consistent with the fact that it is a popularity measure as well.
Finally the joint distribution of the pair is shown in Figure 4, with a focus on small values of for the VoD data. In both cases, we conclude from the empirical densities that and are not independent random variables, and the joint distribution is not easy to fit. We therefore will use the empirical joint distribution in the following. Finally, the presence of managed catch-up TV documents in the VoD data is visible; the marginal shows density peaks at values of 1, 2 and 4 weeks, corresponding to the duration for which broadcasts remain available.
IV Semi-Experiments
In this section, we address the identification of the structural properties of the request process that are relevant to LRU caching, namely:
-
(i)
Overall correlation between requests.
-
(ii)
Correlation in the catalog publications.
-
(iii)
Correlation between the requests of a document.
Additionally, in the case of the first property, we look for the timescale where it starts to influence the performance of LRU.
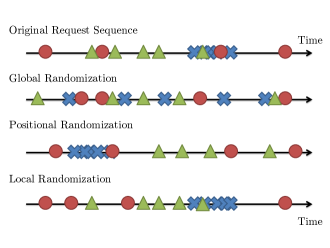
To this aim, we use the semi-experimental methodology [14]. Each semi-experiment is based on two procedures: The first one is to randomly rearrange the original request sequence in a way that destroys a specific correlation structure; the second one is to use this new trace as an input for a simulation of a LRU cache and compute the corresponding hit ratio curve. We then look at the discrepancies from the hit ratio curve of the original trace; if they differ significantly we infer that the broken structure is relevant to LRU caching. In the following, we explain in detail each semi-experiment and its findings.
Overall Correlation Between Requests
In this semi-experiment, we completely break the correlation structure of the request sequence by placing each request at an i.i.d. uniform time in the interval , where is the size of the observation window. Any request sequence shuffled in this manner leads to a IRM sequence, since the process destroys any dependence structure. We call this procedure global randomization and show an example in Figure 5.
In Figure 6(a), we compare the resulting hit ratio to that obtained with the original trace and observe that the hit ratio of the latter is lower for any cache size in both datasets, but notoriously in the VoD case. To be more precise, we compute the mean absolute relative error or MARE333 The MARE between a model sequence and empirical data is defined as . between hit ratio curves of the original and randomized sequence. In the YT case, the MARE has a value of 5.0%; this value might seem low, but it comes mostly from the left of the curve. Since the left part of the curve is where practical cache sizes lie, this discrepancy, however low, is still important. As for the VoD trace, the MARE amounts to 17.3% which confirms the huge difference observed above in Figure 6(a). We thus conclude that the correlation between requests is a meaningful factor for the performance of LRU caching and that the IRM assumption leads to a underestimation of the hit ratio, which can be very significant.
Correlation in Catalog Publications
We now examine how sensitive is our data with respect to the publication of new documents to the catalog. To this aim, we perform a positional randomization, which breaks the correlation structure between the first requests of documents, which we use as an estimate of the publication time. The procedure consists, for a given document, in leaving the inter-arrival times of its request sequence unchanged and jointly shift all of them by a random quantity, as shown in Figure 5. More precisely, let the request times for a document; first, we draw a uniform random number from the interval , then we define the new request sequence by for .
In both traces, the resulting hit ratio shows no difference from the original, as observed in Figure 6(b). The MAREs in this semi-experiment are merely 0.3% in the YT case and 0.1% in the VoD case. We therefore conclude that document arrivals have no correlation structure with significant impact on caching.
Correlation between Requests of a Document
In this semi-experiment, we aim to break the request dependence structure for each document. To achieve this, we perform a local randomization: For a given document, we keep its first and the last request times fixed and only shuffle the ones in between at i.i.d. times following a -distribution. Note that this procedure preserves the lifespan and intensity statistics discussed in Section III-D, but breaks any other correlation structure inherent to the request process of the document.
Figure 6(c) shows that, although the resulting hit ratio is slightly below (resp. over) the original for small (resp. large) cache sizes, the MARE is just 1.6% in the YT trace and 0.7% in the VoD trace. We thus conclude that the correlation among requests of a given document has little impact on the LRU performance and we can safely neglect it for modeling purpose.
Relation between Correlations and Timescales
We now determine at which timescale the correlation between requests has an impact in the LRU performance. With this in mind, we design a slightly different semi-experiment where we first extract sub-traces of different timescales, choosing high load periods. Then we apply the global randomization semi-experiment to each of these shorter traces. For each dataset, we distinguish three timescales and the results for each one are shown in Figure 7; other timescales lead to results that are just intermediate to the three presented here.
Near the first timescale (one week for YT and one month for VoD) and beyond, all timescales have a request correlation structure that approaches that observed in the full trace, and thus its hit ratio differs significantly from that of the global randomization. Indeed, already at this timescale, the MAREs are of 5.3% and 11.6% in the YT and VoD datasets, respectively; around the second timescale (four hours for YT and one day for VoD), we observe a decrease in the discrepancies as the MAREs are 5% and 2.3% in the YT and VoD case, respectively. Though we see that the correlation structure does not influence strongly the hit ratio, we remark again that the underestimation happens in the left side of the curves which corresponds to practical cache sizes. Finally for traces around the last timescale (half hour for YT and three hours for VoD), the MARE are 1.4% and 2.3% for YT and VoD respectively and we thus conclude that there are no significant structures between requests at this timescale.
Insights Gained
The latter results of the semi-experiments lead us to conclude that:
-
I1:
The correlation structure of the whole request process is not negligible, in terms of the hit ratio, at large timescales. We also infer that most of the correlation comes from the fact that all requests for the same document are grouped within its lifespan.
-
I2:
The document publications exhibit a correlation structure that does not have a significant impact on the hit ratio. In particular, we deduce that document arrivals to the catalog can be modeled by a Poisson process without losing accuracy on the estimation of the hit ratio curve.
-
I3:
For a given document, the request process within its lifespan exhibits some structure, but with little impact of the hit ratio. Thus, for a given document, we can approximate the requests sequence by a Poisson process defined on the lifespan of the document while still preserving the hit ratio.
V Mathematical Analysis
In this section, we use the previous insights to build a mathematical model for the whole request process and detail the estimation of the corresponding hit rate in a LRU cache (throughout, the caching granularity is that corresponding to a document). The reader can find the proofs of all propositions in the appendix.
V-A Catalog Arrival and Request Processes
We build our model for the document request process by following a top-down approach:
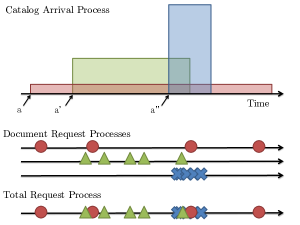
- on the top level, we consider the ground process , hereafter called catalog arrival process; this point process dictates the consecutive arrivals of documents to the catalog. In our model, is assumed to be a homogeneous Poisson process with constant intensity , according to Insight I2.
- let then be the index of a document generated by process , whose arrival time to the catalog is denoted by . Document then generates a document request process determined by two random variables and . Specifically, given and , we assume the document request process to be Poisson with intensity function on interval (cf. Insight I3); the duration is the lifespan of document , intensity function being zero outside interval . In the following, we assume that
| (3) |
is almost surely finite;
- finally, the superposition of all processes for all generates the total request process that contains the requests to all documents. In the following, we will also denote by the request process resulting from the removal from total process of points pertaining to request process associated with given document .
We can regard the point process either as a doubly-stochastic Poisson process (such processes are also called Cox in the literature) which is a Poisson Process with random intensity, in our case the shot-noise process generated by the popularity functions . Additionally, we can regard as a cluster point process. Figure 8 gives a schematic view of all components of our request model.
V-B General Hit Ratio Estimation
Given the dynamical request model presented in Section V-A, we now discuss the adaptation of the so-called “Che approximation” [6, 11] to calculate the hit ratio for requests addressed to a cache ruled by the LRU policy.
Assume that a given document arrives to the catalog at time . As the request process to document is a Poisson process with intensity function , the sequence of request times to has elements, where follows a Poisson distribution with parameter introduced in (3). The expected number of hits to the given document then reads
| (4) | ||||
where denotes the expectation, given and . To proceed further with the calculation of , we need to incorporate the caching management policy. Specifically, we consider a cache of size ruled under the LRU policy; the request at time will then be a hit if and only if different documents have been requested since the request arrival at time . To formalize this condition, let denote the number of different documents requested in time interval , that is, for . From the stationarity of the ground process , we first deduce the following.
Proposition 1
For any , processes and have identical distributions. Furthermore, is a Poisson process with associated mean function given by
for all (in the latter integral, variable stands for for brevity).
The latter formula for can be easily interpreted by noting that the mean number of different documents arriving in interval being (for any ), each of those documents is requested in interval with probability .
Now, an immediate consequence of Proposition 1 is that the first passage time of process to level has the same distribution than , where . We can now proceed with the calculation of expressed in (4). From the previous discussion, a hit event at time can be equivalently written as
in terms of . Recall that, given the arrival of document at time , the remaining process has the same distribution than . It follows that the distribution of for process is identical to that associated with remaining process . As in distribution, we can eventually write (4) as
| (5) |
The distribution of intervening in (5) is usually unknown or hard to calculate. To overcome this difficulty, we now invoke the so-called Che approximation: we assume that the distribution of is very concentrated so that it can be approximated by a constant , hereafter called the characteristic time. The calculation of that characteristic time then proceeds as follows; using Proposition 1.B together with the approximation , we can write . We therefore define the characteristic time by the inverse relation
| (6) |
replacing by in (5), we then obtain the approximation
| (7) |
for the expected number of hits.
V-C Application to the Box Model
The general expressions for the average and the expected number of hits derived in Section V-B are now applied to the specific Box Model in order to obtain explicit formulas. In that Box Model, the intensity function of request for any document is piecewise constant, that is, where we independently choose the pair of (possibly dependent) random variables and from the catalog arrival process ; (3) now reduces to .
Please note that many choices of pattern for are possible. In particular, it is possible to choose intensity functions with unbounded support, such as the exponential function (in this case, the lifespan of a document could be defined for example as the time interval for 90% of the document requests to occur). Our choice of a piecewise intensity function is consistent with Insight I3 gained from Section IV.
Proposition 2
For the Box Model, the mean of the process is given by
for all , where the pair of positive variables is distributed as any pair .
To interpret the latter expression of , assume and are constants; then grows non-linearly in if and linearly otherwise; in the latter case, we can write the mean function as which is just the mean number of new objects up to time , plus the mean number of arrivals to the catalog in interval penalized by the probability that the document has at least one request.
To finally specify the Che approximation for the Box Model, we now state the following.
Proposition 3
Under the Che approximation and for the Box Model, the conditional expectation of the expected number of hits to document is given by
VI Model Validation
The aim of this final section is to assess the validity of our Box model for the calculation of the hit ratio (as derived in Proposition 3), when compared to the values obtained by a direct simulation. To this end, we first detail the computation of the necessary statistics to use our model, namely (i) the catalog arrival intensity , (ii) the mean for all , and (iii) the hit ratio .
(i) Let first be the number of documents in our sample and denote by the size of the observation window; we can then estimate the catalog arrival rate by ;
(ii) We have noted in Section III-D that estimators and , respectively expressed in (1) and (2), are not available for documents with only one request. This sub-sample has, however, a considerable size (58% of all documents) and cannot be neglected in a direct application of Proposition 2.
To incorporate this data, we use the approximation discussed in [12] where the set of documents requested only once is represented by a “noise” process. Let (resp. ) denote the mean function of that noise process (resp. the mean function associated with the “non-noise” part of the process), with . We can separate the noise process from the rest of the request process and, using a procedure similar to that of Proposition 2, we easily obtain an explicit formula for (omitted here for brevity); the latter together with the formula for in Proposition 2 then gives
Recall that the documents for which we have an estimate of the pair are precisely those accounted into . We thus estimate , with the expectation taken w.r.t. the empirical distribution of in the trace.
Finally, let and be the number of documents with one, and more than one requests, respectively. We then estimate by the mean function of a homogeneous Poisson process, that is, . The estimator of the characteristic time associated with the Che approximation is therefore given by , with .
(iii) Concerning the hit ratio HR, we must similarly take the documents with just one request into account. Note that since the documents pertaining to the noise process do not produce hits, we can write
Let be the conditional expectation of the number of hits given by Proposition 3; by similar arguments to those used in (ii), the numerator of the hit ratio is thus estimated by
with the expectation taken w.r.t. the empirical distribution of in the trace. As to the term , it can be computed as the average number of requests in the corresponding sub-sample. Finally, the ratio in the denominator is estimated by .
Using the above estimators, we can eventually compare the hit ratio derived from the Box Model to that obtained by simulation for each trace, as depicted in Figure 9. For comparison purpose, we provide also the estimation of the hit ratio obtained by the Che approximation when the request process is assumed to be IRM. For the YouTube traffic, the Box Model improves the accuracy by one order of magnitude compared to the estimation with an IRM process, with respective MARE of 0.5% and 4.1%. For the VoD traffic, the improvement is even more spectacular, due to the large duration of the trace. The IRM is far from estimating properly the hit ratio with a MARE of 17.2% (this value is significantly decreased by including the tail of the curve, not plotted here, and where the IRM converges towards the correct value). On the other hand, the Box Model estimates accurately the hit ratio, with a MARE of 0.6%. This validates our model.
VII Conclusion
The current literature on the performance of caching systems ignores the fact that content is produced and becomes out-dated everyday. The consequence for caches is non-negligible, as requests for a given document are concentrated within its lifetime and the request process is thus non stationary. This paper addresses the issue of catalog dynamics. Based on two traffic traces, we provide evidence for the impact of the catalog dynamics and identify the core structures of the request process. We then propose a general model for the aggregated request process and provide an estimate of the hit ratio of a LRU cache fed by such a request process.
Our results show that the document request process can be easily described, as far as caching is concerned, in terms of basic document statistics: the document lifespan and its average request intensity (within its lifespan). As expected, the hit ratio is mainly driven by the distribution of the number of requests for each document. The distribution of request intensities, however, has a secondary impact on the hit ratio: higher intensities (and thus shorter lifespan) lead to higher performance, which confirms basic intuition.
Our proposed model currently uses documents as a basic unit. In practice, however, bandwidth and cache size are counted in bytes. Additionally, in the case of video streaming, the downloads of videos are frequently interrupted because users switch to another video. As a further study, we intend to account for both the size distribution of videos and the impact of these interruptions on caching. Our model for the catalog dynamics can also be improved: the catalog size in our model is stationary, while it actually increases with time.
References
- [1] M. Ahmed, S. Traverso, P. Giaccone, E. Leonardi, and S. Niccolini. Analyzing the performance of lru caches under non-stationary traffic patterns. CoRR, 2013.
- [2] M. Ahmed, S. Traverso, P. Giaccone, E. Leonardi, and S. Niccolini. Why temporal locality matters: Evaluating cache performance for content-on-demand distribution. CoRR, 2013.
- [3] B. Azimdoost, C. Westphal, and H. R. Sadjadpour. On the throughput capacity of information-centric networks. In Teletraffic Congress (ITC), 2013 25th International, 2013.
- [4] Y. Carlinet, T. D. Huynh, B. Kauffmann, F. Mathieu, L. Noirie, and S. Tixeuil. Four months in dailymotion: Dissecting user video requests. International Workshop on TRaffic Analysis and Classification (TRAC), Aug. 2012.
- [5] M. Cha, H. Kwak, P. Rodriguez, Y.-Y. Ahn, and S. Moon. Analyzing the video popularity characteristics of large-scale user generated content systems. IEEE/ACM Trans. Netw., 17(5), Oct. 2009.
- [6] H. Che, Y. Tung, and Z. Wang. Hierarchical web caching systems: modeling, design and experimental results. Selected Areas in Communications, IEEE Journal on, 20(7), 2002.
- [7] X. Cheng, C. Dale, and J. Liu. Understanding the characteristics of internet short video sharing: YouTube as a case study. CoRR, 2007.
- [8] L. Cherkasova and M. Gupta. Analysis of enterprise media server workloads: access patterns, locality, content evolution, and rates of change. IEEE/ACM Transactions on Networking, 12(5), oct. 2004.
- [9] S. K. Fayazbakhsh, Y. Lin, A. Tootoonchian, A. Ghodsi, T. Koponen, B. Maggs, K. Ng, V. Sekar, and S. Shenker. Less pain, most of the gain: Incrementally deployable ICN. In Proceedings of the ACM SIGCOMM 2013 Conference on SIGCOMM, 2013.
- [10] N. Fofack, P. Nain, G. Neglia, and D. Towsley. Analysis of ttl-based cache networks. In Performance Evaluation Methodologies and Tools (VALUETOOLS), 2012 6th International Conference on, 2012.
- [11] C. Fricker, P. Robert, and J. Roberts. A versatile and accurate approximation for cache performance. In 24th International Teletraffic Congress. IEEE Communications Society, 2012.
- [12] F. Guillemin, B. Kauffmann, S. Moteau, and A. Simonian. Experimental analysis of caching efficiency for YouTube traffic in an isp network. In Teletraffic Congress (ITC), 2013 25th International, 2013.
- [13] L. Guo, E. Tan, S. Chen, Z. Xiao, and X. Zhang. The stretched exponential distribution of internet media access patterns. In Proceedings of the Twenty-seventh ACM Symposium on Principles of Distributed Computing, 2008.
- [14] N. Hohn, D. Veitch, and P. Abry. Cluster processes, a natural language for network traffic. IEEE Transactions on Signal Processing, special issue ”Signal Processing in Networking”, 51(8), Aug. 2003.
- [15] P. R. Jelenković. Asymptotic approximation of the move-to-front search cost distribution and least-recently-used caching fault probabilities. The Annals of Applied Probability, 9(2), 1999.
- [16] P. R. Jelenković and X. Kang. Characterizing the miss sequence of the LRU cache. ACM SIGMETRICS Performance Evaluation Review, 36, August 2008.
- [17] P. R. Jelenković and A. Radovanović. Least-recently-used caching with dependent requests. Theoretical Computer Science, 326(1–3), 2004.
- [18] O. Kallenberg. Foundations of Modern Probability. Springer, second edition, 2002.
- [19] V. Martina, M. Garetto, and E. Leonardi. A unified approach to the performance analysis of caching systems. arXiv preprint arXiv:1307.6702, 2013.
- [20] S. Mitra, M. Agrawal, A. Yadav, N. Carlsson, D. Eager, and A. Mahanti. Characterizing web-based video sharing workloads. ACM Transactions on the Web, 5, May 2011.
- [21] A. Panagakis, A. Vaios, and I. Stavrakakis. Approximate analysis of LRU in the case of short term correlations. Computer Networks, 52(6), 2008.
- [22] K. Psounis, A. Zhu, B. Prabhakar, and R. Motwani. Modeling correlations in web traces and implications for designing replacement policies. Computer Networks, 45(4), 2004.
- [23] R Development Core Team. R: A Language and Environment for Statistical Computing. R Foundation for Statistical Computing, 2011.
- [24] L. Rizzo and L. Vicisano. Replacement policies for a proxy cache. IEEE/ACM Trans. Netw., 8(2), Apr. 2000.
- [25] W. N. Venables and B. D. Ripley. Modern Applied Statistics with S. Springer, fourth edition, 2002.
- [26] M. Zink, K. Suh, Y. Gu, and J. Kurose. Characteristics of YouTube network traffic at a campus network — measurements, models, and implications. Computer Networks, 53(4), 2009.
Appendix A Software Tools
Appendix B Technical Proofs
In order to justify Proposition 1, we assert some technical properties for the processes involved in the modeling. The following notation will be used throughout:
- given a measurable space , denotes the Dirac mass at point ;
- for any function on equipped with measure , we set ;
- for any point process on space with associated intensity measure , the Laplace functional of is defined by for any measurable function .
We finally recall ([18], Lemma 12.2) the following properties of Laplace functionals for Poisson and general Marked Point processes.
Property 4
-
(i)
Point process is Poisson if and only if for any measurable positive measurable function ;
-
(ii)
let be an arbitrary point process; for any , let be a random variable with values in a space and whose probability distribution is denoted by ; we assume that all , , are mutually independent. Consider the marked point process . For any measurable positive function , we set
then the equality holds. In particular, if is also Poisson, then
(9) for any measurable positive function .
We first show a decomposition property for marked Poisson point processes.
Lemma 5 (Splitting by marks)
Let denote a Poisson point process on the real line with intensity measure . Given a measurable space , define the marked Poisson process on by
with independent (but not necessarily identically distributed) random variables with values in . If is a partition of , then each process
is a marked Poisson point process with intensity measure defined by
for any measurable set . Processes , , are also mutually independent.
Proof:
Proof:
We now prove Proposition 1 in two steps:
-
1.
is a Poisson Process with mean function ;
-
2.
Processes and have identical distributions.
First step
Given the ground process , define the marked ground process by
where the mark is the request arrival process for document introduced in Section V-A. Let then denote the point process defined by the sequence of first request times in (if they exist) for any document. Starting from process , we will construct in two steps:
- first, consider the space of point processes which have at least one point in interval , that is,
its complement and the union ; referring then to Lemma 5, we can define marked point processes and . By Lemma 5, in particular, the intensity measure of is given by
| (10) |
for any , where denotes for short;
- secondly, can be written in terms of of as
where denotes the first point of in (note that we have split process in such a way that is well-defined in the subset ).
To show that process is a Poisson point process, we now calculate the exponent of its Laplace functional: let be a positive function, we have
| (11) |
where . We are therefore left to calculate the Laplace functional of process in order to obtain that of process . As the marked Poisson process has the intensity measure given in (10), formula (9) enables us to further write expression(11) as
Recall that, given , the process is Poisson with intensity function , and thus is a Poisson random variable with parameter
(note our assumptions ensure that is almost surely finite). By conditioning on , the exponent above can be further expressed in terms of as
| (12) |
Now, given the event , the distribution of the request arrival times follows that of a -sample with density
we also denote by the associated c.d.f. of . Given all the conditionings by and , is distributed as the minimum of a -sample drawn from distribution ; we consequently have
Noting that
expression (B) reduces to
Noting the identity of sets
in the definition of density and distribution function , the latter equation for reads
We therefore conclude that is a Poisson point process with intensity measure
and the mean function of for is then given by
To further simplify the latter expression, we note that
since if , then is zero in ; the above expression for therefore reduces to
where the last equality holds because is zero out of interval . Applying the latter expression to readily gives the claimed formula for , , which concludes the first step.
Second step
For , let and be the mean functions of and , respectively. As a Poisson process is completely determined by its mean function, it is sufficient to prove that
for all . Setting , we thus have
where stands for (the document arrival time) for short; using the variable change , the intensity function with support changes to the translated function with support . We then obtain
which concludes the proof. ∎
We can now deduce the explicit expression for for Box Model.
Proof:
For brevity we denote and . This presents no ambiguity since the distribution of the pair does not depend on the document . By Proposition 1, we derive that
On the event , the inner integral becomes
On the event , we similarly obtain
from which the final formula for follows. ∎
Proof:
As the request process for any document is Poisson then, given and the event , the tuple follow the distribution of the order statistics of uniform random variables over . Consequently, the variable follows a distribution.
In the event , every request is a hit except for the first request, regardless of the values of ; on this event, we thus derive from (7) that
where we set again and for brevity. On the event , we similarly obtain
which concludes the proof. ∎