and CNRS Institut de Recherche en Astrophysique et Planétologie, 9 Av. colonel Roche, BP 44346, F-31028 Toulouse cedex 4, France
11email: ppeille@irap.omp.eu
Probing X-ray burst – accretion disk interaction in low mass X-ray binaries through kilohertz quasiperiodic oscillations
The intense radiation flux of Type I X-ray bursts is expected to interact with the accretion flow around neutron stars. High frequency quasiperiodic oscillations (kHz QPOs), observed at frequencies matching orbital frequencies at tens of gravitational radii, offer a unique probe of the innermost disk regions. In this paper, we follow the lower kHz QPOs, in response to Type I X-ray bursts, in two prototypical QPO sources, namely 4U 1636-536 and 4U 1608-522, as observed by the Proportional Counter Array of the Rossi X-ray Timing Explorer. We have selected a sample of 15 bursts for which the kHz QPO frequency can be tracked on timescales commensurable with the burst durations (tens of seconds). We find evidence that the QPOs are affected for over 200 s during one exceptionally long burst and 100 s during two others (although at a less significant level), while the burst emission has already decayed to a level that would enable the pre-burst QPO to be detected. On the other hand, for most of our burst-kHz QPO sample, we show that the QPO is detected as soon as the statistics allow and in the best cases, we are able to set an upper limit of 20 s on the recovery time of the QPO. This diversity of behavior cannot be related to differences in burst peak luminosity. We discuss these results in the framework of recent findings that accretion onto the neutron star may be enhanced during Type I X-ray bursts. The subsequent disk depletion could explain the disappearance of the QPO for 100 s, as possibly observed in two events. However, alternative scenarios would have to be invoked for explaining the short recovery timescales inferred from most bursts. Heating of the innermost disk regions would be a possibility, although we cannot exclude that the burst does not affect the QPO emission at all. Clearly the combination of fast timing and spectral information of Type I X-ray bursts holds great potential in the study of the dynamics of the inner accretion flow around neutron stars. However, as we show, breakthrough observations will require a timing instrument providing at least ten times the effective area of the RXTE/PCA.
Key Words.:
accretion, accretion disks – X-rays: bursts – stars: individual: 4U 1636-536 – stars: individual: 4U 1608-522 –X-rays: binaries
1 Introduction
Illumination of accreting disks during Type I X-ray bursts gives us the opportunity to study the innermost regions of the accretion flow around neutron stars (Galloway et al. 2008; Strohmayer & Bildsten 2003; Cumming 2004). Evidence of an interaction between the burst emission and the inner disk has been reported in a few individual bursts (Yu et al. 1999; Kuulkers et al. 2003; Chen et al. 2011; in’t Zand et al. 2011; Serino et al. 2012; Degenaar et al. 2013). Disk depletion through radiation drag, heating of the inner disk, and even radiatively or thermally powered winds were discussed by Ballantyne & Strohmayer (2004) and Ballantyne & Everett (2005), who attempted to explain the time evolution of the properties of the superburst of 4U 1820-303. More recently, Worpel et al. (2013), fitting the spectra of all photospheric radius expansion (PRE) bursts observed with the Rossi X-ray Timing Explorer (RXTE) as the sum of a blackbody and a scalable continuum having the shape of the pre-burst persistent emission, reported a systematic increase of the persistent emission during the burst. They interpreted this result as evidence of an accretion rate enhancement due to a rapid increase of the radiation torque on a thin accretion disk, as formalized early on by Walker (1992). A similar finding was reported by in’t Zand et al. (2013) for a burst observed simultaneously by Chandra and RXTE, although disk reprocessing of the burst emission was preferred as an alternative explanation.
| Source | Burst ID | Obs ID | Start time | a𝑎aa𝑎aValues taken from Galloway et al. (2008). Distances of 6 and 3.6 kpc were taken to compute the peak luminosity and total energy | a𝑎aa𝑎aValues taken from Galloway et al. (2008). Distances of 6 and 3.6 kpc were taken to compute the peak luminosity and total energy | a𝑎aa𝑎aValues taken from Galloway et al. (2008). Distances of 6 and 3.6 kpc were taken to compute the peak luminosity and total energy | ||
| (RXTE time) | (1038 ergs/s) | (1039 ergs) | (s) | (cts/s) | (cts/s) | |||
| 4U 1636-536 | 4 | 10088-01-08-030 | 94671416 | 2.68 | 5.54 | 20.7 | 788 | 9931 |
| 6 | 30053-02-02-02 | 146144682 | 2.89 | 1.78 | 6.2 | 679 | 9740 | |
| 9 | 40028-01-02-00 | 162722852 | 2.94 | 1.84 | 6.3 | 569 | 9927 | |
| 21 | 40028-01-18-000 | 208401523 | 2.79 | 2.35 | 7.0 | 737 | 9916 | |
| 22 | 40028-01-18-00 | 208429016 | 2.76 | 1.85 | 6.7 | 574 | 10000 | |
| 23 | 40028-01-19-00 | 208740744 | 2.79 | 2.13 | 7.6 | 541 | 10116 | |
| 39 | 60032-01-09-00 | 242286131 | 1.46 | 1.33 | 9.1 | 417 | 7089 | |
| 40 | 60032-01-09-01 | 242295310 | 1.06 | 1.14 | 10.9 | 425 | 5355 | |
| 41 | 60032-01-10-00 | 242708641 | 2.00 | 1.50 | 7.5 | 428 | 9611 | |
| 168 | 91024-01-30-10 | 374626248 | 2.98 | 2.06 | 6.9 | 473 | 9604 | |
| 4U 1608-522 | 4 | 30062-02-01-000 | 133389809 | 1.43 | 1.35 | 9.1 | 643 | 9004 |
| 5 | 30062-01-01-00 | 133625123 | 2.34 | 2.32 | 9.9 | 543 | 10339 | |
| 21 | 70059-01-20-00 | 273983179 | 2.33 | 1.93 | 8.3 | 617 | 10562 | |
| 23 | 70059-03-01-000 | 274421898 | 2.39 | 3.16 | 13.2 | 517 | 10549 | |
| 24 | 70059-03-01-000 | 274434678 | 1.08 | 1.1 | 10.2 | 510 | 9528 |
In this paper, we follow a different path and look at kilohertz quasiperiodic oscillations (kHz QPOs) in response to Type I X-ray bursts (see van der Klis 2006 for a review of kHz QPOs). Although there is not yet a consensus on the origin of kHz QPOs, it is generally agreed that they arise from the vicinity of the neutron star (e.g., Barret 2013), most likely in a region to be exposed to the burst emission. It is therefore worth investigating how the QPO properties react to X-ray bursts. For this purpose, we use the RXTE archival data of 4U 1636-536 and 4U 1608-522, known as frequent bursters (Galloway et al. 2008) and whose lower kHz QPOs can be detected and followed on the burst duration timescales of tens of seconds (Méndez et al. 1999; Barret et al. 2005, 2006).
2 Data analysis
We retrieved the archived data of the Proportional Counter Array (PCA) onboard RXTE for all the observations containing an X-ray burst for both 4U 1636-536 and 4U 1608-522, using the catalog provided by Galloway et al. (2008). In total, we obtained 172 bursts for 4U 1636-536 and 31 for 4U 1608-522, respectively. Using the Science Events of the PCA, we computed 1/212 s resolution light curves from 200 to +400 s with respect to the burst peak (whenever possible, i.e., when no observation gap restricted this time interval). The date was fixed for each burst at the peak count rate using 1 s resolution light curves. In order to limit the influence of the nonmodulated burst photons in our analysis, while keeping enough statistics for the QPO detection, we chose to restrict our study to the 6–50 keV band. The burst emission dominates in the soft X-ray band while the QPO modulated photons have a harder spectrum (Berger et al. 1996).
2.1 Data reduction
Dynamical Fourier power density spectra (PDS) containing the time series of Leahy normalized PDS (Leahy et al. 1983) were computed. These spectra were obtained with an integration time of 1 s and a Nyquist frequency of = 2048 Hz. Segments of data containing an X-ray burst and a QPO detectable on short timescales (20–30 s) were identified. A list of 10 and 5 bursts in 4U 1636-536 and 4U 1608-522, respectively, was so obtained (see Table 1 for a summary of the main properties of these bursts).
2.2 Initial results
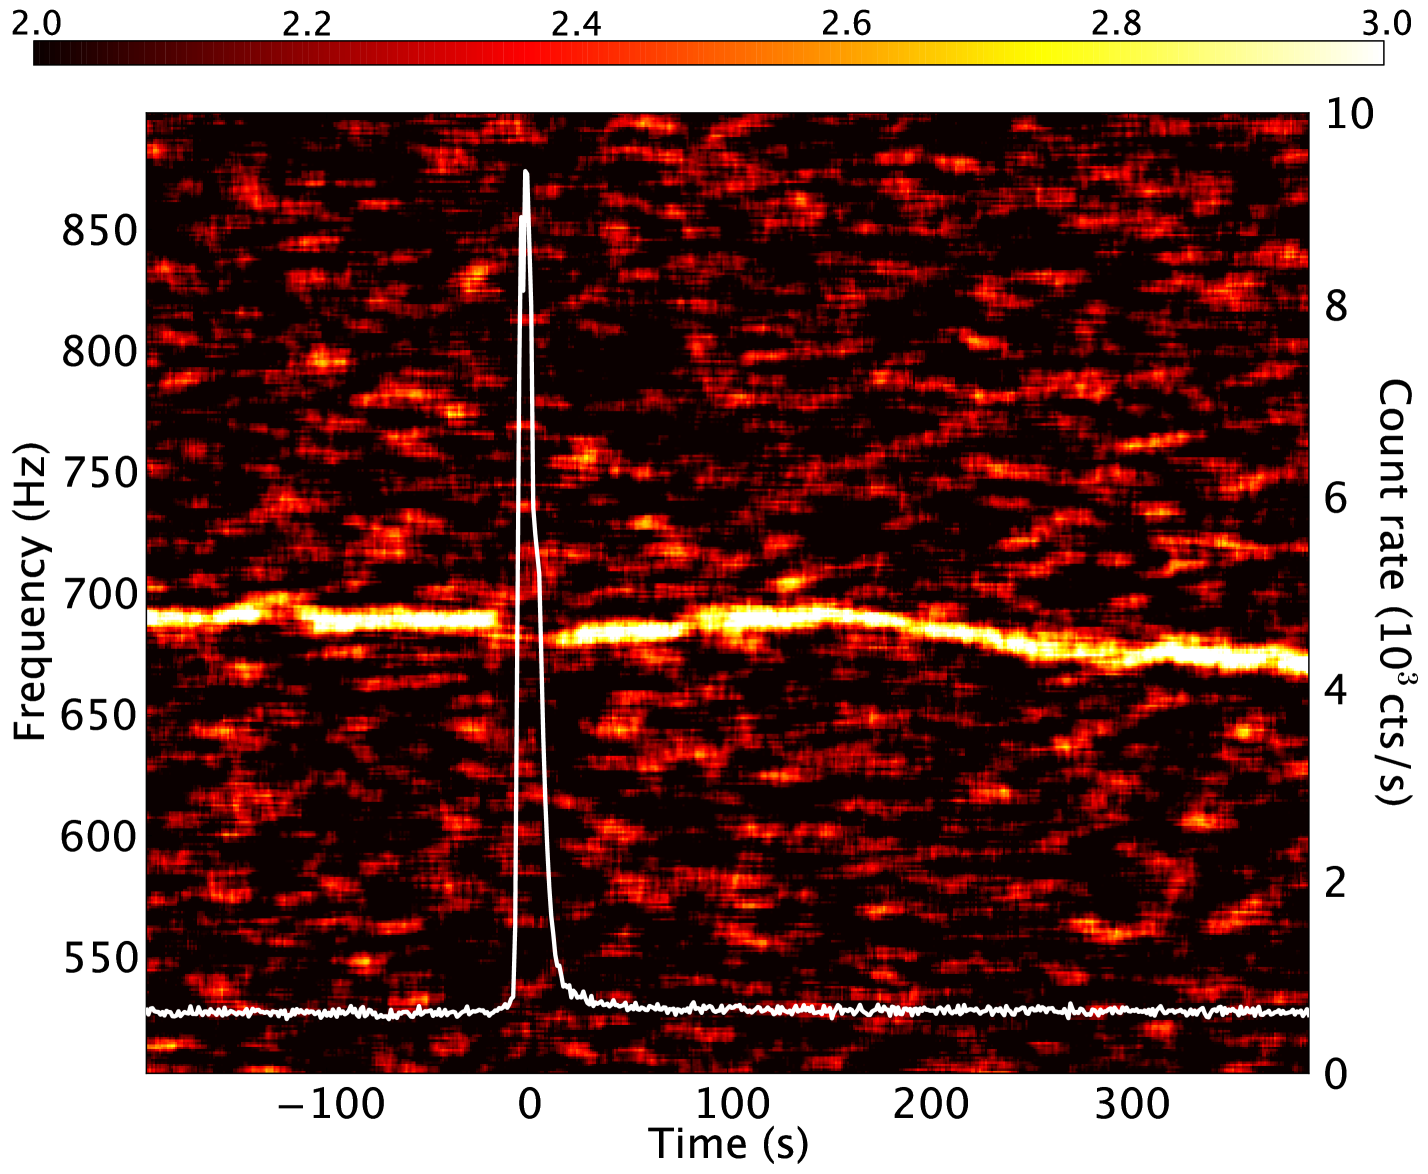
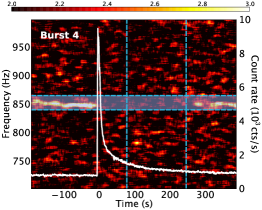
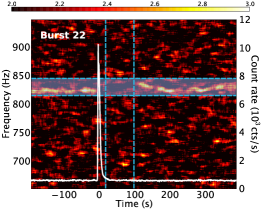
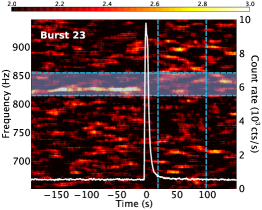
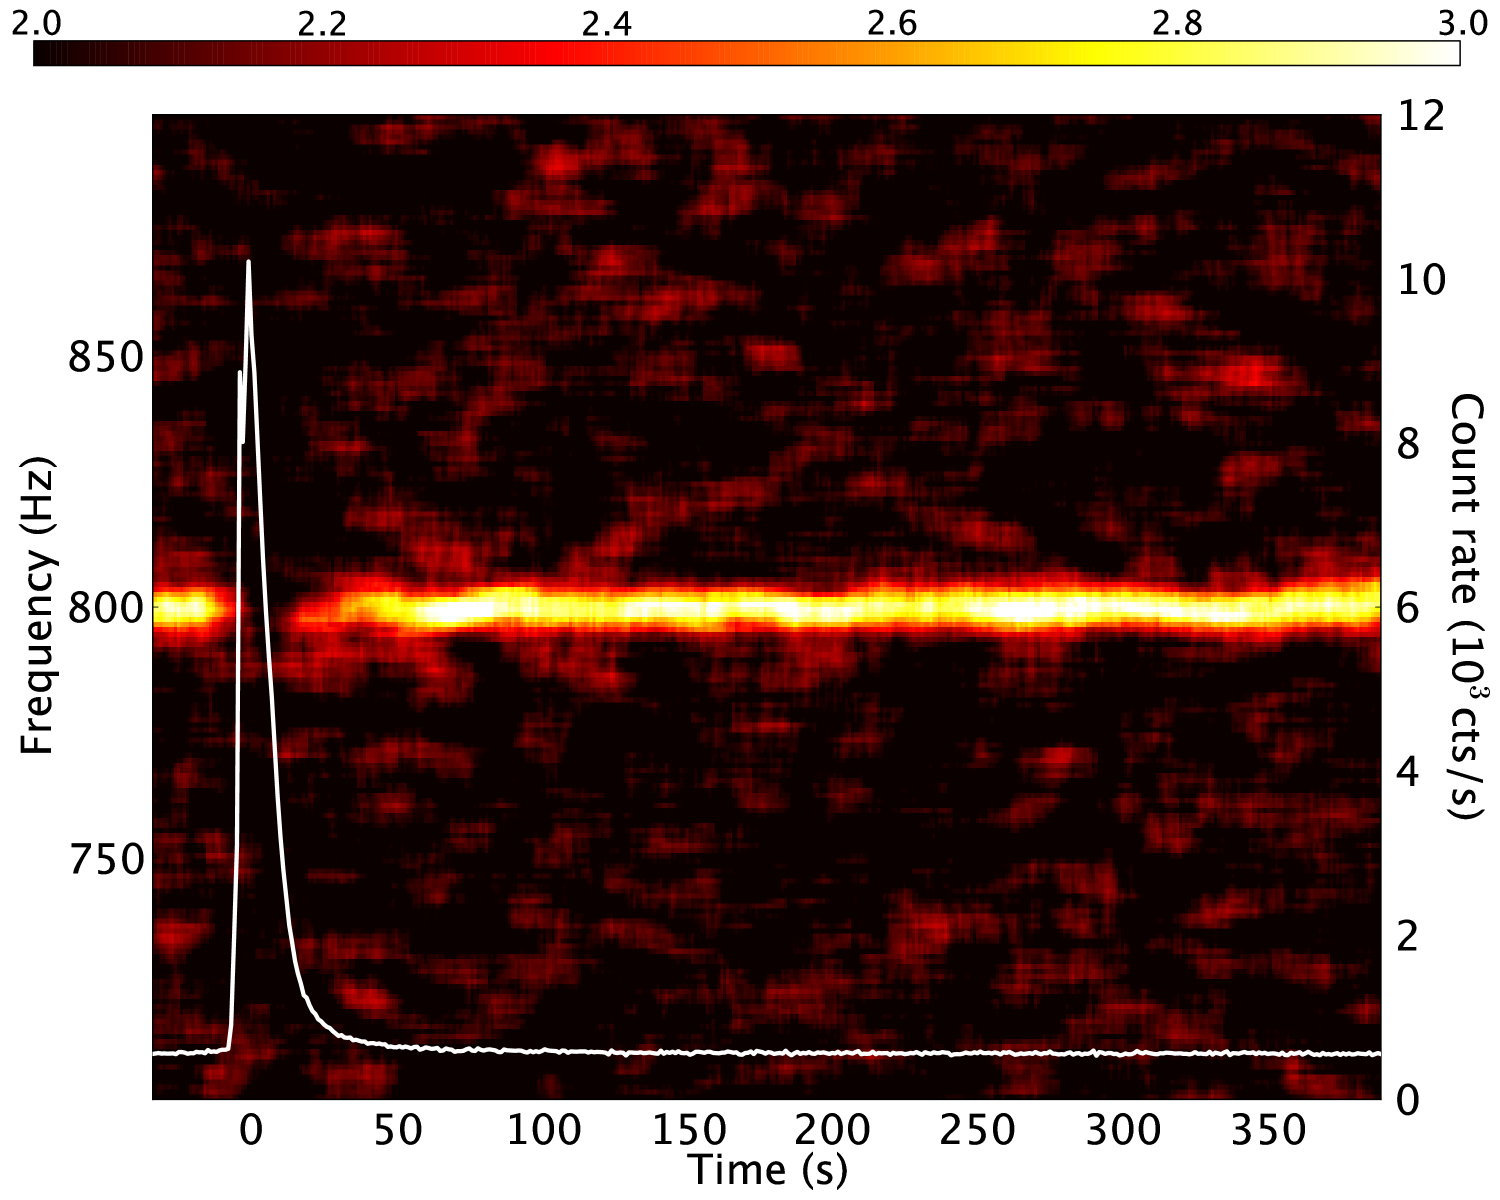
The most common pattern observed in the dynamical PDS is illustrated in Fig. 1: the QPO is clearly detected both before and after the X-ray burst at about the same frequency (i.e., at a frequency consistent with the usual drift of the QPO frequency), but in an interval of 20–30 s after the onset, the QPO is not detected. This nondetection can be explained by the addition of the nonmodulated burst photons222The significance of excess power is proportional to . , , and rms correspond to the signal count rate, background count rate, and to the fractional rms amplitude of the QPO emission (van der Klis 1989). A burst corresponds to a large increase of , causing the significance of the signal to drop abruptly.. This pattern is, however, not observed in three bursts of 4U 1636-536, for which the QPO remains undetected for up to several hundreds of seconds, while the overall source emission has returned to the level it had before the burst (see Fig. 2).
 |
 |
 |
| Source | Burst ID | Freq | rms (%) | (Hz) | Freq | rms (%) | (Hz) | ||
| 4U 1636-536 | 4 | 848 | 8.50.4 | 10.40.2 | 3.50.3 | (u.l.) | 1.2 (u.l.) | 4.9 (u.l.) | (u.l.) |
| 6 | 874 | 6.70.4 | 10.00.3 | 4.30.4 | 8762.5 | 7.92.8 | 10.91.9 | 13.86.3 | |
| 9 | 862 | 8.20.4 | 11.90.3 | 5.50.4 | 8550.6 | 5.31.9 | 9.81.8 | 4.83.0 | |
| 21 | 859 | 9.50.5 | 11.40.3 | 5.60.5 | 8540.4 | 7.21.3 | 10.00.9 | 3.50.9 | |
| 22 | 823 | 5.90.4 | 10.30.3 | 3.90.3 | (u.l.) | 2.6 (u.l.) | 6.9 (u.l.) | (u.l.) | |
| 23 | 825 | 5.40.3 | 10.00.3 | 2.20.2 | (u.l.) | 2.6 (u.l.) | 7.1 (u.l.) | (u.l.) | |
| 39 | 802 | 3.20.3 | 8.70.4 | 2.00.4 | 7962.1 | 5.11.8 | 11.32.0 | 8.33.8 | |
| 40 | 843 | 5.20.4 | 11.00.4 | 4.20.5 | 8390.5 | 5.71.3 | 11.91.4 | 3.71.3 | |
| 41 | 820 | 3.90.3 | 9.50.4 | 2.70.3 | 8260.7 | 5.51.4 | 12.01.5 | 5.01.7 | |
| 168 | 849 | 4.90.3 | 10.00.3 | 2.70.3 | 8490.7 | 6.71.5 | 12.21.4 | 5.31.6 | |
| 4U 1608-522 | 4 | 689 | 10.90.5 | 12.90.3 | 5.60.3 | 6840.5 | 10.91.8 | 13.61.1 | 5.51.3 |
| 5 | 740 | 8.80.4 | 12.80.3 | 4.70.3 | 7221.2 | 11.63.0 | 15.72.0 | 12.14.4 | |
| 21a𝑎aa𝑎aFor this burst, not enough data were recorded before the burst and the QPO parameters have been estimated away from the burst (200 s after), and taken as representative of the QPO parameters before the burst. | 703 | 10.80.4 | 13.20.3 | 4.70.3 | 7040.8 | 10.12.0 | 13.41.3 | 7.92.1 | |
| 23 | 813 | 5.80.4 | 10.40.3 | 4.10.3 | 8012.8 | 6.01.8 | 12.81.9 | 6.72.8 | |
| 24 | 805 | 8.50.5 | 12.80.4 | 5.70.5 | 7900.5 | 9.31.8 | 13.61.3 | 5.31.5 |
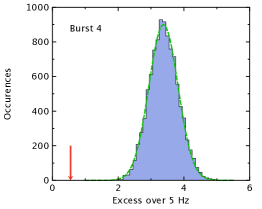
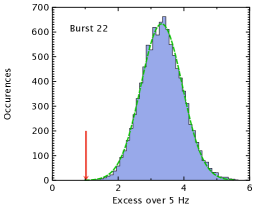
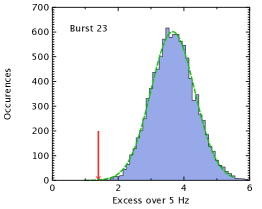
We then simulated the effect of the burst photons on the QPO detectability. For this purpose, we first estimated the QPO parameters (amplitude, frequency, width) using segments of 100 s duration prior to the bursts between s and s, stepped by 10 s (sliding window). The QPO was fitted by a Lorentzian with the maximum likelihood method described in Barret & Vaughan (2012) and was found to be highly significant in each segment. The final parameters were thus obtained by computing the weighted average of the best fit parameters found in each segment (see Table 2). A persistent emission light curve with the same time resolution as the data (1/212 s) containing such a QPO was then randomly simulated following Timmer & Koenig (1995). The burst light curve was itself computed on the same time resolution, starting from the interpolation of the one recorded with one-second time bins. Poisson noise fluctuations were added to the high-time-resolution burst light curve, which was then added to the light curve of the persistent emission containing the QPO. The summed light curve was then processed the same way as the real data to produce one-second PDS. This procedure was repeated 10 000 times. The PDS were averaged within the nondetection gap for both the data and the simulations, and excesses of power were searched over the same frequency interval around the QPO frequency in a 5 Hz window (see Fig. 2). In conditions representative of the three bursts, the simulations systematically reproduced an excess of power larger than the one found in the data, strongly suggesting that the QPO was affected by the burst (see Fig. 3). A more quantitative estimate of the significance of these nondetections can be obtained by comparing the excess of power found in the data with the distributions produced by the simulations. For that particular PDS integration time (1 s), Gaussian fits yield probabilities of observing the gap if the QPO parameters were not affected by the burst of for burst 4, for burst 22, and for burst 23 (see Fig. 3). The nondetection gaps during bursts 22 and 23 can therefore only be considered as marginally significant.
 |
 |
 |
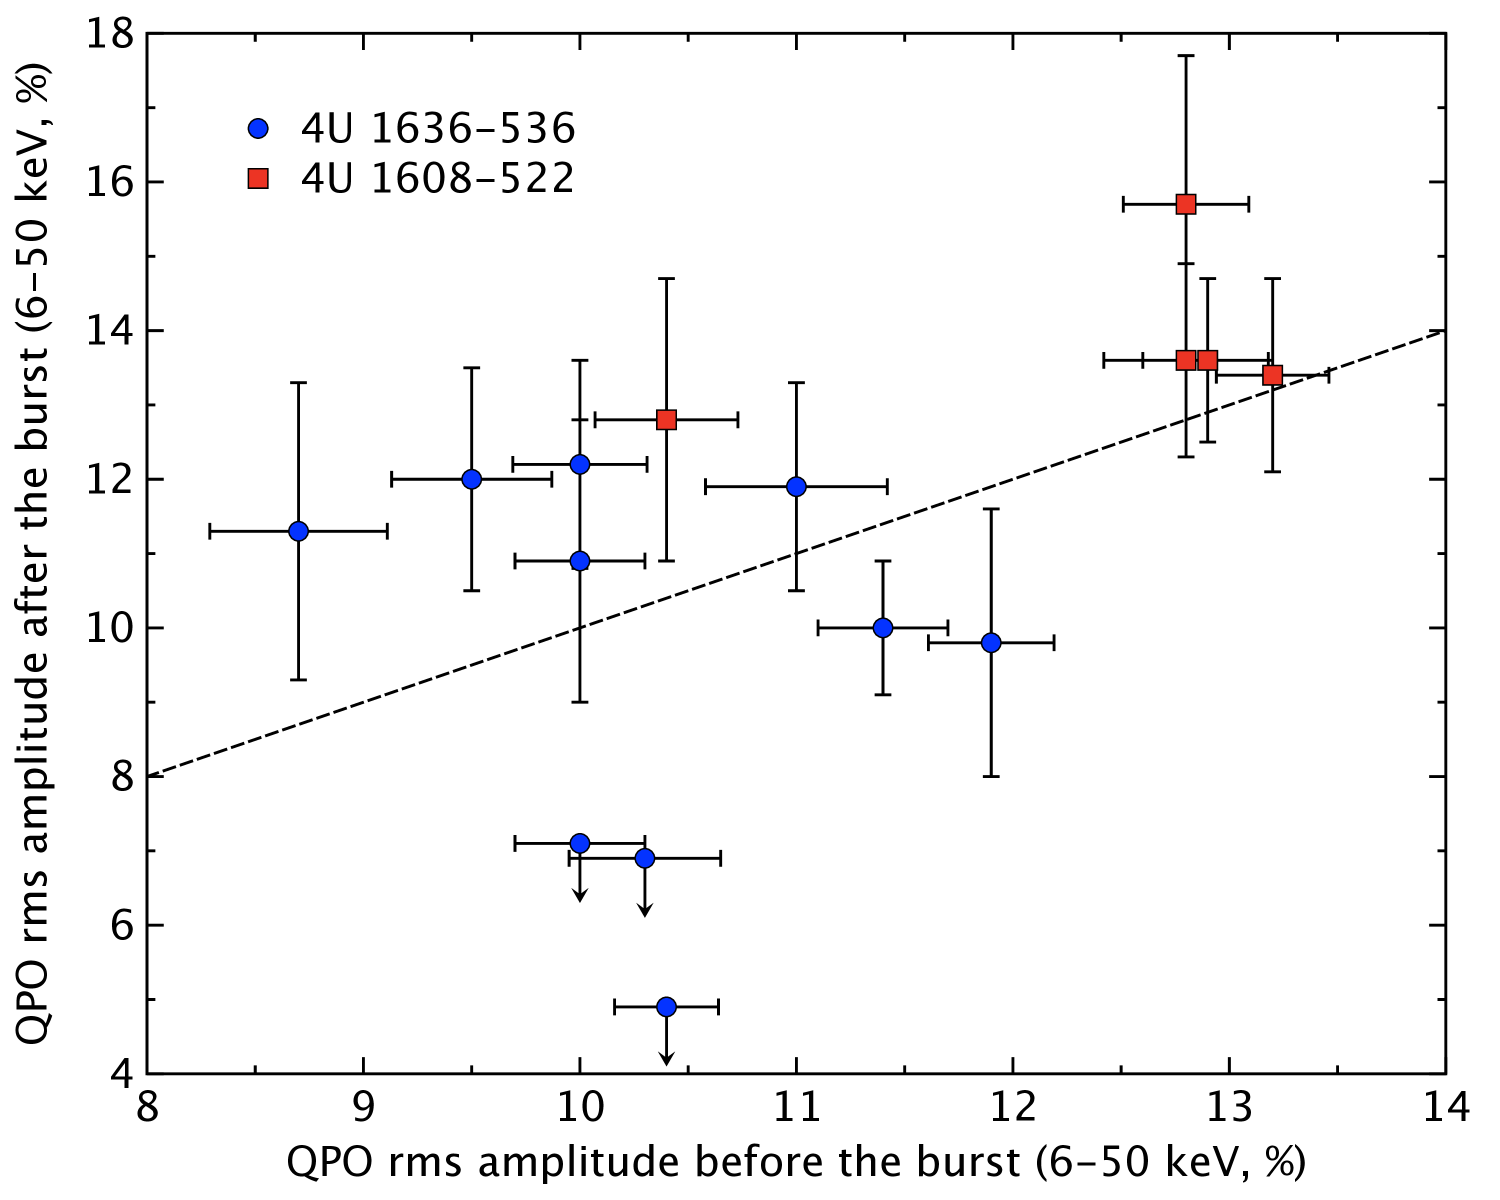
Another way to illustrate this is by comparing the rms amplitude of the QPO prior to the burst and the rms upper limit on the QPO during the nondetection gap, considering the QPO width unchanged and the burst photons contributing to the noise. As listed in Table 2, 90% confidence level upper limits are significantly below the QPO rms measured prior to the burst. On the other hand, for all the other bursts of 4U 1636-536 (and 4U 1608-522), the rms amplitude of the QPO measured before and after the burst are consistent with one another, as shown in Fig. 4 (see Table 2 for more detail). We note that in order to take into account the changing count rate during the burst decay and the fact that burst photons are not modulated, the rms amplitude of the QPO was computed from the Lorentzian normalization factor (Barret & Vaughan 2012) using the relation
| (1) |
where is the one-second resolution count rate in the time interval of duration and the count rate in the persistent emission.
2.3 Stacking of the bursts
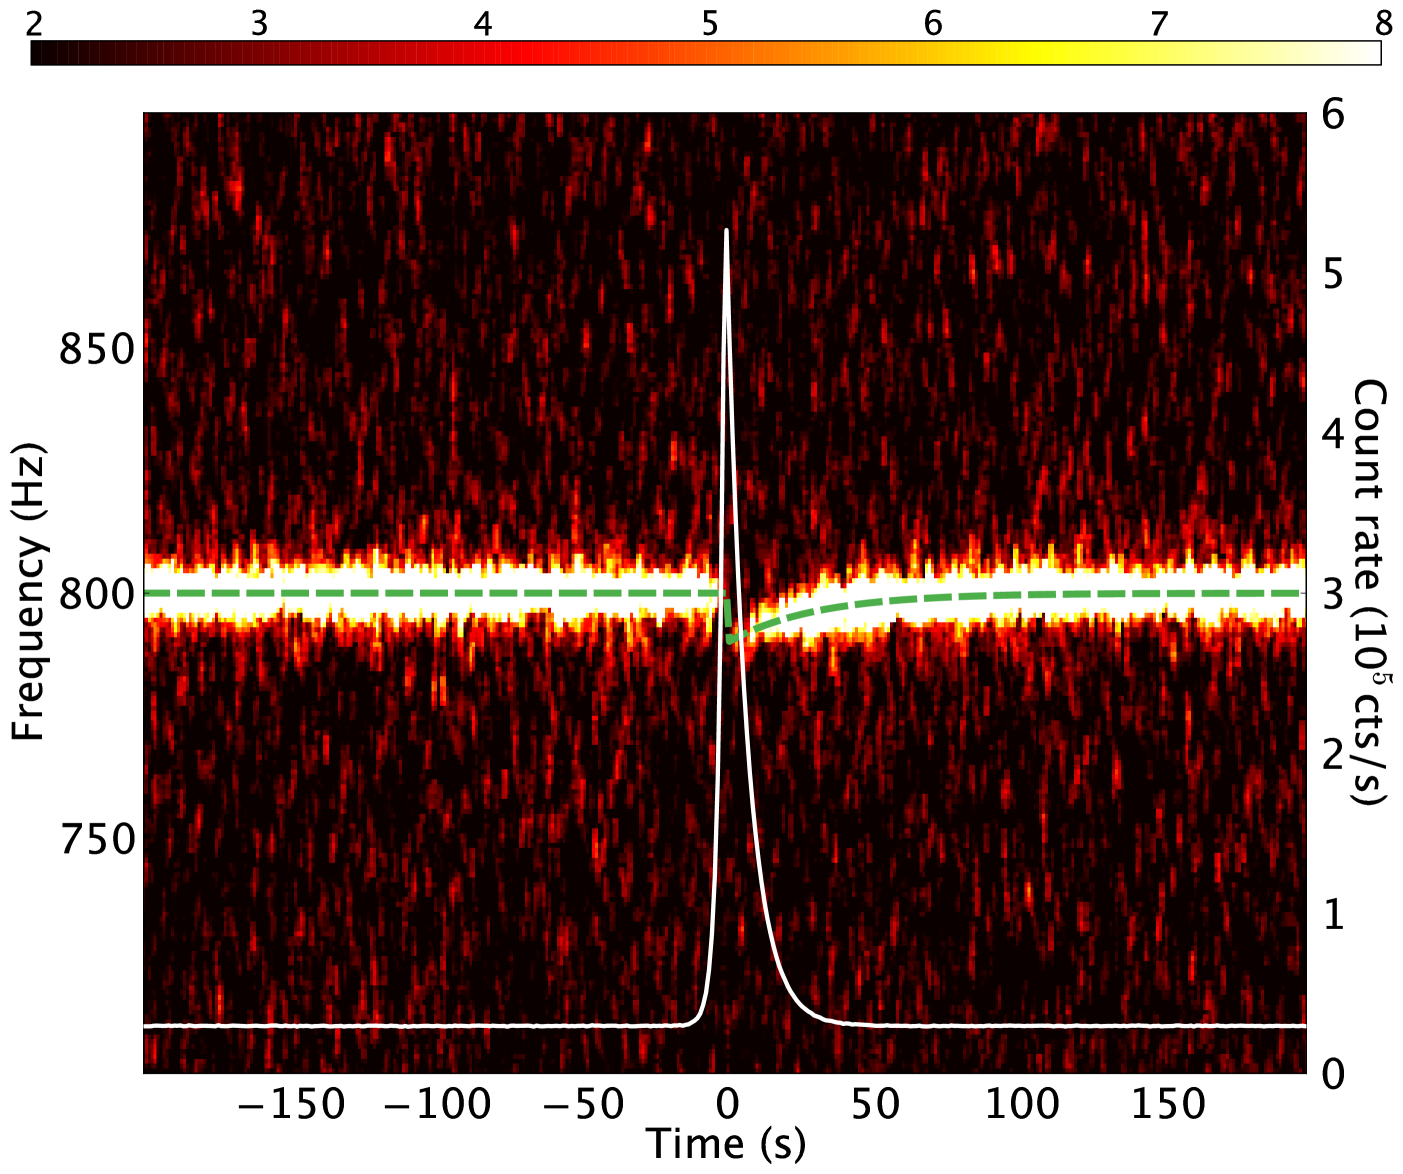
As shown in Fig. 4, all QPOs from 4U 1608-522 show a stable rms amplitude. In addition, for 4U 1608-522, the QPOs are easier to track on short timescales than for 4U 1636-536. As a way to improve our QPO detection sensitivity around the burst, one can combine the PDS from different bursts, after aligning them to a reference frequency. The QPO frequency was tracked before and after the burst using an algorithm similar to the one presented in Barret et al. (2006), which uses the centroid of the excess power as a proxy of the QPO frequency (when the significance of the QPO is not sufficient to obtain a stable fit). We note that because no signal can be detected during the bursts, the frequency is obtained by interpolating between the values before and after the bursts. We have checked through extensive Monte Carlo PDS simulations of QPOs of varying frequency, in the presence of a typical X-ray burst of 4U 1608-522, that such an algorithm did not introduce any systematic biases in the recovered QPO parameters, and is therefore suitable for combining PDS of different bursts. The dynamical PDS produced for 4U 1608-522 after all the PDS were aligned to an 800 Hz reference frequency is shown in Fig. 5. Clearly the nondetection gap is now restricted to an area very close to the burst peak. For example, a 6.6 excess of power is detected in a 15-second interval, 15 s after the burst peak. We have thus set a conservative upper limit of 20 s on the QPO reappearance or on its recovery time.
Sliding a 20 s window over the burst (with one-second steps, i.e., steps of one second each), one can track the evolution of the significance of the QPO detection as a function of time, and compare it to the one for which the QPO parameters are unchanged during the bursts and only the burst photons add to the noise to lower the detection significance. This is shown in Fig. 6; the solid curve shows the evolution of the significance of the maximum power excess over 4 Hz (total power exceeding the Poisson level of 2) measured as a function of time in the stacked PDS between 790 Hz and 810 Hz. The dashed line corresponds to the level expected assuming that the QPO parameters measured before the burst do not change during the bursts. It is remarkable how close the observed and predicted profiles are444The small difference between the two curves in the persistent emission after the burst is due to the measurement of the power excess used here being sensible to positive noise fluctuations around the QPO profile., suggesting that for our sample of 4U 1608-522 bursts, the QPOs were unaffected by the presence of the bursts.

3 Comparison with burst parameters
 |
 |
 |
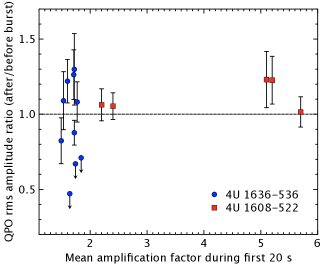 |
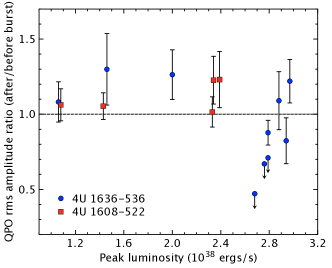
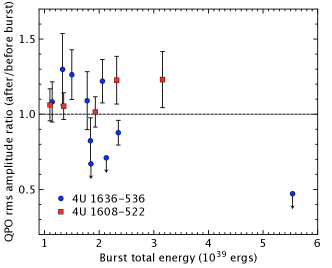
In the above analysis, we have shown that not all QPOs respond the same way to Type I X-ray bursts. Here we wish to investigate whether this can be related to changes in the burst parameters. In Fig. 7 we plot the ratio of the rms amplitude of the QPO after and before the burst (see Table 2 for more detail), against the peak luminosity and burst total energy. As can be seen, no clear trend is observed within the limited sample of the bursts considered in our analysis concerning the peak luminosity. Nonetheless, the burst showing a highly significant disappearance of the QPO (4) – as well as the two bursts where the lack of QPO signal is marginally significant (22 and 23) – has a peak luminosity that lies on the high part of the diagram. It is striking to see that burst 4 has an exceptionally large total energy which is due to its long duration. Unfortunately, extending our analysis to bursts observed after the Galloway et al. (2008) catalog did not provide us with further useful observations and these trends could not be confirmed.
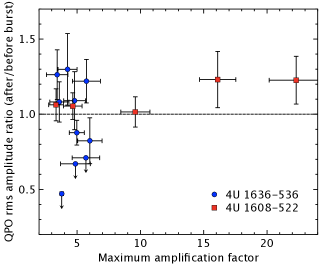
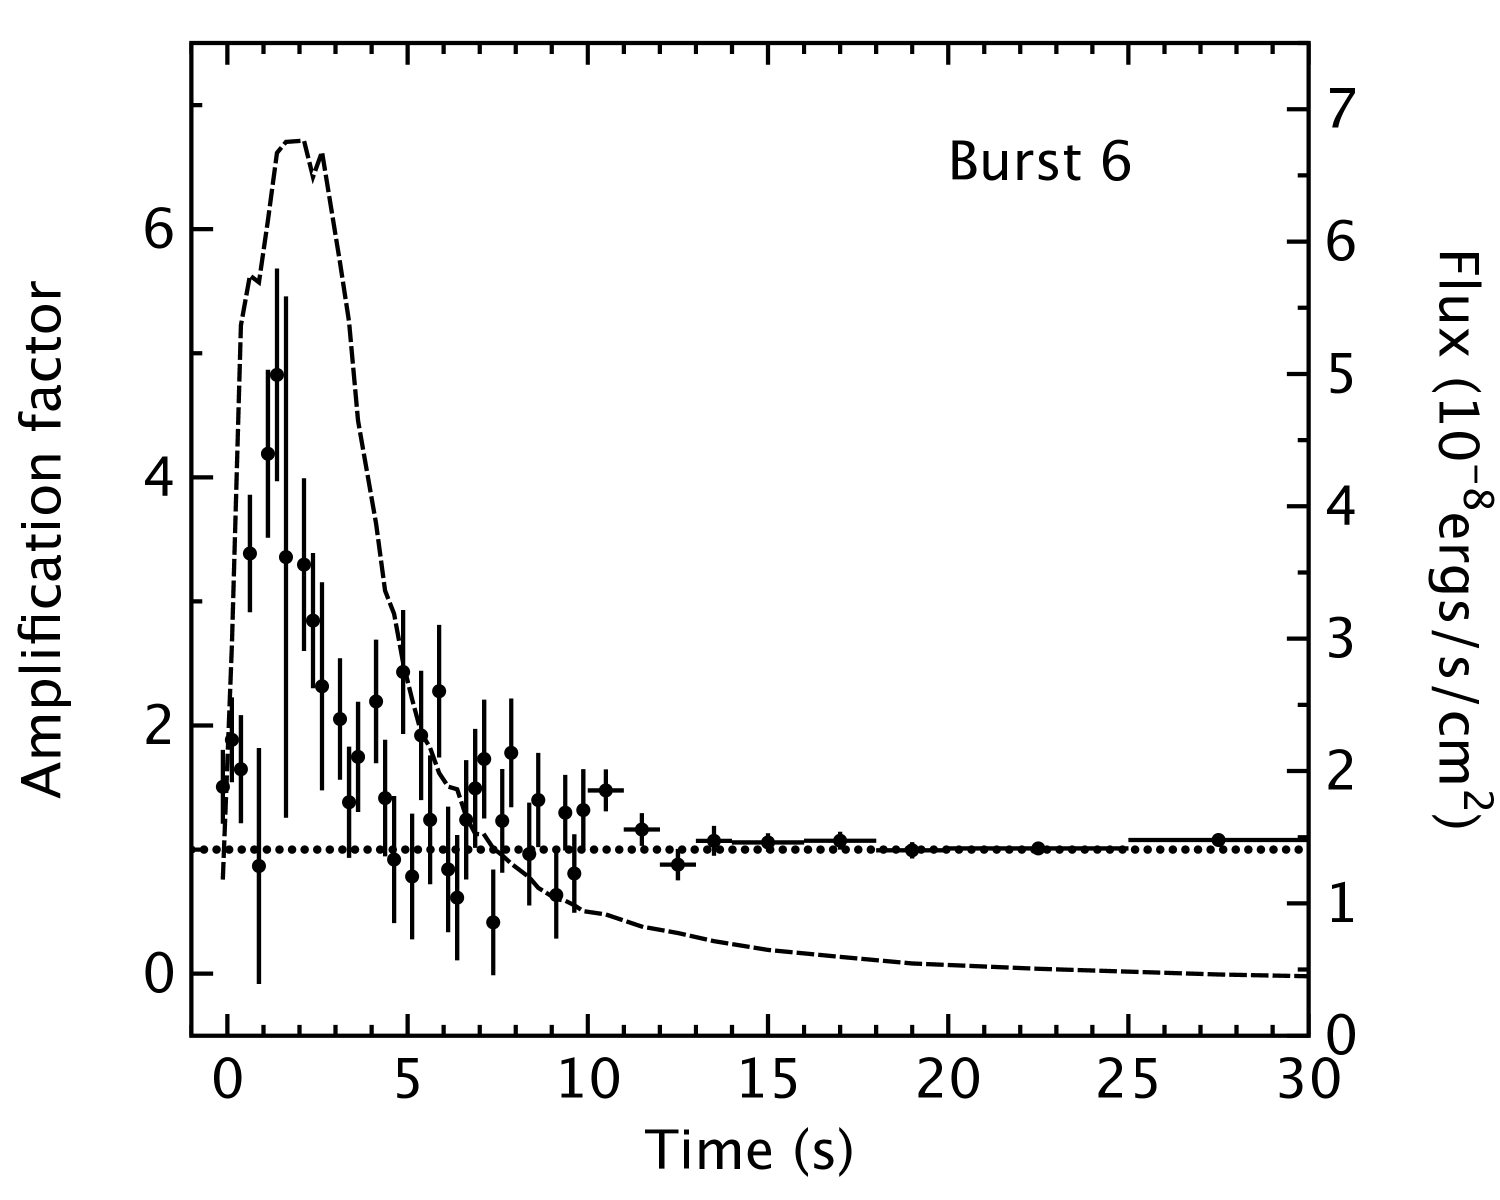
We have also performed a spectral analysis of our burst sample following the recent work of Worpel et al. (2013), where the time resolved burst spectrum is fitted as the sum of an absorbed blackbody and a scalable persistent emission spectrum (with a scaling factor ), as fitted before the burst. Fixed hydrogen column densities of N (Pandel et al. 2008) and cm-2 (Güver et al. 2010) were used for 4U 1636-536 and 4U 1608-522, respectively. Spectra were fitted in the 2.5 – 20 keV band using xpsec version 12.8. Burst spectra were extracted with variable time steps matching the burst dynamics. Two different models were used to fit the persistent emission spectrum: wabs*(nthcomp+diskline) for 4U 1636-536 and wabs*(nthcomp+gaussian+bbodyrad) for 4U 1608-522. As discussed by Worpel et al. (2013), what matters is to have a model that describes accurately the persistent emission before the bursts. Both models provide good and stable fits. Like Worpel et al. (2013), we found that increases during the peak phase (up to 20 or so, with typical values around 5), and remains significantly above 1 over the 20-s interval following the burst. An example of variations for three bursts is shown in Fig. 8. No correlation was found between the ratio of the QPO rms amplitude before and after the burst and , neither its maximum value nor its mean value over the first 20-s interval (as shown in Fig. 7). Yet, it is interesting to note that with the exception of the long burst of 4U 1636-536 (Fig. 2, left panel), has returned to 1 within 20 s. This value is commensurable with the recovery time inferred from the stacking of the 4U 1608-522 data.

|
|

|
4 Discussion
High frequency QPOs are commonly believed to be generated close to the neutron star surface or in the innermost parts of the accretion disk. Similarly, Type I X-ray bursts are produced on the neutron star surface and radiate away enough energy to change the proprieties of the accretion flow. It is therefore natural to investigate the impact of a Type I X-ray burst on kHz QPOs. Our finding that there may be cases where the QPO is affected by the bursts on timescales of hundreds of seconds and cases where the QPO does not suffer from the bursts down to the shortest timescales that can be investigated by current data (20 s) is clearly puzzling, especially because these two behaviors cannot be irrefutably connected in our limited sample to different properties of the bursts, such as the burst peak luminosity. We now discuss our results in the framework of the recent work by Worpel et al. (2013), claiming that the accretion rate is enhanced during Type I X-ray bursts.
4.1 A disk recession?
As accretion disks are optically thick in the radial direction, an enhanced accretion rate due to radiation torque can only be attained through disk depletion: implies a receding disk. The Eddington-scaled accretion rate in our data sets is 0.12 and 0.04 for 4U 1636-536 and 4U 1608-522, respectively, using a neutron star mass of 1.4 M⊙. If we take conservative values for the mean measured during the 20 s following the burst onset of 1.5 and 2 for the two sources, this gives depleted masses of at least and g. Using standard accretion disks as described in Shakura & Sunyaev (1973) to model the mass distribution in the inner parts of the disk with an -parameter of 0.1, these masses correspond approximately to the mass contained between 7–50 for 4U 1636-536, and 7–30 for 4U 1608-522. It is important to note that the disk surface density scales as 1/ which is poorly constrained and that these masses are only rough estimates.
An estimate of the timescale at which the disk recovers its former geometry is given by the viscous time (Frank et al. 2002, Eq. 5.69),
| (2) |
with the distance to the neutron star center, the accretion rate, and the neutron star mass. For M⊙, , and with the appropriate accretion rates, we find s at 50 for 4U 1636-536 and s at 30 for 4U 1608-522. It is worth noting that increasing gives shorter viscous times, but it also increases the radius matching the loss of mass and similar timescales are found. Within all the caveats of the above assumptions, it is interesting to note that these timescales match the nondetection gap of the two shorter bursts from 4U 1636-536, shown in Fig. 2. We note however that for the longer burst of 4U 1636-536, is still above 1 while the QPO reappears (see Fig. 8), which argues against the idea that the disk is still truncated through depletion. This clearly suggests that caution should be used when using to derive the accretion rate during the burst. Some refinements in the Worpel et al. (2013) model might be necessary such as considering modifications of the spectral shape of the persistent emission during the burst. If such high levels of disk depletion occur, one would expect at least the disk emission to be modified; for example, a change in the disk inner radius from 7 to 50 would decrease its inner temperature by a factor of 4.4, assuming a dependency of as in Shakura & Sunyaev (1973). The timescales found are also a factor of 5-10 longer than the recovery time we inferred from 4U 1608-522, thus suggesting that an alternative to disk depletion should be considered.
4.2 Heating of the inner region?
To reduce the viscous disk recovery time, only the innermost part of the accretion disk should be affected. At 10 , the viscous time 18 s for 4U 1636-536 and 25 s for 4U 1608-522 with an -parameter of 0.1. One possibility could thus be disk irradiation by the burst photons, which is expected to produce significant heating, and might cause the disk to puff up (Ballantyne & Everett 2005). Leaving aside the two shorter bursts of 4U 1636-536 for which the QPO disappearance is marginally significant, such a mechanism could be consistent with the late reappearance of the QPO in the longer one (while the burst is still ongoing), but also with the short recovery times of the QPOs in 4U 1608-522. This might indicate that the modulated emission reappears only when the level of heating is sufficiently low. Unfortunately, current data cannot tell us what happens to the QPO within the first 20 s in 4U 1608-522, e.g., whether its amplitude drops or its coherence decreases. Hence, although that seems unlikely, we also cannot exclude that there is no effect of the burst on the QPO in this source.
Existing data are therefore insufficient to access timescales shorter than 20 s, while we would like to measure the QPO parameters as close as possible to the burst peak. Assuming that the QPO amplitude and width remain constant within the burst and only the QPO frequency varies, in Fig. 9 we show that a new generation timing instrument like the LOFT/LAD (Feroci et al. 2012) would allow us to track the QPO frequency, even at the burst peak. Tracking the QPO frequency along the frequency drift assumed in the simulation requires an increase in effective area by at least one order of magnitude (15 in the case considered here555LOFT/LAD response files were downloaded from http://www.isdc.unige.ch/loft for the simulation. We have assumed the goal effective area of 12 m2 at 8 keV for the LAD. ). This simulation illustrates how such a large area timing instrument could deliver breakthrough observations on the burst-QPO interaction, providing at the same time insights on the location of the QPO modulated emission.
4.3 Conclusions
The interaction between the kHz QPO signals and Type-I X-ray bursts has been studied in two LMXBs: 4U 1636-536 and 4U 1608-522. Two types of behaviors of different timescales have been identified. We have found clear evidence of an interaction of the burst with the QPO emission during an exceptionally long burst (and a possible indication for two others) while for most of them, within the current data, the QPO does not seem to be affected by the burst. We have set an upper limit of 20 s for the recovery time of the QPO in 4U 1608-522. We have shown that a next generation timing mission providing an increase in effective area of at least an order of magnitude, such as LOFT, would be able to detect the QPO throughout the bursts and hence provide better constraints on the physics of the interaction of the burst emission and its surroundings. This would need to be complemented by theoretical work aimed at a better modeling of the burst-disk interaction.
Acknowledgements.
This research has made use of data obtained through the High Energy Astrophysics Science Archive Research Center On-line Service, provided by the NASA/Goddard Space Flight Center. We thank Duncan K. Galloway and Hauke Worpel for helpful conversations and suggestions. We also thank Mariano Mendez for a careful review of the paper, and comments which helped to improve its quality.References
- Ballantyne & Everett (2005) Ballantyne, D. R. & Everett, J. E. 2005, ApJ, 626, 364
- Ballantyne & Strohmayer (2004) Ballantyne, D. R. & Strohmayer, T. E. 2004, ApJ, 602, L105
- Barret (2013) Barret, D. 2013, ApJ, 770, 9
- Barret et al. (2005) Barret, D., Kluźniak, W., Olive, J. F., Paltani, S., & Skinner, G. K. 2005, MNRAS, 357, 1288
- Barret et al. (2006) Barret, D., Olive, J.-F., & Miller, M. C. 2006, MNRAS, 370, 1140
- Barret & Vaughan (2012) Barret, D. & Vaughan, S. 2012, ApJ, 746, 131
- Berger et al. (1996) Berger, M., van der Klis, M., van Paradijs, J., et al. 1996, ApJ, 469, L13
- Chen et al. (2011) Chen, Y.-P., Zhang, S., Torres, D. F., et al. 2011, A&A, 534, A101
- Cumming (2004) Cumming, A. 2004, Nuclear Physics B Proceedings Supplements, 132, 435
- Degenaar et al. (2013) Degenaar, N., Miller, J. M., Wijnands, R., Altamirano, D., & Fabian, A. C. 2013, ApJ, 767, L37
- Feroci et al. (2012) Feroci, M., Stella, L., van der Klis, M., et al. 2012, Experimental Astronomy, 34, 415
- Frank et al. (2002) Frank, J., King, A., & Raine, D. J. 2002, Accretion Power in Astrophysics: Third Edition
- Galloway et al. (2008) Galloway, D. K., Muno, M. P., Hartman, J. M., Psaltis, D., & Chakrabarty, D. 2008, ApJS, 179, 360
- Güver et al. (2010) Güver, T., Özel, F., Cabrera-Lavers, A., & Wroblewski, P. 2010, ApJ, 712, 964
- in’t Zand et al. (2011) in’t Zand, J. J. M., Galloway, D. K., & Ballantyne, D. R. 2011, A&A, 525, A111
- in’t Zand et al. (2013) in’t Zand, J. J. M., Galloway, D. K., Marshall, H. L., et al. 2013, A&A, 553, A83
- Kuulkers et al. (2003) Kuulkers, E., den Hartog, P. R., in’t Zand, J. J. M., et al. 2003, A&A, 399, 663
- Leahy et al. (1983) Leahy, D. A., Darbro, W., Elsner, R. F., et al. 1983, ApJ, 266, 160
- Méndez et al. (1999) Méndez, M., van der Klis, M., Ford, E. C., Wijnands, R., & van Paradijs, J. 1999, ApJ, 511, L49
- Nakamura et al. (1989) Nakamura, N., Dotani, T., Inoue, H., et al. 1989, PASJ, 41, 617
- Pandel et al. (2008) Pandel, D., Kaaret, P., & Corbel, S. 2008, ApJ, 688, 1288
- Serino et al. (2012) Serino, M., Mihara, T., Matsuoka, M., et al. 2012, PASJ, 64, 91
- Shakura & Sunyaev (1973) Shakura, N. I. & Sunyaev, R. A. 1973, A&A, 24, 337
- Strohmayer & Bildsten (2003) Strohmayer, T. & Bildsten, L. 2003, ArXiv Astrophysics e-prints
- Timmer & Koenig (1995) Timmer, J. & Koenig, M. 1995, A&A, 300, 707
- van der Klis (1989) van der Klis, M. 1989, in Timing Neutron Stars, ed. H. Ögelman & E. P. J. van den Heuvel, 27
- van der Klis (2006) van der Klis, M. 2006, Rapid X-ray Variability, 39–112
- Walker (1992) Walker, M. A. 1992, ApJ, 385, 642
- Worpel et al. (2013) Worpel, H., Galloway, D. K., & Price, D. J. 2013, ApJ, 772, 94
- Yu et al. (1999) Yu, W., Li, T. P., Zhang, W., & Zhang, S. N. 1999, ApJ, 512, L35