75282
H. Böhringer
X-ray Observations of the Chemical Abundances in the Intra-Cluster Medium
Abstract
Clusters of galaxies as the largest clearly defined objects in our Universe are ideal laboratories to study the distribution of the most abundant chemical elements heavier than hydrogen and helium and the history of their production. The cluster environment allows us to study the element abundances not only inside the galaxies, but also in the intergalactic space, the intracluster medium. Since the intracluster medium is heated to temperatures of several ten Million degrees, we can study the chemical composition of this medium through X-ray spectroscopy. Up to 13 heavy elements have been detected by X-ray spectroscopy so far. The element most easily detected in the X-ray spectra is iron. In massive galaxy clusters we find a larger mass of heavy elements in the intracluster medium than in the galaxies. The consideration of the intracluster medium is therefore vital for an understanding of the complete history of nucleosynthesis of the heavy elements. The observed abundances for all elements heavier than nitrogen can roughly be modeled by using two types of sources: core collapse supernovae and supernovae type Ia. So called cool-core galaxy clusters show a larger heavy element abundance in the cluster center which seems to be enriched primarily by products of supernovae of type Ia. The evidence for observations of an evolution of the heavy element abundance with redshift has still a moderate significance.
keywords:
Galaxies: clusters: intracluster medium – Galaxy: abundances – X-rays: galaxies: clusters1 Introduction
Clusters of galaxies are the largest clearly defined objects in our Universe. They comprise masses in the range of about to M⊙. In the mass range of about few to M⊙ we find the groups and poor clusters of galaxies. As an integral part of the cosmic large-scale structure clusters form from large-scale overdense regions in the matter distribution, the seeds of which have been set presumably at the epoch of inflation. Galaxy clusters form very late in the history of our Universe and the bulk of the cluster population has emerged only after a redshift of 2. Before, hardly any massive clusters existed but groups of galaxies have been present (Böhringer, 2008; Allen et al., 2011)
Most of the mass of galaxy clusters, about 84% in massive systems, is made up by the so-called Dark Matter, whose nature we still don’t know. Only about 4% is made up by the stars in galaxies and 12% by the hot intracluster plasma seen in X-rays. The formation of a galaxy cluster is thus mostly determined by the gravitational dynamics of the dark matter, which forms through gravitational collapse a virialised, nearly spherical symmetric system, which can approximately be described by e.g. a NFW model (Navarro et al., 1995). Galaxies which mostly have been formed before the cluster collapse and the intergalactic medium are collapsing simultaneously with the Dark Matter. While the galaxy population gains a velocity dispersion of the order of 1000 km s-1 in massive systems, the gas heats up to temperatures of several ten Million degrees and forms the intracluster medium (ICM). The ICM emits thermal radiation in the form of soft X-rays, in just the wavelength regime where X-ray telescopes show their best performance. Thus galaxy clusters are very rewarding objects for imaging X-ray astronomy (Sarazin, 1986; Böhringer, 2008).
This fact, that the cluster ICM can be observed with modern X-ray telescopes, makes galaxy clusters unique astrophysical laboratories, where we can study all the “baryonic matter”, in the galaxies and in the ICM simultaneously in detail. In the extracluster space, the intergalactic medium is mostly invisible and we can study it essentially only through absorption effects. A most important finding comparing ICM and galaxies in clusters is the fact that in massive systems we find more mass in heavy elements (metals) in the ICM than in the galaxies. Thus the galaxy cluster laboratories provide us with the unique opportunity to take a full account of all metals produced by stellar nucleosynthesis in a certain, representative volume of the Universe.
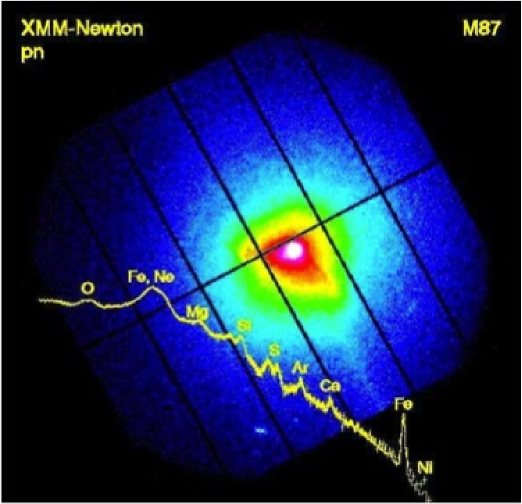
The X-ray emitting ICM which is heated by shocks and compression during cluster formation keeps its heat even over a Hubble time, apart from a small central region in cool core clusters where cooling is more efficient. The observed X-ray emission is therefore that of hot plasma effectively in thermal equilibrium and so far no deviation from thermal equilibrium has been detected. Therefore the X-ray spectrum is readily modeled as explained in the next section. X-ray observatories like ESA’s XMM-Newton and NASA’s Chandra space observatories detect X-ray photons as single events taking a record of the direction and energy of incidence. Therefore the photons can be binned in the form of images as well as into spectra. Fig. 1 shows as an example the X-ray image and spectrum of the central region of the X-ray halo of the giant elliptical galaxy M87 in the center of the Virgo cluster (Böhringer et al., 2001).
2 Analysing X-ray Spectra
The observed X-ray spectra can be interpreted in a straight forward way due to three major facts. As already mentioned the X-ray emitting plasma is, as far as we can tell, in thermal equilibrium. Further the plasma is optically thin, so that practically all the emitted photons in the large cluster volume leave the system without being absorbed or scattered (apart from a few lines in the densest, localized regions in the cluster). Thus no radiation transfer calculations are necessary to understand the observations. And finally the plasma is so thin, that deexciting collisions are negligible. This means that all excited states are relaxed by photon emission and the emitted radiation is determined purely by the collision and excitation rates.
This implies further that all emission processes originate in a collision of an electron and an ion: a close collision leads to free-free radiation, ionizing collisions are followed by recombination radiation, and the activation of excited states is followed by line radiation or a two photon emission continuum in special cases. Knowing all the collision and excitation rates as well as radiation branching ratios one can calculate the emission spectrum, which is essentially a major bookkeeping exercise, accounting for thousands of atomic processes. One more aspect that has to be tracked is the distribution of the ionization stages of each of the considered elements. This is done by considering the detailed balance of ionization and recombination in thermal equilibrium (Mewe et al., 1995; Böhringer & Werner, 2010). The two most popular, publicly available radiation codes used for the calculation of X-ray spectra of thermal equilibrium plasma are MEKAL (Mewe et al., 1995) and APEC (Smith et al., 2001).
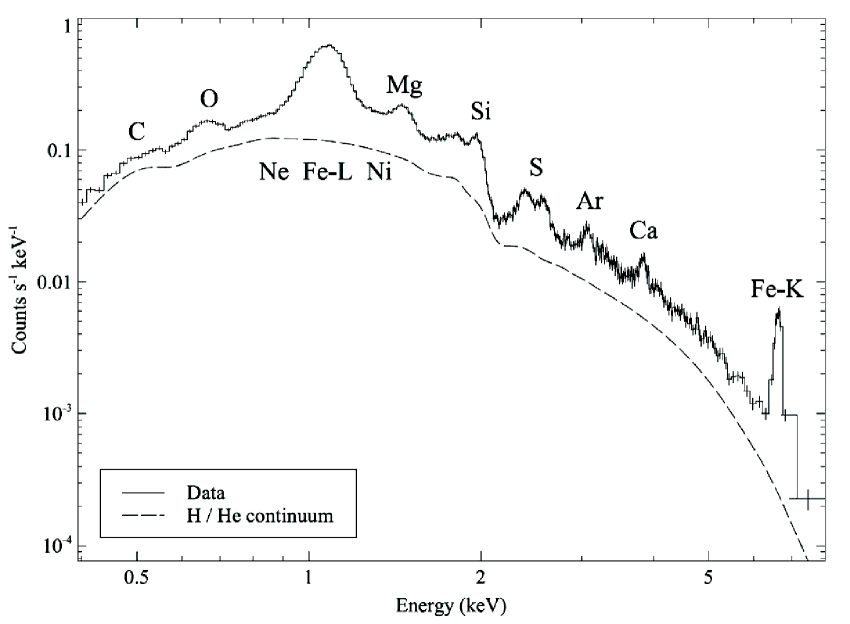
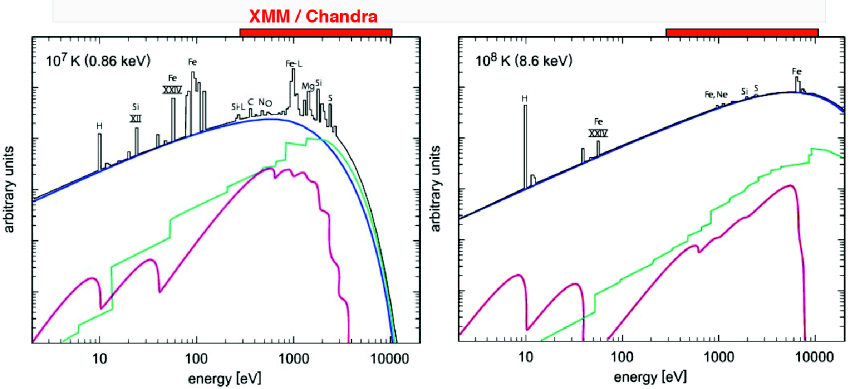
Fig. 2 shows typical X-ray spectra for temperatures of and Kelvin, which bracket the typical range of temperatures of the cluster ICM. At the lower temperature we see more lines from transitions into the K and L shells. At the higher temperature most of the elements have almost completely lost their bound electrons and the spectrum is completely dominated by Bremsstrahlung. The dependence of all emission on collisions of electrons and ions has the simplifying consequence that the normalization of the spectrum depends on the squared plasma density and the form of the spectrum depends on the temperature and the element abundance.
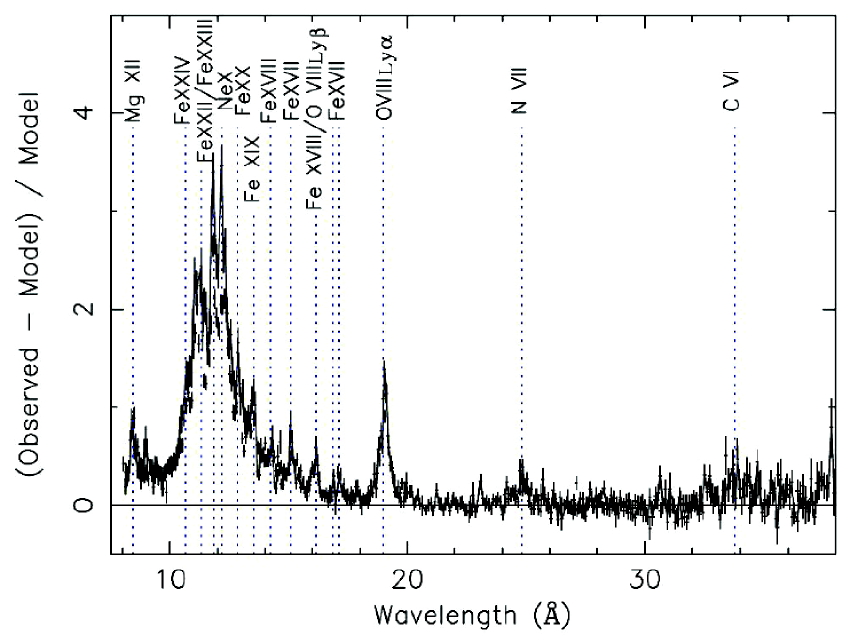
Fig. 3 shows an X-ray spectrum of the cluster ICM of the Centaurus cluster observed with XMM-Newton, where the spectrum is obtained from the energy resolution capability of the X-ray CCD detectors. Fig. 4 shows the XMM-Newton spectrum produced by the reflection grating spectrometer, the XMM-RGS, of the X-ray halo of M87. The grating spectrometer enables us to resolve the large blend of lines in the wavelength region 10 - 17 . Most of the lines come from Fe L-shell electrons but there are also lines of Ne which can only be resolved at this better energy resolution compared to the CCD spectra.
3 Significance and origin of the observed abundances
11 important elements are visible in the X-ray spectra of deeper observations of the cluster ICM. Lines of C and N are only observed in the XMM-Newton RGS spectra, which better cover the lower energies, as can be seen e.g. in Fig. 4. Ne is only separated from the blend of Fe L-shell lines in the RGS. The other elements O, Mg, Si, S, Ar, Ca and Ni are best observed in the CCD spectra of XMM-Newton, Chandra, and Suzaku as shown e.g. in Fig. 3. In addition the detection of Cr and Mn has been reported in the ICM of the Perseus cluster (Tamura et al., 2009). The most prominent lines in the X-ray spectra are generally those of Fe. Therefore if metal abundances are reported in the literature from larger samples of galaxy clusters with not so detailed spectra, these results refer primarily to the iron abundance.
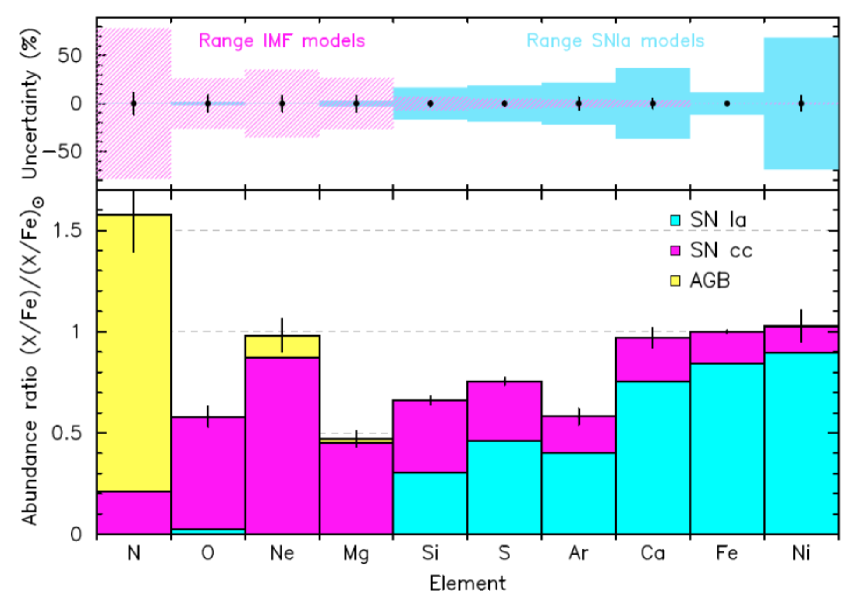
The relative abundance ratio of the elements gives a clue to their origin. The lightest elements, C and N come primarily from winds of asymptotic giant branch (AGB) stars. O and Mg come primarily from core collapse supernovae, while the primary products of supernovae type Ia (thermonuclear explosions of white dwarf stars) are Fe and Ni. The intermediate mass elements Si, S, Ar, Ca are produced by both types of supernovae. The abundance pattern of the elements can thus be used for two types of studies. One can reconstruct what proportion of supernovae of different types is responsible for the production of the elements and one can test if the supernovae models for the production yields of the different elements are consistent with the observations. Fig. 5 illustrates these considerations about the origin of the elements, the observed abundance pattern and also uncertainties of the model predictions of their production (de Plaa, 2013) . There are still substantial uncertainties in the supernova model yields. Therefore the comparison of the observed abundances with the models gives only an approximate answer, and the rough consistency between models and observations depends also on the selected models. A good current account of this situation is given by de Plaa et al. (2007).
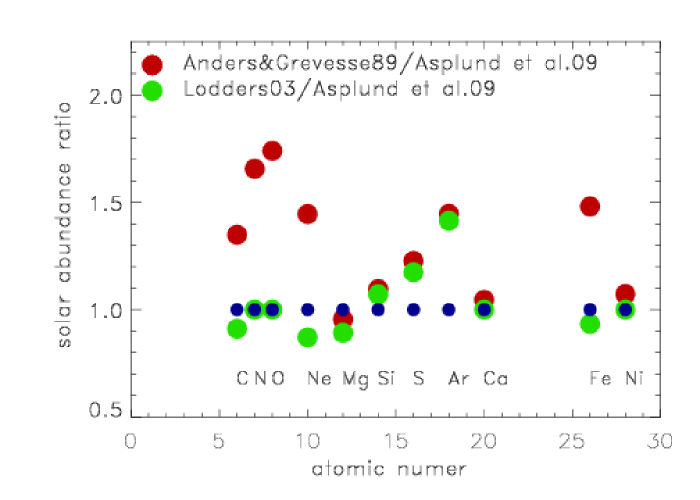
In the literature the abundances of the elements observed in the cluster ICM are usually quoted relative to the solar abundances. This can be the source of some confusion, since different references are used for the solar abundances. Most of the literature is still using the work of Anders & Grevesse (1989) as reference, which has been updated by a number of papers e.g. Lodders (2003) and Asplund et al. (2009). Because this is an important issue for any modeling based on literature data, we show the difference in these most used references in Fig. 6. We note that there are in particular large differences in the very important diagnostic elements O and Fe. It would be very important that the literature converges to a new modern standard.
4 Spatial distribution of the elements

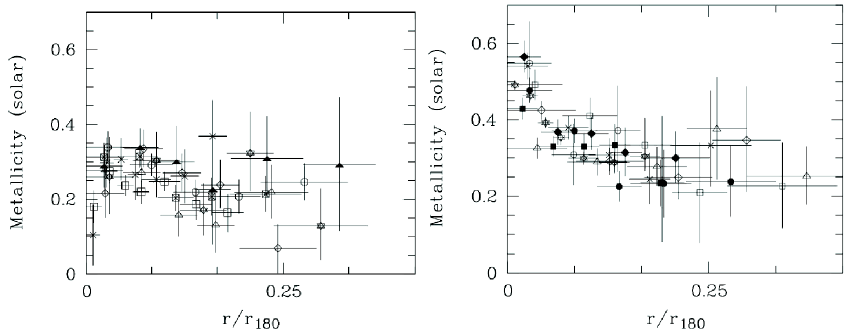
The Japanese satellite observatory ASCA and the Italian/Dutch Beppo-SAX carried the first instruments that allowed an effective simultaneously spatial and spectral resolution of the element lines. Thus mostly through the Fe line the metal abundance could be traced in the ICM e.g. in radial profiles. Two families of abundance profiles were observed. One family showed a strong increase of the metal abundance towards the center and it was found that these profiles belong to the group of cool core clusters. These clusters feature a very dense central region in which the cooling time is smaller than the Hubble time. They also harbour a giant elliptical galaxy in the center, and feedback effects of the power output of the active nucleus of these galaxies prevents a strong, unimpeded cooling of the central ICM. Other clusters with a less dense central region and often with signatures of recent cluster mergers have much shallower abundance profiles as shown in Fig 7 (De Grandi & Molendi, 2001).
The explanation for this difference comes from the fact that the cool core clusters have a giant elliptical galaxy which is approximatly at rest in the center. These galaxies have a rather old stellar population without massive stars in which no supernova of the core collapse type has been observed. But they still produce heavy elements from supernova type Ia, which are rich in iron group elements. With the large stellar mass concentrated at the center, there is a continued enrichment of this region by the central galaxy. The large central excess iron masses observed imply that the center of these cool core clusters must have been quiet and undisturbed to allow this enrichment for almost a whole Hubble time (Böhringer et al., 2004). We also observe that the stellar mass in the central galaxy is much more concentrated than the metal abundance peak, which implies that there are transport processes which redistribute the metals over a larger central region (e.g. De Grandi et al. 2004; Rebusco et al. 2006).
With even more spatially resolved spectral details we can look for abundance variations as a function of the radius. Studies before the launch of Chandra and XMM-Newton remained controversial. The two large X-ray observatories then allowed a major advance. Fig. 8 shows early results for the metal abundance distribution in the X-ray halo of M87 (Matsushita et al., 2003). This central region of the Virgo cluster is by far the closest region where we can study the abundance variations in some detail. The Figure shows the abundance profiles of the elements O, Si, S, Ar, Ca, and Fe. We can easily see that the oxygen profile is flatter than all other profiles. Since O is almost exclusively produced by core collapse supernovae (SN cc), this element gives a hint that SN cc products should be less concentrated in the center. Since Fe on the other hand is produced primarily by supernovae type Ia (SN Ia), which still explode in the old stellar population in the cluster center, is seems obvious that this element traces the late enrichment by SN Ia. The intermediate mass elements of which the best observed is Si, would then be expected to have a profile with a steepness somewhere in between O and Fe. But we see in the figure, that the Si profile is very similar to that of Fe.
This makes the interpretation less straight forward, and has led to a some speculation, e.g. to assume different types of SN Ia contributing to these elements (e.g. (Finoguenov et al., 2002)). We also have to keep in mind that besides the supernovae also stellar winds contribute to the central ICM. While these stellar winds do not in general carry freshly synthezised material, they still contribute to the enrichment of the ICM.
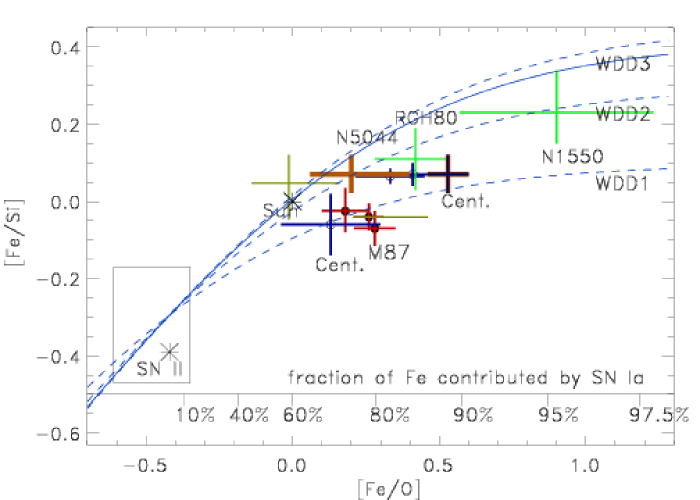
One can further study the possibility of two types of SN Ia contributing to the ICM enrichment with the diagram shown in Fig.9 (Böhringer et al., 2005). Since O is hardly produced by SN Ia, one can start with the Fe/O ratio yields of SN cc and trace the additional contribution of SN Ia to the enrichment by an increasing Fe/O ratio. This parameter is plotted at the X-axis of the Figure. We can do the same for the Fe/Si ratio and plot it on the Y-axis. A certain SN Ia model will then define a curve in the plane in the figure. We have plotted several curves for the classical W7 model (Nomoto et al., 1984) and for different deflagration-detonation models tracing different trajectories in the plot. We also plotted a series of observations for clusters and groups and different radii in the clusters. The central regions and in particular the central regions of groups which are very much dominated by the central elliptical galaxy appear on the right of the plot with the largest relative contribution by SN Ia. The fraction of the Fe mass contributed by SN Ia is labled at the bottom of the plot.
We also note in the figure, that the observed abundance ratios fall in between the classical model W7 and the various DD models. It is still too early to draw a firm conclusion. But there are signs that the old stellar population contributing to the enrichment of the central ICM in cool core clusters has a lower Fe/Si ratio than our Galaxy. This may imply that the SN Ia yields in old stellar populations have a higher Si/Fe ratio than that of younger populations and that there are different types of supernovae of type Ia.
Studies on the change of the ICM metallicity as a function of redshift are still in their infancy and different publications find somewhat different trends. Whereas Balestra et al. (2007) and Maughan et al. (2008) find a clearer trend of a decreasing metallicity with redshift up to and beyond, a recent study by Baldi et al. (2012) which separates the central and the outer regions of the ICM cannot establish a significant abundance evolution. But a decreasing metallicity trend is also seen in their data.
5 Conclusions
The heavy element abundances in the ICM of clusters of galaxies provide a lot of interesting and important information on the history of the nucleosysthesis of these metals, on their sources in the clusters and on the possible transport processes. They also allow us to test the supernova models through their predicted abundance yields. But better observational data are needed. Significant progress can be expected, when the new X-ray calorimeter detectors become available with much better spectral resolution and well resolved lines. The first space mission that can provide this capability is ASTRO-H which will hopefully be launch successfully soon.
Acknowledgements.
I like to thank the organizers of the meeting for an interesting and stimulating conference.References
- Allen et al. (2011) Allen, S.W., Evrard, A.E., Mantz, A.B., 2011, ARA&A, 49, 409
- Anders & Grevesse (1989) Anders, E. & Grevesse, N., 1989, GeCoA, 53, 197
- Asplund et al. (2009) Asplund, M., Grevesse, N., Sauval, A. J., et al. 2009, ARA&A, 47, 481
- Baldi et al. (2012) Baldi, A., Ettori, S., Molendi, S., et al. 2012, A&A, 537, 142
- Balestra et al. (2007) Balestra, I., Tozzi, P., Ettori, S., et al., 2007, A&A, 462, 429
- Böhringer & Hensler (1989) Böhringer, H. & Hensler, G., 1989, A&A, 215, 147
- Böhringer et al. (2001) Böhringer, H., Belsole, E., Kennea, J., et al., 2001 A&A, 365, L181
- Böhringer et al. (2004) Böhringer, H., Matsushita, K., Churazov, E., et al., 2004, A&A, 416, L21
- Böhringer et al. (2005) Böhringer H., Matsushita, K., Finoguenov, A., et al., 2005. AdSpR, 36, 677
- Böhringer (2008) Böhringer, H., in The Universe in X-rays, Trümper, J.E., Hasinger, G., eds., Springer 2008
- Böhringer & Werner (2010) Böhringer, H. & Werner, N., A&AR, 18 127
- Buote et al. (2003) Buote, D.A., Lewis, A.D., Brighenti, F., et al., 2003, ApJ, 595, 151
- Clementini et al. (1999) Clementini, G., Gratton, R.G., Carretta, E., et al., 1999, MNRAS, 302, 22
- De Grandi & Molendi (2001) De Grandi, S. & Molendi, S., 2001, ApJ, 551, 153
- De Grandi et al. (2004) De Grandi, S., Ettori, S., Longhetti, M., et al., 2004, A&A, 419, 7
- de Plaa et al. (2007) de Plaa, J., Werner, N., Bleeker, J.A.M., et al., 2007, A&A, 465, 345
- de Plaa (2013) de Plaa, J., 2013 AN, 334, 416
- Dupke & White (2000) Dupke, R.A. & White, R.E., 2000, ApJ, 528, 139
- Finoguenov et al. (2002) Finoguenov, A., Matsushita, K., Böhringer, H., et al., 2002, A&A, 381, 21
- Iwamoto et al. (1999) Iwamoto, K., Brachwitz, F., Nomoto, K., et al., 1999, ApJ SS, 125, 439
- Lodders (2003) Lodders, K., 2003 ApJ, 591, 1220
- Matsushita et al. (2003) Matsushita, K., Finoguenov, A., Böhringer, H., 2003, A&A, 401, 443
- Matsushita et al. (2007) Matsushita, K., Böhringer, H., Takahashi, I., et al., 2007, A&A, 462, 953
- Maughan et al. (2008) Maughan, B.J., Jones, C., Forman, W., et al., 2008, ApJS, 174, 117
- Mewe et al. (1995) Mewe, R., Kaastra, J.S., Liedahl, D.A., Legacy, 6, 16
- Navarro et al. (1995) Navarro, J.F., Frenk, C.S., White, S.D.M., 1995, MNRAS, 275, 720
- Nomoto et al. (1984) Nomoto, K., Thielemann, F.-K., Yokoi, K., 1984, ApJ, 286, 644
- Rebusco et al. (2006) Rebusco, P., Churazov, E., Böhringer, H., et al., 2006, MNRAS, 372, 1840
- Sanders & Fabian (2006) Sanders, J.S. & Fabian, A.C., 2006, MNRAS, 371, 1483
- Sarazin (1986) Sarazin, C.L., 1986, RvMP, 58, 1
- Smith et al. (2001) Smith, R.K., Brickhouse, N.S., Liedahl, D.A. et al., 2001, ApJ, 556, L91
- Sun et al. (2003) Sun, M., Forman, W., Vikhlinin, A., et al., 2003, ApJ, 598, 250
- Tamura et al. (2004) Tamura, T., Kaastra, J.S., den Herder, J.W.A., et al., 2004, A&A, 420, 135
- Tamura et al. (2009) Tamura, T., Maeda, Y., Mitsuda, K., et al., 2009, ApJ, 705, L62
- Werner et al. (2006) Werner, N., Böhringer, H., Kaastra, J.S., et al., 2006, A&A, 459, 353
- Xue et al. (2004) Xue, Y.-J., Böhringer, H., Matsushita, K, 2004, A&A, 420, 833