NEAR-INFRARED POLARIMETRY OF THE EDGE-ON GALAXY NGC 891
Abstract
The edge-on galaxy NGC 891 was probed using near-infrared (NIR) imaging polarimetry in the -band (1.6 m) with the Mimir instrument on the 1.8 m Perkins Telescope. Polarization was detected with signal-to-noise ratio greater than three out to a surface brightness of 18.8 mag arcsec-2. The unweighted average and dispersion in polarization percentage () across the full disk were 0.7% and 0.3%, respectively, and the same quantities for polarization position angle (P.A.) were 12° and 19°, respectively. At least one polarization null point, where falls nearly to zero, was detected in the NE disk but not the SW disk. Several other asymmetries in between the northern and southern disk were found and may be related to spiral structure. Profiles of and P.A. along the minor axis of NGC 891 suggest a transition from magnetic (B) field tracing dichroic polarization near the disk mid-plane to scattering dominated polarization off the disk mid-plane. A comparison between NIR P.A. and radio (3.6 cm) synchrotron polarization P.A. values revealed similar B-field orientations in the central-northeast region, which suggests that the hot plasma and cold, star-forming interstellar medium may share a common B-field. Disk-perpendicular polarizations previously seen at optical wavelengths are likely caused by scattered light from the bright galaxy center and are unlikely to be tracing poloidal B-fields in the outer disk.
Subject headings:
polarization—infrared: galaxies—galaxies: magnetic fields—galaxies: individual (NGC 891)1. Introduction
Viewed externally and edge-on, how would the magnetic (B) field threading the cold interstellar medium (ISM) of the Milky Way appear? How is the ISM B-field generated and sustained, and what is its relationship to the radio synchrotron traced B-field in the hot plasma? NGC 891 is a bright, nearby ( Mpc, Radburn-Smith et al. 2011), edge-on (, Xilouris et al. 1998; Kregel & van der Kruit 2005), Milky Way analog ideally suited and situated for answering these questions.
Polarization studies and other methods have revealed that B-fields permeate the ISM of the Milky Way and other galaxies (Hiltner 1949a, b; Hall 1949; Beck & Hoernes 1996; Berkhuijsen et al. 1997; Clemens et al. 2013). Radio synchrotron emission is partially linearly polarized, with its sky projected orientation being perpendicular to the B-field in the hot ISM. Thus, synchrotron polarization has been used extensively to study the B-field associated with the hot plasma of external galaxies (Beck et al. 1996). However, long radio wavelengths suffer Faraday rotation and depolarization, and accurately correcting for these is difficult (Sokoloff et al. 1998, 1999). Many edge-on galaxies studied in the radio show a characteristic X-shaped polarization morphology, where the B-field turns from disk-parallel to disk-perpendicular in the outer halo (Golla & Hummel 1994; Krause et al. 2006). Radio studies of NGC 891 have revealed such an X-shape (Sukumar & Allen 1991; Krause 2009).
Background optical and near-infrared (NIR) starlight probes B-fields in the dusty ISM. Radiative torques align aspherical dust grains with the long axis mostly perpendicular to the B-field (Lazarian & Hoang 2007). This net alignment causes dichroic extinction, which linearly polarizes background starlight to exhibit an orientation parallel to the plane-of-sky B-field projection. Dichroic polarization percentage increases with optical depth, though not always linearly (Jones 1989; Jones et al. 1992).
In addition to dichroic polarization, another source of polarization is light singly (and less so, multiply) scattered by dust grains. This light is polarized perpendicular to the plane of scattering and rarely relates to the B-field orientation. Therefore, it is important to distinguish between dichroism and scattering in NIR and optical studies of B-fields to avoid incorrect inferences regarding the B-field morphology and other properties.
Although dust grain scattering cross-sections are inversely proportional to wavelength (Bohren & Huffman 1983), the relationship between scattering polarization percentage and wavelength remains unclear. Sellgren et al. (1992) studied the reflection nebulae NGC 7023 and NGC 2023 and found no significant difference between - and -band polarization percentage. Thus, NIR wavelengths can probe deeper into the disk of NGC 891 than optical wavelengths, but scattering may still be an important component of the light and a possible contaminant in NIR B-field studies.
Modern, high sensitivity, wide-field NIR polarimetry instruments are now able to probe B-fields across entire galaxies (Clemens et al. 2007; Pavel & Clemens 2012). The -band polarization of the central 60 arcsec of NGC 891 was measured by Jones (1997), who found weak polarizations with generally disk-parallel orientation. NIR polarimetry of entire, Milky Way analog disks will provide context for detailed studies of the Milky Way B-field (Mathewson & Ford 1970; Clemens et al. 2012c).
This current study sought to obtain -band observations that are sufficiently sensitive to measure the polarization at arcsecond resolution out to nearly the full extent of the disk of NGC 891. These are the deepest NIR polarization observations of an entire edge-on galaxy to date. The observations revealed about 1% polarization across the entire disk of NGC 891. This value is weaker than the Jones et al. (1992, hereafter JKD) model prediction for NGC 891. Polarization “null points,” where falls nearly to zero, perhaps related to the null points predicted by Wood & Jones (1997) in their model of polarized galaxy light, were detected. However, the observed null points are not located symmetrically about the galaxy center, as was predicted. Therefore, the null points are not due to radiative transfer effects alone but may relate to galaxy structure such as spiral arms.
There is strong polarization for positions well off the disk mid-plane, across the entire extent of NGC 891. This difference between mid-plane and off-plane polarizations might be due to disk starlight scattered by the extraplanar dust known to be present (Howk & Savage 2000).
The new NIR polarimetric observations and the data reduction procedures are described in Section 2. In Section 3, general polarization trends along the major and minor axes of NGC 891 are analyzed, polarization maps are presented, and radio and NIR P.A.s are compared. Section 4 discusses how galaxy structure may influence polarization, compares these observations to polarization radiative transfer models, and compares the NIR and optical polarization properties.
2. Observations and Data Reduction
NGC 891 was observed for -band (1.6 m) linear polarization over 15 nights between 2011 September 19 and October 20, using the Mimir instrument (Clemens et al. 2007) on the Perkins 1.8 m telescope, located outside Flagstaff, AZ. Mimir used an Aladdin III, pixel, InSb array detector, and had an equatorially aligned arcmin field of view (FOV), sampled at 0.58 arcsec per pixel.
NIR linear polarization was measured using a stepping, cold, compound half-wave plate (HWP) and a cold, fixed wire grid. Images were obtained in a six-point hexagonal dither pattern with 15 arcsec separations. At each pointing, 10 sec exposures were obtained for each of 16 unique HWP position angles. Thus, each exposure set consisted of 96 separate images. A total of 47 such sets were collected, for a net exposure time of 12.5 hours covering the entire disk of NGC 891.
The data were processed using the Mimir Software Package Basic Data Processing (MSP-BDP v3.1) and Photo POLarimetry (PPOL v8.0) reduction tools. BDP performed linearity correction, flat-fielding (specific to each HWP angle), dark current correction, and returned science-quality images. These images were processed by PPOL, which performed astrometry, corrected for time-varying sky transmission, combined images taken through the same HWP angles, rejecting bad or missing pixels, corrected for instrumental polarization across the FOV, and, for stellar fields, also performed PSF-assisted aperture photometry (Clemens et al. 2012b).
2.1. Background Removal
PPOL normally removes background sky flux by forming super-sky images, but this method removes some of the object flux for extended objects larger than the 15 arcsec dither steps. Thus, for extended fields, sky correction was done by modeling the background shape across the detector.
A grid of uniformly spaced sample zones (40 pixels) far from the disk of NGC 891 was established for the first, provisional coadded image. The mean background sky brightness within each zone was found for each of the 96 images in an exposure set. Second-order, 2-D polynomials were fit to each image’s grid of average sky brightness values and subtracted from each image prior to stacking, to obtain the background-free surface brightness. This procedure was repeated for all 47 exposure sets.
Low-level, systematic trends remaining along the northern and southern edges of the field of view were also removed. The average sky-brightness in each HWP position angle image was measured in regions far from the galaxy and detector edges. For each row in an image, the difference between the median filtered mean brightness of that row and the 2-D corrected average sky brightness was subtracted from the row.
These background-corrected HWP images were combined into mean images for each of the 16 HWP angles. These were further combined to produce images of Stokes , , and and their respective uncertainties, where and were normalized by the Stokes intensity. Finally, the 47 images of each Stokes value were astrometrically registered and averaged to achieve the highest sensitivity.
2.2. Smoothing and Correction
The averaged, normalized Stokes and and uncertainty images were used to compute , P.A., and images by the formulae
| (1) | ||||
where is defined by the error propagation of and , and P.A. is measured east of north. However, these polarization images exhibited high spatial frequency noise over most of the galaxy. Therefore, the combined and images were weighted by their respective inverse variance images, and the weighted images were convolved with a gaussian kernel. This achieved lower noise, though at the expense of some angular resolution. To prevent a few low variance Stokes values (in high-flux pixels) from dominating weighted means, variances used for weighting were trapped at a lower limit of two standard deviations below the average Stokes variance.
3. Analysis
Polarization percentage and position angle images were examined for significant spatial structure. These characteristics were explored by creating , P.A., polarized intensity (), and intensity profiles along the major and minor axes of NGC 891. Finally, NIR and radio P.A. maps were compared to test the degree to which they probe the same B-field.
3.1. Intensity and Polarization Maps
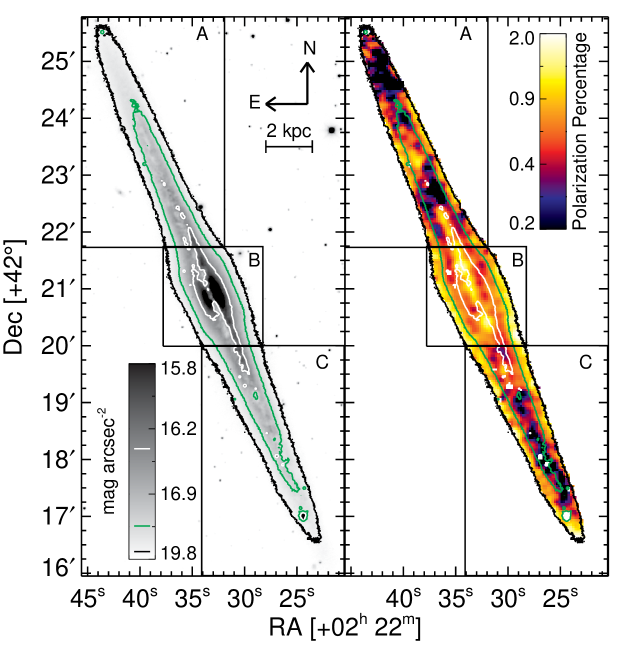
The unsmoothed intensity image, overlaid with surface brightness contours at 18.8 (black), 17.6 (green), and 16.4 mag arcsec-2 (white), is shown in the left panel of Figure 1. Labeled boxes delineate the three distinct galaxy regions analyzed later in this paper: (A) the northeast (NE) disk, (B) the central disk and bulge, and (C) the southwest (SW) disk. The image exhibits stellar point spread functions (PSF) with full width at half maxima (FWHM) of 1.75 arcsec. Surface brightness was calibrated using 2MASS stellar photometry, and a mean background sky brightness of 21.4 mag arcsec-2 was found.
Although mostly symmetric, each surface brightness contour in Figure 1 reveals an asymmetry in the light distribution from NGC 891. The black contour extends 30 arcsec (1.5 kpc) further to the NE than to the SW. The extreme SW end of the green contour reveals a deficit of light from the western side of the major axis, while the white contour in the central bulge reveals more light from the western side of the major axis than from the eastern side. This last asymmetry is caused by the slightly less than 90° inclination and indicates the inclination direction.
The right panel of Figure 1 shows the polarization map overlaid with the same surface brightness contours. This map was generated by smoothing the and images with a 4.5 arcsec FWHM kernel and resampling with 2.4 arcsec pixel spacing prior to forming the image. The dust lane in the central region shows strong , which decreases in strength just above and below the disk mid-plane and returns to further from the mid-plane. Polarization percent outside the central region is generally weak, less than , except in a few locations.
The NE disk shows two regions of very low polarization, here termed inner and outer “null points,” at 42°22′45″ and 42°24′45″ decl. Polarization percentage in the SW disk is weak along the dust lane but strong () far from the disk mid-plane. The strip of low polarization along the SW dust lane begins about 120 arcsec (5.3 kpc) from the galaxy center, which is about the same offset angle as for the NE inner null point.
3.2. Polarization Profiles
Are the null points observed in Figure 1 significant? What are the trends in polarization along the major and minor axes? What unique information is contained in each of the , P.A., , and intensity quantities? These questions were addressed using profiles of these quantities along the major and minor axes.
The major axis of NGC 891 was identified as the ridge of bright 24 m emission observed by the MIPS instrument on the Spitzer Space Telescope (Bendo et al. 2012). When seeking the minor axis, the 24 m image did not show a bright galaxy center, so it was instead astrometrically registered with the Mimir -band image using SAO DS9. The minor axis locus was then defined to be the line perpendicular to the major axis that passed through the brightest location of the -band image. In the following profile analyses, the positive major and minor axis directions were defined to be toward the southwest and northwest, respectively. The major and minor axis positions of all pixels within the -band 18.8 mag arcsec-2 isophot in the unsmoothed images were computed, and the profiles were generated as described below.
The major axis profiles aimed to probe changes in B-field properties rather than effects from scattering. Based upon the minor axis profile discussed below, the mid-plane region appears to be dominated by dichroism, while light far from the mid-plane region is dominated by scattering. Therefore, the major axis pixels between minor axis offsets of arcsec and arcsec, where scattering effects are weakest, were selected for inclusion in the major axis profile. The pixels within this region were grouped into bins 5 arcsec wide along the major axis, and inverse variance weighted and averages and an unweighted intensity average were computed for each bin, along with uncertainties in those means. Mean and values were substituted into Equation 1 to compute a profile, and the profile was computed as the product of the and intensity profiles. All profiles were folded about the minor axis to compare behavior in the north and the south.
For the minor axis profiles, three non-contiguous regions, extending 100 arcsec along the major axis, were defined to distinguish polarization behavior in different parts of the disk. These regions were centered on the galaxy nucleus and at 150 arcsec offsets to the NE and SW, which roughly correspond to the centers of the A, B, and C regions marked in Figure 1.
These profiles aimed to probe variations in the polarization along the minor axis direction. Therefore, pixels inside the northern inner null point, defined to be the region where , were excluded from the weighted means. These pixels constituted as much as of the data in the bins between 2–8 arcsec in the NE disk minor axis profile, so the null point significantly influenced the weighted means at those locations, despite the high variances inside the null point. The remaining pixels within the regions described above were grouped into bins 1.5 arcsec wide along the minor axis. Inverse variance weighted and means and uncertainties in the mean were computed for each bin in each of the three regions. Profiles of and P.A. were computed by substituting mean and values into Equation 1.
3.2.1 Major Axis Profiles
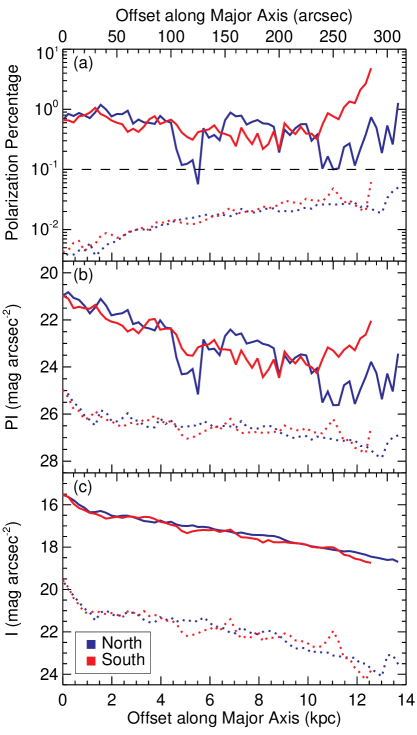
The major axis profiles of , , and intensity are shown in Figure 2. These values were not Ricean corrected. Solid lines represent the averaged quantities while dotted lines represent their internal, statistical uncertainties. A dashed line at in panel (a) marks the systematic, external calibration limit of the Mimir instrument (Clemens et al. 2012b).
The profile, shown in Figure 2.a, is mostly flat as a function of offset, except for the null points in the north, which are offset from the galaxy center by 125 arcsec (5.5 kpc) and 250 arcsec (11 kpc), and for which the values drop from 0.6% to 0.1%. Beyond 280 arcsec (12.4 kpc), returns to 0.50.1%. Weak contamination from systematic edge-effects may exist, so the inner null point represents a more confident detection than the outer null point. There is an exponential rise in in the extreme south, with a slope of 0.4% kpc-1. If this feature is real, then the extreme SE disk is the most polarized part of the galaxy along the major axis.
The intensity profile (Figure 2.c) shows a bright nucleus, beyond which there is an exponential decrease in brightness with a slope of about 0.13 mag arcseckpc-1. The profile (Figure 2.b) also decreases with offset from the galaxy center because of the corresponding decrease in intensity. All sub-kpc scale structure in the profile originates with the profile. Thus, these major axis profiles show that, in the NIR -band, carries no unique information. Furthermore, unlike in the radio, the ratio of and in the NIR is unrelated to magnetic field strength.
3.2.2 Minor Axis Profiles
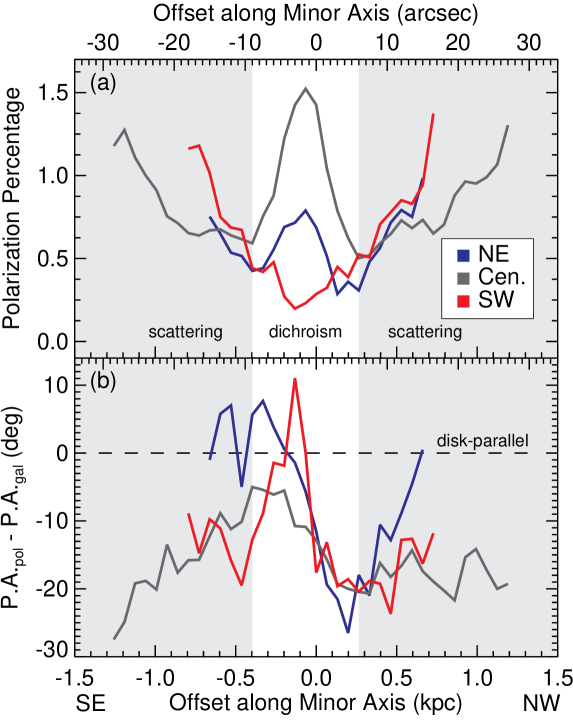
The minor axis and P.A. profiles for the A, B, and C regions are shown in Figure 3. The galaxy major axis P.A. was subtracted from the polarization P.A. values such that a value of zero represents a disk-parallel polarization orientation, while positive difference P.A.s still represent rotations east of the major axis.
The dispersions of normalized and values in the minor axis bins were between 0.005–0.06%, i.e., very small. These dispersions and the roughly 450 independent samples in the minor axis bins lead to internal uncertainties in the mean and P.A. between 0.2–40% and 0.008–0.8°, respectively (smaller than the vertical minor tick mark steps in Figure 3), though the calibration limit of for the Mimir instrument affects external camparisons.
The most prominent features in the Figure 3 profiles are coincident with the dust lane, which lies immediately below the major axis, due to the slightly less than edge-on inclination of NGC 891. In Figure 3.a, the central and NE regions show local maxima at arcsec, while the SW profile shows a local minimum. These features have full-widths of about 10 arcsec (400 pc), which is more than six times greater than the bin width. Far from the disk mid-plane, all three regions show strong increases in with minor axis offset. Those increases show half-width scale heights of 25 arcsec (1.1 kpc) in the NE and SW disk and are wider, 40 arcsec (1.8 kpc), for the central region.
Jones (1997) found that the typical polarization P.A. in the dust lane of the central region was about 20° to the west of the major axis P.A. These new data confirm a similar P.A. offset across most of the central region. Interestingly, all three regions show a shift from roughly disk-parallel P.A. below (SE of) the dust lane to about ° P.A. above (NW of) the dust lane. The P.A. values in the NE return to disk-parallel orientation further from the dust lane while the SW and central region P.A. values at these same locations are typically between ° and °. This is the first time a significant difference between the major axis P.A. and the NIR polarization P.A.s has been measured in the NGC 891 outer disk, far from the bulge.
3.3. Polarizations toward the Disk and Bulge
Where dichroism is the dominant polarizing mechanism, the polarization P.A. reveals the plane-of-sky projection of the B-field threading the cold dust in the disk (Wood 1997). Polarization vector maps were plotted in order to examine the geometry of the B-field. In general, dynamo theory (see review by Ruzmaikin et al. 1988) predicts the B-field in the disk should be predominantly toroidal, producing disk-parallel polarizations. The data presented here for the disk mid-plane of NGC 891 generally agree with these predictions. This result stands in contrast to the optical polarizations for NGC 891, which show a nearly disk-perpendicular orientation across most of the disk (Scarrott & Draper 1996).
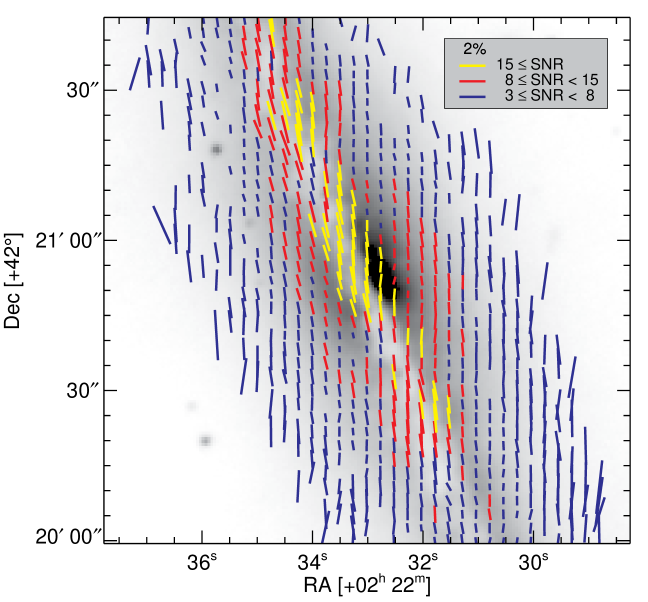
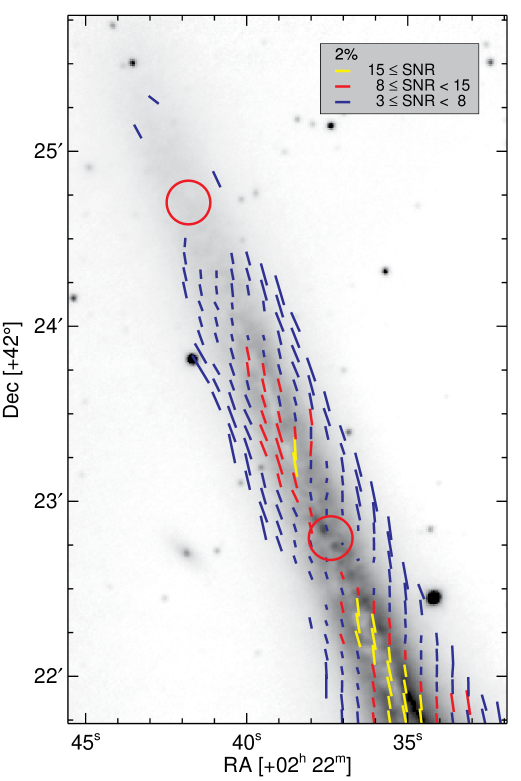
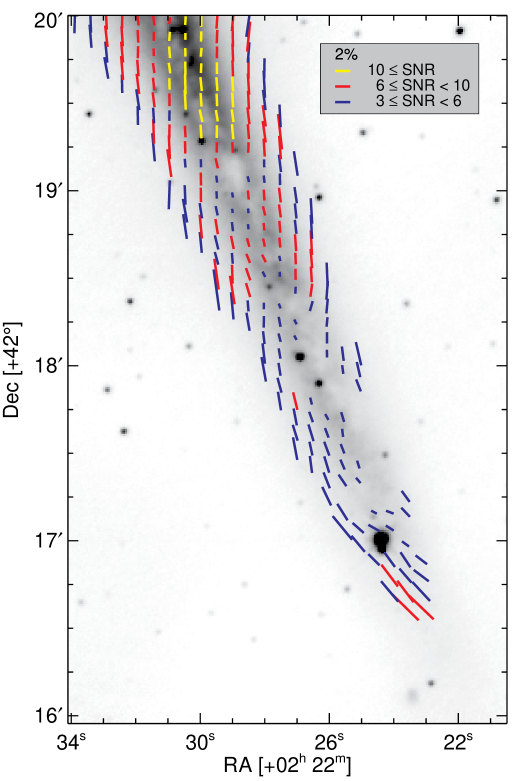
For analysis, NGC 891 was divided into the three regions, labeled A, B, and C in Figure 1. The polarization signal was strongest in the central region B, so 1.7 arcsec FWHM gaussian smoothing could be applied there and still retain high SNR, while a 4.5 arcsec FWHM smoothing was needed for regions A and C. These kernels were applied to form and images which were used to produce and P.A. images, in which values with were masked. The smoothed and images were resampled with 2.7 arcsec pixel spacing to produce and P.A. for region B, and 5.4 arcsec pixel spacing for regions A and C, so that each displayed vector was effectively independent. Polarization vectors corresponding to the resampled pixels were plotted over the -band intensity image and are shown in Figure 4 (region B; central), Figure 5 (region A; NE disk), and Figure 6 (region C; SW disk). Vector lengths and orientations correspond to and P.A., respectively, while colors correspond to SNR, as noted in the legend of each figure. Lower SNR ranges were used in Figure 6 because is weakest in region C.
Jones (1997) argued that his -band polarizations above and below the central disk turned disk-perpendicular to match the poloidal halo B-fields observed in 6.2 cm radio synchrotron by Sukumar & Allen (1991). However, the vectors in Figure 4–6 are generally disk-parallel and have a maximum P.A. uncertainty of only about 10°. Given these low uncertainties, the -band polarizations do not indicate the presence of poloidal fields in any part of the disk or off the disk mid-plane of NGC 891.
Polarizations in the NE disk (Figure 5) are generally more disk-parallel than in the other regions of NGC 891. Few measurements in the far NE disk have because is weak there. However, the polarization in this extreme end of the disk remains disk-parallel.
Scarrott et al. (1990) observed NGC 4565 in the optical and found a transition from disk-parallel to disk-perpendicular polarization located about 75 arcsec (4 kpc) from the nucleus along the major axis. Wood & Jones (1997) reproduced this transition using the Monte-Carlo radiative transfer model developed by Wood (1997). They predicted that the transition would be associated with a polarization null point caused by the cancellation of orthogonal polarizations from bulge light scattered off dust in the disk and dichroic polarization of background disk starlight. They also predicted that the null point transition would appear closer to the nucleus in NIR than in optical.
Figure 2 shows the first detection of any polarization null point in NGC 891 (marked by red circles in the Figure 5 NE disk image). However, there is no corresponding transition from disk-parallel to disk-perpendicular polarizations across the inner null point in Figure 5, as would have been expected if the polarization dip were caused by competition between scattering and dichroism. Therefore, these represent a new class of polarization null points, ones not described by the Wood (1997) model.
Much of the SW disk (Figure 6) continues the 20° westward offset between major axis P.A. and polarization P.A. As seen in Figures 1 and 3.a, is weak through the SW dust lane, which is indicated by the absent or short vectors along the dust lane in Figure 6. In the far SW disk, is strong and the polarization P.A.s are offset from the major axis P.A. in the opposite direction of that seen elsewhere in the galaxy. This indicates that the B-field does not turn poloidal in the outer disk as was concluded by Scarrott & Draper (1996) and Jones (1997).
3.4. Comparison to Radio Data
To date, the relationship between the B-field in the hot plasma and the B-field in the cold ISM of external galaxies has not been observationally constrained. However, comparing the polarization P.A. from synchrotron emission and NIR dichroic polarizations for NGC 891 tests whether there is agreement between these two B-fields.
Magnetic field P.A. values from polarized synchrotron emission at cm from NGC 891 were extracted from Figure 1 of Krause (2009). At this wavelength, Faraday rotation is relatively weak and easily corrected, and the half-power beamwidth (HPBW) of the Effelsberg 100 m telescope, used to collect the cm data, was 84 arcsec. The NIR and images were smoothed with a 4.5 arcsec kernel and resampled with 9.6 arcsec pixel spacing to ensure independence between NIR polarization values prior to comparison with the radio values.
3.4.1 P.A. Distributions
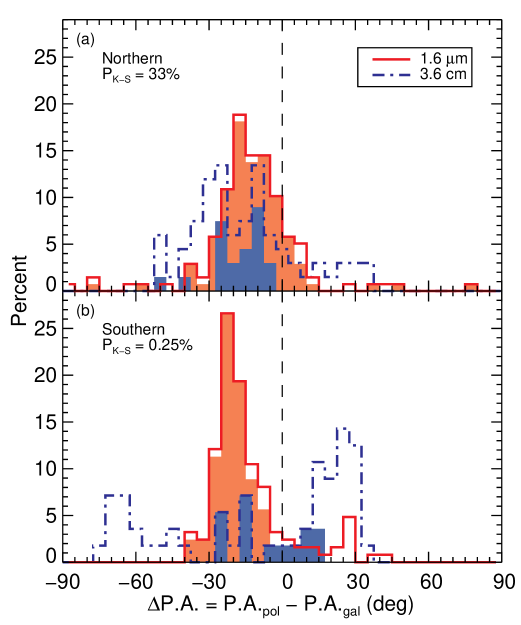
The disk was divided about its minor axis into northern and southern halves, and the galaxy major axis P.A. was subtracted from the NIR and radio polarization P.A. values to form The resulting values were grouped into 5° wide bins, which is the typical uncertainty at 3.6 cm and -band, so each bin should be largely independent. The resulting distributions are shown in Figure 7, where NIR distributions are indicated with solid, red lines and the radio distributions are marked by dot-dashed, blue lines.
In the northern disk (Figure 7.a), the median and dispersion of the NIR values are about and °, respectively. The corresponding median and dispersion of the radio values are about and °. In the southern disk (Figure 7.b), the NIR distribution has median and dispersion values of about and °, while the radio distribution is trimodal, with groups of values at °, °, and °and dispersions of about 15°, 7.5°, and 10°, respectively.
Measurements obtained within the solid angle common to the radio map and the 18.8 mag arcsec-2 -band isophot were selected for detailed comparison via a Kolmogorov-Smirnov (K-S) test. These subsets are shaded in red (NIR) and blue (radio) filled colors in Figure 7. A K-S test comparing the shaded portions of each dataset was performed. It revealed a 33% probability that the northern radio and NIR sets are drawn from the same parent distribution. This K-S probability fell to 0.25% for the radio-NIR comparison in the south. Thus, in the north, the radio and NIR both reveal a common B-field distribution (i.e., different distributions were not confidently detected). This is not the case in the south, where the radio and NIR P.A. distributions are dissimilar at about the level.
3.4.2 Radio-NIR Comparison along Major Axis
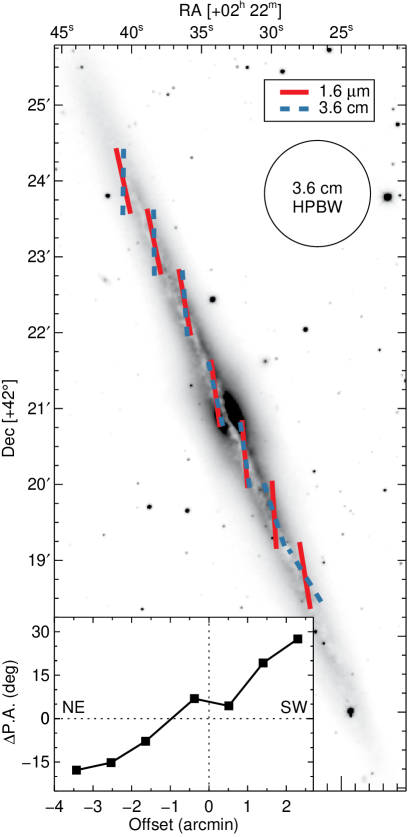
Seven of the Krause (2009) radio P.A. measurements were centered within a few arcseconds of the major axis. Gaussian (84″ FWHM), inverse variance weighted averages of and were computed for all NIR data obtained within the 84″ HPBW radio beams centered on these points. Mean and values were converted to P.A. values using Equation 1. These radio and NIR P.A. values are plotted as colored vectors over the -band intensity image in Figure 8. The inset of that figure shows as a function of offset from the galaxy center along the major axis. The values near the galaxy center are smaller than the values in the outer disk. Furthermore, there is a newly revealed trend of in the north, changing almost linearly to in the south. In general, the radio polarizations in the outer disk of NGC 891 turn upward to create the X-shape morphology while the NIR polarizations do not.
4. Discussion
The new -band polarization data presented in this study reveal generally different P.A.s than seen for optical polarizations (Scarrott & Draper 1996). In addition, the properties of the NIR null point(s) contradict the Wood (1997) polarization model for an edge-on galaxy. What causes these differences? Several observations indicate the presence of extraplanar dust blown off the disk by supernovae and winds (Howk & Savage 2000; Burgdorf et al. 2007; Whaley et al. 2009). Do the distributions of dust and starlight, or the presence of spiral arms, influence the observed polarizations?
The new -band polarization data revealed several north-south (N-S) asymmetries. These include the discovery of polarization null point(s) in the NE disk but not SW disk, strong polarization through the NE and central dust lane but weak polarization in the SW dust lane, disk-parallel P.A.s in the NE but slightly offset P.A.s in the south, and better agreement between NIR and radio P.A. values in the northern disk than in the southern disk.
4.1. Galaxy Structure
4.1.1 Dust and Stellar Distributions
NGC 891 has a significant extraplanar dust component with an estimated vertical scale height of about 2 kpc (Kamphuis et al. 2007; Whaley et al. 2009), while the stellar distribution scale height is 0.35 kpc (Xilouris et al. 1998). Much of this extraplanar dust has visual extinctions of order unity (Howk & Savage 2000, ). The minor axis polarization percentage profile (Figure 3.a) shows a strong increase in polarization strength beginning about 0.35 kpc off the dusty midplane. The relative strength and vertical height at which this polarization trend begins indicate a likely origin in disk starlight scattered by the extraplanar dust and into the line-of-sight. Thus, toward the disk midplane, where there is significant background starlight that can be polarized by dichroism, NIR polarizations likely do trace the B-field. However, far off the mid-plane, where there is little background starlight, polarizations are likely dominated by scattering and do not trace the B-field. The regions where scattering likely dominates the polarization are marked in Figure 3 by gray shading.
4.1.2 Spiral Arms
The N-S asymmetries noted above may be related to spiral arms. Many other N-S asymmetries were previously observed in NGC 891. Xilouris et al. (1998) and Kamphuis et al. (2007) observed asymmetries in the NIR brightness and H light, respectively, and both concluded these indicated the presence of a spiral arm on the near side (relative to the center of NGC 891) of the NE disk. However, similar asymmetries in the H I emission (Swaters et al. 1997) and at other radio wavelengths (Dahlem et al. 1994) suggest that spiral structure and extraplanar dust might not be responsible for the observed asymmetries. If spiral arms influence the observed distribution of light even in edge-on galaxies, where they cannot be directly observed, then the polarization asymmetries—especially the null points— may be similarly related to the influence of spiral arms. Section 4.3 further discusses the possible connection between spiral arms and polarization null points.
4.2. Dynamo and Polarization Models
4.2.1 Dynamo
The new NIR polarization data reported here confirm a significant difference between the galaxy major axis P.A. and the -band polarization P.A., as seen toward the galaxy central region by Jones (1997), across most of the full extent of NGC 891. This P.A. offset is at odds with the predictions of typical dynamo models (Ruzmaikin et al. 1988). Also, the P.A. offset cannot be due to polarization effects within the Milky Way, as the -band foreground extinction to NGC 891 is only 0.029 mag (Schlafly & Finkbeiner 2011). Interestingly, Clemens et al. (2012a) found that the median Galactic Position Angle (GPA) for background starlight polarizations in the Galactic plane is 75°, a 15° offset from the expected disk-parallel GPA of 90°. Thus, it is possible that significant departures from toroidal B-fields are not uncommon.
4.2.2 Polarization and Radiative Transfer
Wood (1997) modeled the expected polarization due to scattering and dichroism for a galaxy with purely toroidal B-fields for several galaxy inclination angles. In his model, light from the bright galaxy center was scattered by dust in the disk to produce disk-perpendicular polarizations throughout the galaxy (Wood 1997, Figure 1) while light from the stellar disk passed through magnetically aligned dust grains to produce disk-parallel polarizations. In the emergent polarization images of the model edge-on galaxies, a symmetric pair of polarization null points appeared in the model disk at the projected offsets from the galaxy center where the orthogonal scattering and dichroic polarizations canceled. The null points were associated with a transition from disk-parallel polarization in the central region to disk-perpendicular polarization further from the bulge.
The data presented in Figure 2 of the present study show at least one highly significant NIR polarization null point, yet the polarization orientation revealed in Figure 5 is disk-parallel on both sides of that null point. This result argues against any transition from dichroic to scattering polarization across this null point.
The Wood (1997) model did not include spiral structure in the distribution of starlight or dust or in the magnetic field geometry. This simple model predicted the occurrence of a symmetric pair of null points in the disk, one on either side of the galaxy center. However, Figure 2 shows that no null points are observed in the SW disk. Rather, there is a continuous strip of low polarization along the SW disk dust lane. Thus, the observed null point(s) are different in nature than those predicted by the Wood (1997) model.
Wood & Jones (1997) specifically modeled the galaxies NGC 4565 and NGC 891 at -band and -band wavelengths, using the Wood (1997) formalism, and they compared the model results to existing polarization observations in these bands. They found that observed polarizations of NGC 891 in both - and -band could not be replicated by their model. They attributed the discrepancies to strong winds dragging the B-field up into the halo, as evidenced by the detection of extraplanar dust blown off the disk (Howk & Savage 1997).
4.2.3 Weak Polarization Percentage
NGC 891 shows particularly weak across its entire disk. The JKD model predicts polarization based on the color of the dust lane of NGC 891. Jones (1997) noted that NGC 4565, another normal edge-on galaxy, shows polarizations much stronger than NGC 891 and in agreement with the JKD model. He suggested two possible explanations. The low might be due to a crossed-polaroid effect from toroidal B-fields in the inner disk and poloidal B-fields in the outer disk. Section 4.4 discusses why this is unlikely. The other Jones (1997) explanation requires tangled B-fields on scales smaller than 100 pc but not on any larger scales. This B-field configuration seems untenable given Figures 4, 5, and 6 here.
A third explanation relates to scattered bulge light. Scattering of bulge light by dust in the disk mid-plane is not the dominant source of polarization along the major axis, although some scattered light ought to be present. This scattered light would be polarized with disk-perpendicular P.A. and could provide a crossed-polaroid effect, which would diminish the net polarization percentage. However, the bulge to disk luminosity ratio of NGC 891 is not particularly high, so it is unclear why this would be the case in this galaxy but not in others. The low for NGC 891 is yet to be successfully explained.
4.3. Polarization Null Points and Spiral Arms
If the polarization null points found here are not caused by the mechanism described by Wood (1997), then what does cause null points, and what influences their locations? Could the null points be related to spiral arms? Fletcher et al. (2011) observed that the radio synchrotron traced B-field is oriented parallel to the spiral arms of M51 (a face-on galaxy). If the B-field in the edge-on NGC 891 is similarly directed along its spiral arms, then for lines-of-sight with significant optical depth inside of a spiral arm, the net plane-of-sky component of the B-field will be small, and the resulting dichroic polarization will be weak. Assuming a smooth exponential distribution of dust in the disk, with a conservative -band optical depth through the galaxy pole, model -band optical depths were estimated. With a nearly edge-on galaxy inclination, unit optical depth at -band corresponds to a path length of 6 kpc through the disk. Thus, depending on the scale lengths of the dust distribution, -band observations may probe deeply enough to reach points where the “magnetic spiral arms” are tangent to the line-of-sight, producing polarization nulls having disk-parallel polarization signatures flanking each null.
4.4. Optical vs. NIR polarization
Scarrott & Draper (1996) interpreted their observed -band, predominantly disk-perpendicular, polarizations as evidence for poloidal B-fields in the outer disk of NGC 891. However, the scattering only, edge-on galaxy in the Wood (1997) models produced disk-perpendicular polarizations (even in the central region, where Scarrott & Draper argued scattering could not be responsible for the observed polarization P.A.). Furthermore, if the Scarrott & Draper disk-perpendicular polarizations were caused by poloidal B-fields in the outer disk, then the -band polarizations presented here for the extreme NE and SW disk should also have been disk-perpendicular, but they are not. Instead, bulge light scattered by the disk dust into the line-of-sight might be the dominant source of optical wavelength polarized light, in which case optical polarization is unlikely to be tracing the B-field of NGC 891.
Pavel & Clemens (2012) found no -band polarization from the face-on galaxy M51. If the lack of polarization was due to insufficient NIR optical depth through the galaxy to produce detectable polarization, then there may be similarly insufficient dichroic optical depth in the visible bands, assuming a normal Serkowski law relationship (Serkowski et al. 1975; Wilking et al. 1982) between polarization and wavelength. If so, the centro-symmetric optical polarizations observed in face-on galaxies (Scarrott et al. 1987; Draper et al. 1992; Scarrott et al. 1993; Scarrott 1996) may also be caused by scattering and not dichroism. This would leave radio as the sole means for probing the B-field of face-on galaxies and weaken the reliability of optical polarizations for probing the B-fields of even edge-on galaxies.
5. Summary
Deep -band imaging polarization observations of the Milky Way analog edge-on galaxy NGC 891 revealed moderately weak () mean polarization, though detected with SNR up to 20. These data were sensitive enough to permit detection of NIR polarization in the disk of NGC 891 out to 14 kpc from its center, which is much further than any previous NIR polarimetric observations. The polarization map revealed at least one polarization null point in the NE disk but none in the SW disk. The northern inner null point does not show the expected transition from disk-parallel to disk-perpendicular polarization with increasing projected central offset (Wood 1997). NIR polarization P.A. for NGC 891 is generally oriented 10° to 20° west of the galaxy major axis P.A., even far from the central bulge. The wide angular extent of these data permitted comparison between NIR and radio synchrotron polarizations. In general, the distribution of radio and NIR P.A. values are more similar in the north than in the south, indicating that radio and NIR are generally probing a common B-field in the north but different B-fields in the south. A trend in along the major axis and several other N-S asymmetries in the polarization may be related to spiral structure in the disk.
Polarization in the dust lane showed several distinct features. Polarization percentage reaches a maximum in the dust lane for the NE disk and central regions but exhibits a minimum in the SW disk dust lane. The P.A. values shift from disk-parallel east of the dust lane to ° (relative to the major axis) west of the dust lane. Polarization percentage increases with distance from the disk mid-plane. This result and the disk-parallel P.A.s above and below the NE disk, may be caused by disk starlight scattered by extraplanar dust.
NIR polarizations exhibit distinctly different orientations than seen at optical wavelengths. There is no disk-perpendicular NIR polarization in the outer disk, as would be expected if poloidal B-fields were present. Rather, there is very weak NIR polarization in the far NE disk, and the polarizations in the far SW disk are even more disk-parallel than elsewhere in the galaxy. It seems likely that the optical polarizations in this galaxy are dominated by scattering and that these new NIR polarization observations (which generally agree with radio synchrotron values) better reveal the magnetic field orientations in the cool ISM of NGC 891.
References
- Beck et al. (1996) Beck, R., Brandenburg, A., Moss, D., Shukurov, A., & Sokoloff, D. 1996, ARA&A, 34, 155
- Beck & Hoernes (1996) Beck, R., & Hoernes, P. 1996, Nature, 379, 47
- Bendo et al. (2012) Bendo, G. J., Galliano, F., & Madden, S. C. 2012, MNRAS, 423, 197
- Berkhuijsen et al. (1997) Berkhuijsen, E. M., Horellou, C., Krause, M., et al. 1997, A&A, 318, 700
- Bohren & Huffman (1983) Bohren, C. F., & Huffman, D. R. 1983, Absorption and scattering of light by small particles (New York: Wiley, 1983)
- Burgdorf et al. (2007) Burgdorf, M., Ashby, M. L. N., & Williams, R. 2007, ApJ, 668, 918
- Clemens et al. (2012a) Clemens, D. P., Pavel, M. D., & Cashman, L. R. 2012a, ApJS, 200, 21
- Clemens et al. (2013) Clemens, D. P., Pavel, M. D., & Cashman, L. R. 2013, AJ, 145, 74
- Clemens et al. (2012b) Clemens, D. P., Pinnick, A. F., & Pavel, M. D. 2012b, ApJS, 200, 20
- Clemens et al. (2012c) Clemens, D. P., Pinnick, A. F., Pavel, M. D., & Taylor, B. W. 2012c, ApJS, 200, 19
- Clemens et al. (2007) Clemens, D. P., Sarcia, D., Grabau, A., et al. 2007, PASP, 119, 1385
- Dahlem et al. (1994) Dahlem, M., Dettmar, R.-J., & Hummel, E. 1994, A&A, 290, 384
- Draper et al. (1992) Draper, P. W., Gledhill, T. M., Scarrott, S. M., & Tadhunter, C. N. 1992, MNRAS, 257, 309
- Fletcher et al. (2011) Fletcher, A., Beck, R., Shukurov, A., Berkhuijsen, E. M., & Horellou, C. 2011, MNRAS, 412, 2396
- Golla & Hummel (1994) Golla, G., & Hummel, E. 1994, A&A, 284, 777
- Hall (1949) Hall, J. S. 1949, Science, 109, 166
- Hiltner (1949a) Hiltner, W. A. 1949a, ApJ, 109, 471
- Hiltner (1949b) —. 1949b, Science, 109, 165
- Howk & Savage (1997) Howk, J. C., & Savage, B. D. 1997, AJ, 114, 2463
- Howk & Savage (2000) —. 2000, AJ, 119, 644
- Jones (1989) Jones, T. J. 1989, ApJ, 346, 728
- Jones (1997) —. 1997, AJ, 114, 1393
- Jones et al. (1992) Jones, T. J., Klebe, D., & Dickey, J. M. 1992, ApJ, 389, 602
- Kamphuis et al. (2007) Kamphuis, P., Holwerda, B. W., Allen, R. J., Peletier, R. F., & van der Kruit, P. C. 2007, A&A, 471, L1
- Krause (2009) Krause, M. 2009, in Revista Mexicana de Astronomia y Astrofisica Conference Series, Vol. 36, Revista Mexicana de Astronomia y Astrofisica Conference Series, 25–29
- Krause et al. (2006) Krause, M., Wielebinski, R., & Dumke, M. 2006, A&A, 448, 133
- Kregel & van der Kruit (2005) Kregel, M., & van der Kruit, P. C. 2005, MNRAS, 358, 481
- Lazarian & Hoang (2007) Lazarian, A., & Hoang, T. 2007, MNRAS, 378, 910
- Mathewson & Ford (1970) Mathewson, D. S., & Ford, V. L. 1970, MmRAS, 74, 139
- Pavel & Clemens (2012) Pavel, M. D., & Clemens, D. P. 2012, ApJ, 761, L28
- Radburn-Smith et al. (2011) Radburn-Smith, D. J., de Jong, R. S., Seth, A. C., et al. 2011, ApJS, 195, 18
- Ruzmaikin et al. (1988) Ruzmaikin, A., Sokolov, D., & Shukurov, A. 1988, Nature, 336, 341
- Scarrott (1996) Scarrott, S. M. 1996, QJRAS, 37, 297
- Scarrott & Draper (1996) Scarrott, S. M., & Draper, P. W. 1996, MNRAS, 278, 519
- Scarrott et al. (1993) Scarrott, S. M., Draper, P. W., Stockdale, D. P., & Wolstencroft, R. D. 1993, MNRAS, 264, L7
- Scarrott et al. (1990) Scarrott, S. M., Rolph, C. D., & Semple, D. P. 1990, in IAU Symposium, Vol. 140, Galactic and Intergalactic Magnetic Fields, ed. R. Beck, R. Wielebinski, & P. P. Kronberg, 245–251
- Scarrott et al. (1987) Scarrott, S. M., Ward-Thompson, D., & Warren-Smith, R. F. 1987, MNRAS, 224, 299
- Schlafly & Finkbeiner (2011) Schlafly, E. F., & Finkbeiner, D. P. 2011, ApJ, 737, 103
- Sellgren et al. (1992) Sellgren, K., Werner, M. W., & Dinerstein, H. L. 1992, ApJ, 400, 238
- Serkowski et al. (1975) Serkowski, K., Mathewson, D. S., & Ford, V. L. 1975, ApJ, 196, 261
- Sokoloff et al. (1998) Sokoloff, D. D., Bykov, A. A., Shukurov, A., et al. 1998, MNRAS, 299, 189
- Sokoloff et al. (1999) —. 1999, MNRAS, 303, 207
- Sukumar & Allen (1991) Sukumar, S., & Allen, R. J. 1991, ApJ, 382, 100
- Swaters et al. (1997) Swaters, R. A., Sancisi, R., & van der Hulst, J. M. 1997, ApJ, 491, 140
- Wardle & Kronberg (1974) Wardle, J. F. C., & Kronberg, P. P. 1974, ApJ, 194, 249
- Whaley et al. (2009) Whaley, C. H., Irwin, J. A., Madden, S. C., Galliano, F., & Bendo, G. J. 2009, MNRAS, 395, 97
- Wilking et al. (1982) Wilking, B. A., Lebofsky, M. J., & Rieke, G. H. 1982, AJ, 87, 695
- Wood (1997) Wood, K. 1997, ApJ, 477, L25
- Wood & Jones (1997) Wood, K., & Jones, T. J. 1997, AJ, 114, 1405
- Xilouris et al. (1998) Xilouris, E. M., Alton, P. B., Davies, J. I., et al. 1998, A&A, 331, 894