Mapping the particle acceleration in the cool core of the galaxy cluster RXJ1720.1+2638
Abstract
We present new deep, high-resolution radio images of the diffuse minihalo in the cool core of the galaxy cluster RX J1720.1+2638. The images have been obtained with the Giant Metrewave Radio Telescope at 317, 617 and 1280 MHz and with the Very Large Array at 1.5, 4.9 and 8.4 GHz, with angular resolutions ranging from to . This represents the best radio spectral and imaging dataset for any minihalo. Most of the radio flux of the minihalo arises from a bright central component with a maximum radius of kpc. A fainter tail of emission extends out from the central component to form a spiral-shaped structure with a length of kpc, seen at frequencies 1.5 GHz and below. We find indication of a possible steepening of the total radio spectrum of the minihalo at high frequencies. Furthermore, a spectral index image shows that the spectrum of the diffuse emission steepens with the increasing distance along the tail. A striking spatial correlation is observed between the minihalo emission and two cold fronts visible in the Chandra X-ray image of this cool core. These cold fronts confine the minihalo, as also seen in numerical simulations of minihalo formation by sloshing-induced turbulence. All these observations favor the hypothesis that the radio emitting electrons in cluster cool cores are produced by turbulent reacceleration.
Subject headings:
galaxies: clusters: general – galaxies: clusters: individual (RXJ1720.1+2638) – galaxies: clusters: intracluster medium – X-rays: galaxies: clusters – radio continuum: general – radio continuum: galaxies1. Introduction
The high-resolution X-ray imaging capabilities of Chandra and XMM-Newton have provided an unprecedent view of galaxy clusters, revealing a wealth of substructure in their cores and surrounding Mpc-scale gaseous atmospheres. In particular, Chandra showed that the low-entropy gas in many, if not most, relaxed cool-core clusters is “sloshing” in the central potential well, generating the ubiquitous sharp, arc-like gas density discontinuities, or “cold fronts,” that are concentric with the cluster center and often form a spiral pattern (e.g., Markevitch et al., 2001; Mazzotta et al., 2001, 2003; Dupke & White, 2003; Markevitch & Vikhlinin, 2007; Owers et al., 2009; Ettori et al., 2013, see, for instance, Ghizzardi et al. 2010 for examples of cold fronts detected with XMM-Newton). Such sloshing motions are believed to result from a recent gravitational perturbation of the cluster central potential in response to collisions with small subclusters, which do not cause significant visible X-ray disturbance outside the core (e.g., Tittley & Henriksen, 2005; Ascasibar & Markevitch, 2006; ZuHone et al., 2011; Roediger et al., 2011). Active galactic nucleus (AGN) explosions in the cluster central galaxy, occurring in an asymmetric gas distribution, may also create a disturbance and set off sloshing of the core gas (Markevitch et al., 2001; Hlavacek-Larrondo et al., 2011).
A number of relaxed, cool-core clusters are hosts to radio “minihalos”, diffuse steep-spectrum111spectral index , for , where is the flux density at the frequency . and low surface brightness radio sources, which enclose – albeit they are not obviously connected to – the radio source associated with the central elliptical galaxy (e.g., Giacintucci et al., 2014, and references therein). Their emission typically fills the cooling region ( kpc) and often appears to be bounded by sloshing cold fronts, suggesting a casual connection between minihalos and gas sloshing (Mazzotta & Giacintucci, 2008; Hlavacek-Larrondo et al., 2013; Giacintucci et al., 2014, S. Giacintucci et al. in preparation, M. Markevitch et al. in preparation). The origin of minihalos in cool-core clusters and their possible connection with the giant radio halos found in merging clusters is still unclear (e.g., Brunetti & Jones, 2014, for a review). One possibility is that sloshing may amplify the magnetic fields and induce turbulence in the cluster cool cores (Fujita et al., 2004; Keshet et al., 2010; ZuHone et al., 2011; Vazza et al., 2012; ZuHone et al., 2013, hereafter Z13). Numerical simulations show that such turbulence is generated mainly in the region enclosed by the cold fronts, with velocities up to km s-1 on scales of tens of kpc, whereas negligible turbulence is driven outside the sloshing region (Z13). Turbulence in the cool core, in turn, may re-accelerate pre-existing, aged relativistic electrons in the intracluster medium (ICM) and, coupled with the amplification of the local magnetic field, generate diffuse radio emission within the cold front envelope with properties similar to the observed minihalos (turbulent reacceleration models, Gitti et al., 2002, Z13).
As an alternative to turbulent reacceleration models, hadronic (or
secondary) models posit that the radio-emitting electrons in minihalos are
continuously injected by interactions between relativistic cosmic ray protons
with the cluster thermal proton
population (Pfrommer
& Enßlin, 2004; Fujita et al., 2007; Keshet
& Loeb, 2010; Keshet, 2010; Fujita
& Ohira, 2012, 2013; Zandanel et al., 2014).
Recent numerical simulations of gas sloshing, modeling the formation of a
minihalo from secondary electrons emitting in the sloshing-amplified
magnetic field, have shown that, in these models, the radio emission
is expected to be less confined within the sloshing region, due to the amplification
of the magnetic field in regions outside the cold fronts (ZuHone et al. 2014).
On average, the radio emission is found to be more extended than in
the turbulent reacceleration simulations, where the turbulence, and thus the
minihalo, are entirely confined to the region bounded by the cold fronts
(Z13).
In this paper, we present a radio/X-ray analysis of the cool-core cluster
RX J1720.1+2638 (hereafter RX J1720.1) at , which is host
to a radio minihalo in its
center. This cluster was the first relaxed system in which sloshing cold
fronts have been revealed by Chandra (Mazzotta et al., 2001) as well
as one of the first two clusters in which a correlation between minihalo and
cold fronts has been reported (Mazzotta
& Giacintucci, 2008). Here, we use
multi-frequency radio observations from the Giant Metrewave Radio Telescope
(GMRT) and Very Large Array (VLA) to study the spectral properties of the
minihalo, which provide important information on the origin of the
radio-emitting electrons, and investigate its connection with the sloshing
cold fronts seen in the Chandra image.
In Table 1, we summarize the general properties of RX J1720.1. We adopt CDM cosmology with H0=70 km s-1 Mpc-1, and .
| Parameter | Value |
|---|---|
| a R.A.J2000 (h m s) | 17 20 09.3 |
| a Decl.J2000 (∘ ′ ′′) | +26 37 38 |
| 0.16 | |
| (Mpc) | 765.4 |
| Linear scale (kpc/′′) | 2.758 |
| b ( erg s-1) | |
| c (keV) | |
| d ( ) |
Notes.
a J2000 X-ray coordinates from Piffaretti et al. (2011).
b keV X-ray luminosity within from Piffaretti et al. (2011), where is the radius corresponding to a total density contrast , being the critical density of the Universe at the cluster redshift.
c Global cluster temperature from Cavagnolo et al. (2009).
d Cluster mass within from Planck collaboration et al. (2013).
| Array | Project | Frequency | Bandwidth | Observation | Time | FWHM, p.a. | rms | range | |
|---|---|---|---|---|---|---|---|---|---|
| (GHz) | (MHz) | date | (min) | (, ∘) | (Jy b-1) | (k) | (′) | ||
| GMRT | 11MOA01 | 0.317 | 12a | 2007 Mar 8 | 220 | , 4 | 210 | 0.15-25.2 | 14 |
| GMRT | 11MOA01 | 0.617 | 11b | 2007 Mar 10 | 250 | , | 28 | 0.22-53.5 | 9 |
| GMRT | 11MOA01 | 1.28 | 21 | 2007 Mar 8 | 320 | , 87 | 45 | 0.41-112 | 5 |
| VLA–BnA | AH988c | 1.42 | 25 | 2009 Jan 26 | 60 | , 87 | 40 | 1.1-80 | 2 |
| VLA–A | AE117 | 1.42 | 50 | 1998 Apr 12 | 20 | , 68 | 20 | 3.3-166 | 0.6 |
| VLA–B | AH190 | 1.48 | 25 | 1985 Apr 25 | 70 | , 68 | 30 | 0.5-52.5 | 4 |
| VLA–A | AF233 | 4.86 | 50 | 1992 Oct 20 | 1 | , 66 | 70 | 16-550 | |
| VLA–B | AH190 | 4.86 | 50 | 1985 Apr 25 | 30 | , 64 | 30 | 2.1-181 | 1 |
| VLA-C | AE125 | 4.86 | 50 | 1999 Jan 16 | 4 | , | 40 | 0.7-53 | |
| VLA-DnC | AH0355 | 8.44 | 50 | 1989 Jun 2 | 3 | , 78 | 35 | 1.2-62 |
Notes. Column 1: radio telescope. Column 2: project code. Columns 3–5: frequency, usable bandwidth after
bandpass calibration, and observation date. Column 6: useful time on source after flagging. Columns 7 and 8: full
width at half-maximum (FWHM) and position angle (PA) of the synthesized beam and rms noise level () in
images made using a uniform weighting scheme (). Columns 9: effective range of the observation.
Column 10: largest angular scale detectable by the array.
a The observation was made using both USB (central frequency 333 MHz) and LSB (central frequency 317 MHz)
with an observing bandwidth of 16 MHz each (before bandpass calibration), but only the LSB dataset was used
for the analysis presented in this paper (see §2.1 for details).
b The observation was made using both USB (central frequency 617 MHz) and LSB (central frequency 602 MHz)
with an observing bandwidth of 16 MHz each (before bandpass calibration), but only the USB dataset was used for
the analysis presented in this paper (see §2.1 for details).
c An image from this observation has been presented by Hess et al. (2012).
d Due to the short duration of this observation, the angular scale that can be imaged reasonably
is much smaller than the nominal of full-synthesis observations in the
same array configuration
( for VLA–A at 4.9 GHz, for VLA–C at 4.9 GHz and for
VLA–DnC at 8.4 GHz; http://science.nrao.edu/facilities/vla/proposing/oss/ossjan09.pdf).
| Radio Source | Size | ||||||||
|---|---|---|---|---|---|---|---|---|---|
| (mJy) | (mJy) | (mJy) | (mJy) | (mJy) | (mJy) | ( W Hz-1) | (kpc) | ||
| point source (BCG) | |||||||||
| head tail | |||||||||
| wide-angle tail |
Notes. Column 1: radio source. Columns 2–7: radio flux densities measured at full resolution (uniform weighting; Table 2). Column 8: total spectral index. Column 9: radio power at 1.48 GHz. Column 10: largest linear size.
a Measured on images obtained using only baselines k.
b From the VLA B-configuration image (Fig. 3b).
c Beam-deconvolved size from a Gaussian fit to the source in the VLA
A-configuration image at 4.9 GHz (Fig. 3a).
d Measured on the 617 MHz image (Fig. 1).

2. Radio observations
We obtained radio observations of RX J1720.1 from the GMRT and VLA archives, covering an interval of almost two orders of magnitude in frequency ( GHz) with data at 6 different frequencies. We summarize these observations in Table 2.
2.1. GMRT observations
RX J1720.1 was observed with the GMRT for a total of about 6 hours at 325 MHz, 7 hours at 610 MHz and 7 hours at 1.28 GHz, including calibration overheads (project 11MOA01; Table 2). The observations were made in spectral-line observing mode, using the GMRT hardware backend. The upper and lower side bands (USB and LSB) were used simultaneously, for a total observing bandwidth of 32 MHz, divided in 256 channels.
We calibrated and reduced these observations using the NRAO222National Radio Astronomy Observatory. Astronomical Image Processing System (AIPS) package, as described in Giacintucci et al. (2008); Giacintucci et al. (2011). We found that all data sets were in part impacted by radio frequency interference (RFI). Therefore, we accurately inspected and edited the data to remove the RFI-affected visibilities, leaving approximately 5 hours of usable time at 325 MHz and 4 hours at 610 MHz and 1.28 GHz each. After the initial amplitude calibration and bandpass calibration obtained using the primary flux density calibrators, we averaged the central channels in the USB and LSB data sets at 325 MHz to 12 channels/band, with each channel MHz wide. At 610 MHz and 1.28 GHz, we averaged each band to 6 channels of 1.75 MHz width each. We then used the phase calibrators to calibrate the data in phase and finally applied a number of phase-only self-calibration cycles and imaging to the target visibilities to correct residual phase errors. We used wide-field imaging in each step of the self-calibration process. The images from the USB and LSB data sets were combined to obtain the final images at each frequency, which were then corrected for the GMRT primary beam response333see http://www.ncra.tifr.res.in:8081/~ngk/primarybeam/beam.html for details on the GMRT primary beam shapes. using PBCOR in AIPS.
Due to residual phase instabilities in the USB data at 325 MHz and LSB data at 610 MHz, the band combination led to images with a quality worse than those obtained from the LSB and USB data sets alone, respectively. We thus used only the LSB data, centered at 317 MHz, and USB data, centered at 617 MHz, for the analysis presented in this paper. Table 2 summarizes the restoring beams and rms noise levels () of the final images obtained with the Briggs “robustness” parameter set to in IMAGR (uniform weighting).
At all frequencies, the sources 3C 147, 3C 286 and 3C 48 were used as flux density calibrators. Their flux density was set using the VLA Perley & Taylor (1999.2) values, adopted as a default in the release 31DEC10 of the task SETJY. Residual amplitude errors are estimated to be within at 610 MHz and 1.28 GHz and at 317 MHz (Chandra et al., 2004).
2.2. VLA observations
RX J1720.1 was observed with the VLA444Old, pre-WIDAR correlator VLA. at 1.4 GHz using the A and BnA configurations for 20 minutes and 1 hour, respectively, and at 1.5 GHz (70 minutes) and 4.86 GHz (30 minutes) in B configuration (Table 2). Much shorter observations (few minutes) were made at 4.86 GHz in A and C configurations and 8.44 GHz in DnC (Table 2).
We calibrated and reduced all data sets in AIPS following standard procedures and applied self-calibration in phase to reduce the effects of residual phase variations in the data and improve the quality of the final images. These were then corrected for the primary beam attenuation of the VLA antenna using the task PBCOR. The rms noise level () achieved in the final images made using the uniform weighting scheme are summarized in Table 2.
At all frequencies, the flux density scale was set using 3C 286 (and 3C 147 in project AH988) and the VLA Perley & Taylor (1999.2) values in SETJY. A conservative estimate of the amplitude calibration errors, based on the residual antenna gains and on the flux density of the primary calibrator, is of the order of % at all frequencies.
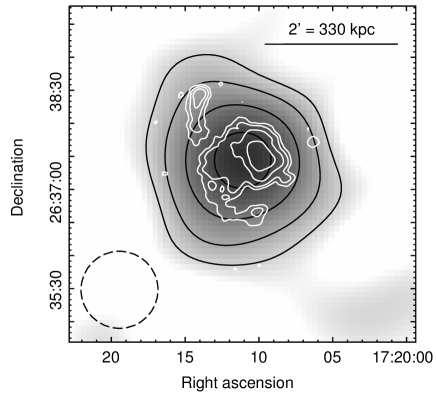
3. The field of RX J1720.1
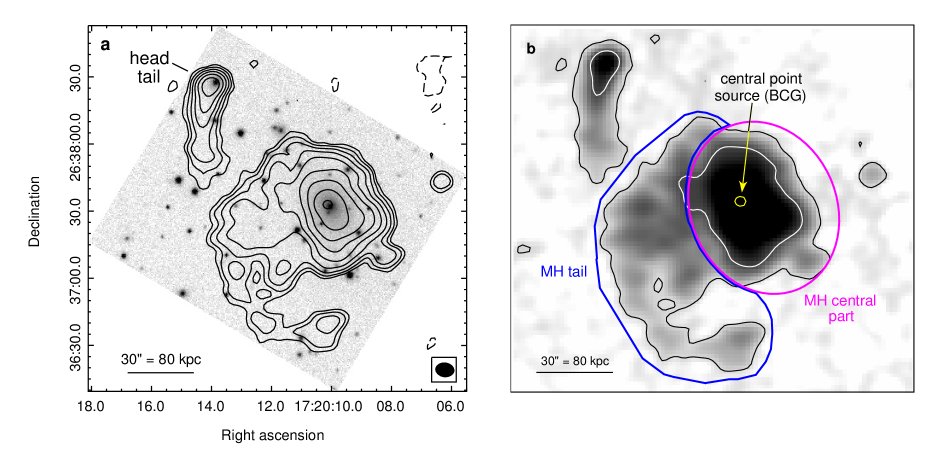
Figure 1 presents a (3 Mpc 2.5 Mpc) region containing RX J1720.1. Black and yellow contours are the GMRT 617 MHz image at a resolution of FWHM and the color image is a wavelet reconstruction of the XMM-Newton X-ray image in the 0.5-2.5 keV band (from ObsIDs 0500670201, 0500670301 and 0500670401). On this large scale, the cluster has a relaxed and regular X-ray morphology with a bright central core.
In the radio, the field is dominated by three extended radio sources – the diffuse minihalo in the cluster core (§4.2), a nearby head-tail source at a projected distance of from the center, and a wide-angle tail at the cluster outskirts. Both tailed sources are associated with cluster member galaxies with coordinates R.A.J2000= 17h 20m 13.9s and Decl. and R.A.J2000= 17h 20m 27.5s and Decl. and redshifts and , respectively (Owers et al. 2011). Their radio properties are summarized in Table 2. Radio luminosity, spectral index and size are within the range of values commonly reported for this type of cluster radio galaxies (e.g., Feretti & Venturi, 2002).
It is worth noticing that wide-angle tails are typically associated with cluster/group central galaxies. This suggests that the wide-angle tail at the periphery of RX J1720.1 may reside at the center of an infalling subcluster. Inspection of the galaxy distribution in Owers et al. (2011) reveals a weak optical peak at the location of the wide-angle tail.
| Minihalo | Size | |||||||||
|---|---|---|---|---|---|---|---|---|---|---|
| region | (mJy) | (mJy) | (mJy) | (mJy) | (mJy) | (mJy) | ( W Hz-1) | (kpc) | ||
| total | ||||||||||
| center | ||||||||||
| tail |
Notes. Column 1: region of the minihalo. Column 2–7: radio flux densities measured from Figs. 2 and 4, using the magenta and
blue regions shown in Fig. 2. Column 8: spectral index between 317 MHz and 4.86 GHz. Column 9: spectral index between 4.86 GHz and 8.44 GHz.
Column 10: radio power at 1.48 GHz. Column 11: linear size (: radius, : length).
a Measured on the 617 MHz image (Fig. 2).
4. Radio emission in the cluster core
In Fig. 2, we zoom on the cluster center, showing a 617 MHz image at the resolution of , obtained using natural weighting () to enhance the extended emission. Panel (a) presents an overaly of the radio contours on the optical r-band SDSS555Sloan Digital Sky Survey. image and panel (b) shows the same radio image as grayscale. The yellow circle indicates the position of a point source, which is coincident with the brightest cluster galaxy (BCG; see §4.1). The surrounding diffuse minihalo is composed by a bright central part (magenta region) and a lower surface brightness, arc-shaped “tail” to the south-east (blue region; §4.2). Also visible in the image is the head-tail radio galaxy.
4.1. The central radio galaxy
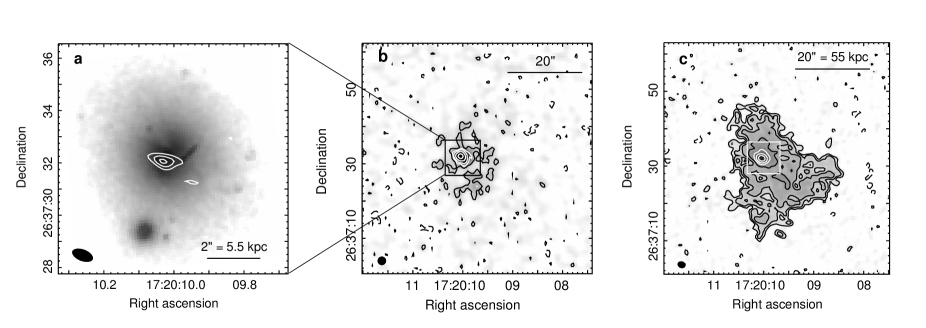
The radio source associated with the BCG (R.A.J2000= 17h 20m 10.0s, Decl.; Owers et al. (2011)) is unresolved in all existing observations of RX J1720.1. The VLA A-configuration data set at 4.86 GHz provides the highest angular resolution radio image ( FWHM), which is presented in Fig. 3(a), overlaid on the optical HST WFPC2666Hubble Space Telescope Wide-Field Planetary Camera 2. image. A single, compact component coincides with the optical peak of the galaxy; its beam-deconvolved size is , which implies a linear size kpc.
In Figs. 3(b) and (c), we present VLA –resolution images at 4.86 GHz and 1.42 GHz of the central kpc2 region of the cluster. In these images, the point source at the BCG (white contours) is enshrouded by the innermost part of the larger-scale minihalo. No obvious extended features connected to the central point source, such as jets or lobes, are visible.
The BCG radio properties are summarized in Table 3. All flux densities were measured on images obtained using the uniform weighting scheme (Table 2) by fitting the source with a Gaussian model (task JMFIT in AIPS). At 317 MHz and 617 MHz, where it is not possible to separate well the point source from the minihalo due to the lower angular resolution, we used images obtained cutting the innermost k region of the plane to suppress the larger-scale emission and image the point source alone.
4.2. The radio minihalo
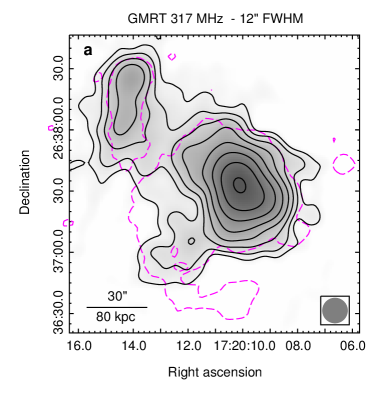
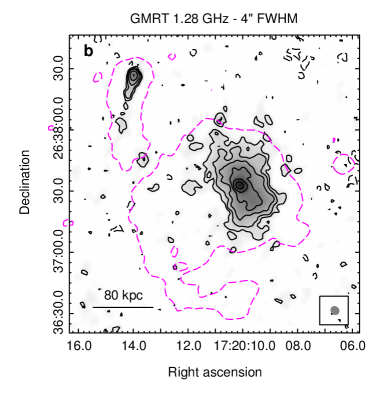
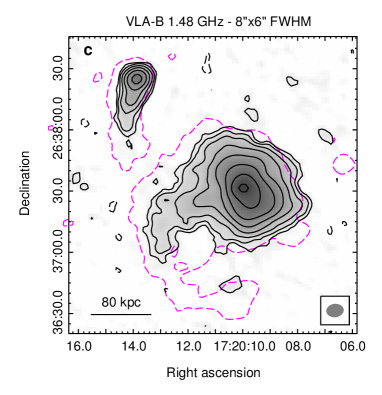
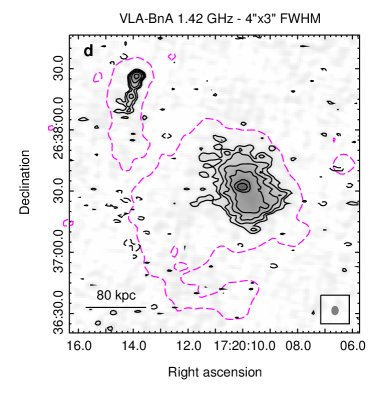
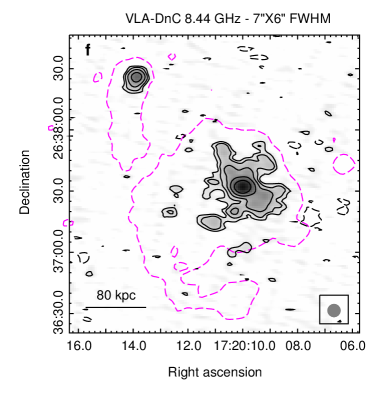
At all frequencies, we made images of the minihalo over a range of resolutions, using different weighting schemes by varying the parameter in IMAGR, to thoroughly check the reliability of the features and the robustness of the flux density measurements. We obtained images ranging from uniform weights () to a scheme close to natural weighting (). To better highlight the diffuse structure, in Fig. 4, present the naturally-weighted images of the minihalo at increasing frequency from 317 MHz (a) to 8.44 GHz (f). The angular resolution of these images – ranging from at 1.28 GHz to at 317 MHz – is slightly lower than that of the corresponding uniformly-weighted images and r.m.s. noise levels are similar (see figure caption and Table 2). For a comparison with the 617 MHz image in Fig. 2(b), in all panels we report the lowest contour at 617 MHz in magenta.
The central part of the minihalo is bright at all frequencies, with a size of ( kpc). The much fainter tail, which is best detected at 617 MHz (Fig. 2), is also visible at 317 MHz (a) and 1.48 GHz (c). Only peaks of its emission are visible at the level in the other panels. Its maximum length is ( kpc) at 617 MHz.
We retrieved an image at 74 MHz from the VLSS-Redux777VLA Low-Frequency Sky Survey Redux (Lane er al. 2012)., which we present in Fig. 5 as grayscale and black contours. The angular resolution of the image is . A bright, marginally extended source with Jy888This value is in the Scaife & Heald (2012) flux density scale. is detected. A comparison with the higher-resolution image at 617 MHz (white contours) indicates that the VLSS-Redux source is a blend of the minihalo and head-tail emissions. After subtraction of the expected flux densities of the BCG and head tail at this frequency ( mJy and mJy, based on the spectral indices in Table 3), a residual flux of Jy is estimated for the minihalo.
In Table 4, we summarize the properties of the minihalo and of its components. The flux densities were measured on Figs. 2 and 4 using the task TVSTAT and the magenta and blue regions shown in Fig. 2. All fluxes are point-source subtracted. The errors on the minihalo flux density were estimated as
| (1) |
which takes into account the uncertainty on the flux density scale (), the image rms level weighted by the number of beams in the minihalo region (), and the uncertainty in the subtraction of the central radio galaxy from the total flux density measured in the image (Cassano et al., 2013). This latter was estimated as
| (2) |
where is the area occupied by the radio galaxy and is the average surface brightness of the minihalo in the proximity of the source.
A proper comparison of the minihalo properties at different frequencies should be based on images obtained selecting the same interval of projected baselines. The minihalo emission spans an area of in diameter, which is sampled by baselines longer than 1 k. As clear from Table 2, all data sets used here have a minimum projected baseline of or shorter, ensuring a proper detection of the entire minihalo emission (but see §5.2 for limitations of the short observations at 4.86 GHz and 8.44 GHz). We thus selected a common range of 1-50 k and made images (using natural weights) at all frequencies to measure the flux densities of the minihalo and of its components and compare them with the values measured on the naturally-weighted images in Fig. 2 (Table 4). All flux densites were found to be consistent within the errors with the values in Table 4. We also measured the minihalo flux density on uniformly-weighted images and found consistent values with those in Table 4 at 317, 617, 1280 and 1480 MHz. For the flux density measurements at 4.86 GHz and 8.44 GHz see section 5.2, where a careful analysis of the possible missing flux is presented.
It is clear that the central part accounts for most of the minihalo flux density at all frequencies, ranging from at 317 MHz to at the highest frequencies. At 8.44 GHz, only an upper limit on the flux density of the tail can be placed; the existing observation lacks both the sensitivity and short-baseline coverage to reliably detect this faint and very extended region of the minihalo (see §5.2).

5. Radio spectral analysis
5.1. Radio spectra of the minihalo and BCG
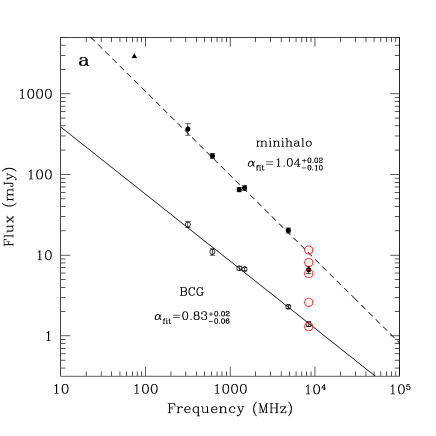
In Fig. 6(a), we show the radio spectra of the BCG (empty circles) and minihalo (filled circles) between 317 MHz and 8.44 GHz, based on the flux densities in Tables 3 and 4.
The BCG spectrum can be fitted by a single power-law model over the entire frequency range, with a slope , typical of an active radio galaxy (e.g., Condon, 1992).
Unlike the BCG, the minihalo spectrum is well described by a single power law (with ) only up to GHz; above this frequency, the spectral index steeepens to . The filled triangle is the 74 MHz flux density measured on the VLSS-Redux image (). Despite the uncertainties in the subtraction of the BCG and head-tail emissions, the 74 MHz estimate appears in reasonable agreement with the higher-frequency data points.
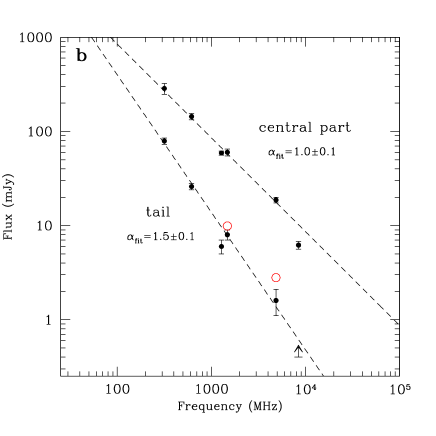
In Fig. 6(b), we show the spectra of the minihalo components. Up to 4.86 GHz, both components have a power-law spectrum with and , respectively. As seen for the entire minihalo, the spectrum of the central part steepens above 5 GHz; a possible steepening is also visible for the tail.
5.2. Minihalo injections and flux density losses at 4.86 GHz and 8.44 GHz
A proper determination of the flux density of an extended and low surface brightness source such as a minihalo requires high sensitivity and good sampling of the short spacings, which provide information on the large angular scales. In the minihalo spectrum in Fig. 6, all data points at GHz derive from deep, pointed observations with good coverage at short baselines and suited to image extended emission on scales (Table 2; to be compared to the angular size of the minihalo, which is in diameter).
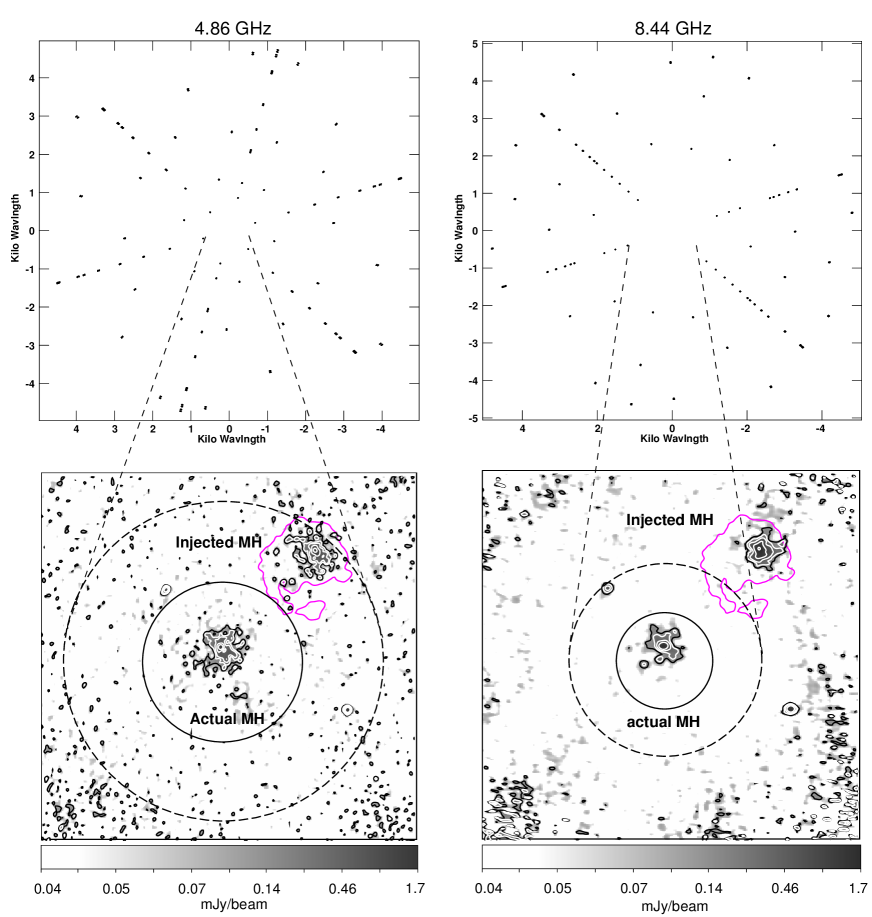
The observations at 4.86 GHz and 8.44 GHz are instead only few minutes long and their coverage is therefore much poorer. In Fig. 7 (upper panels), we show the inner portion of the planes at 4.86 GHz (C configuration) and 8.44 GHz. It is clear that the data sampling is very sparse, especially at 8.44 GHz, resulting into a possible underestimate of the diffuse emission at these frequencies. The maximum angular structure that can be reliably imaged () is also affected by the poorer coverage. VLA full-synthesis observations at 4.9 GHz and 8.4 GHz (in these same configurations) should be able to detect emission on maximum scales of and , respectively (dashed circles in the lower panels of Fig. 7). However, for shorter observations like the ones used in this paper, is considerably smaller, i.e., and respectively999http://science.nrao.edu/facilities/vla/proposing/oss/ossjan09.pdf (solid circles). This implies that, while the 4.86 GHz observation is potentially able to image the whole minihalo, its largest-scale emission – the tail – cannot be fully detected at 8.44 GHz and, therefore, the flux measured for such component at this frequency must be considered as a lower limit (Table 4).
To evaluate possible losses of the minihalo emission at 4.86 GHz and 8.44 GHz, we have adopted a procedure similar to the injection of fake giant radio halos in GMRT data sets by Brunetti et al. (2007), Venturi et al. (2008) and Kale al. (2013). We injected a minihalo model in the data at 4.86 GHz and 8.44 GHz and then imaged both data sets with the same parameters we used to produce the actual-minihalo images in Figs. 4(e) and (f). We then measured the flux densities of the fake minihalos and compared them to the injected ones, obtaining an estimate of the losses.
For their statistical purposes, Kale al. (2013) and previous two works injected an “average” fake radio halo, composed of a set of optically thin concentric spheres with different radius and flux density. For the minihalo, because of its asymmetric morphology, we chose to inject a model based on the observed surface brightness distribution rather than using a set of spheres which would not describe well the spiral-shape structure of the minihalo. Our results will depend on the morphology of the injected minihalo, consequently we used our highest-quality image – the GMRT image at 617 MHz (Fig. 2) – as initial model.
We extracted the CLEAN components of the minihalo from the 617 MHz image and scaled them at 4.86 GHz and 8.44 GHz assuming , which is similar to the spectral index of the minihalo between 317 MHz and 1.4 GHz (Table 4). We then injected the components in the 4.86 GHz and 8.44 GHz data sets using the task UVSUB in AIPS, selecting a region free of sources and as near as possible to the phase center to minimize primary-beam attenuation. We ran a number of injections using different regions; an example is shown in Fig. 7 (lower panels), where we injected a fake minihalo north-west of the actual minihalo. We found a good agreement between the morphology of the injected minihalo and the observed ones. More than of the flux density injected at 4.86 GHz is recovered in the images, indicating that possible flux losses are contained within the errors on the minihalo flux density at this frequency (Table 4). We may expect even higher values of recovered emission, if the minihalo were injected at the phase center (where the actual minihalo is located), where the sensitivity of the observation is the highest.
At 8.44 GHz, we estimated a flux density loss of , thus still within the flux density uncertainty in Table 4. However, the amount of flux density recovered in the area of the fake minihalo will depend on the initial total flux density injected in that region, and thus on the used to scale the 617 MHz flux density to 8.44 GHz. To evaluate this effect, we injected fake minihalos steepening progressively the spectral index from to 1.5 (red empty circles in Fig. 6a). We found that an increasing fraction of the injected flux density is lost when the injected flux decreases, with losses of for , for , for , and exceeding for 1.5.
We also evaluated the fraction of flux density that is lost for the minihalo components individually. The 617 MHz CLEAN components were scaled to the higher frequencies using for the central part and for the tail (Table 4). We found that possible losses at 4.86 GHz are within the flux density uncertainties of and for the central region and tail, respectively (Table 4). At 8.44 GHz, we recovered of the emission of the central part (thus again within the error), but we are not able to recover the tail. This is expected given the coverage limitations at this frequency described above.
As a further test to determine whether the spectrum of the tail is intrinsically steeper than that of the central part (Fig. 6b), or if the observed steepness is affected by flux density losses, we injected the tail in the 1.48 GHz and 4.86 GHz data sets assuming that it has the same as the central part. The empty red circles in Fig. 6b show the flux densities recovered by the imaging at these frequencies. No significant losses are found at 1.48 GHz and less than loss is estimated at 4.86 GHz. This indicates that the observed steepness is not driven by flux losses at these frequencies.
We conclude that the high-frequency steepening observed in the minihalo spectrum (Fig. 6) is most likely real. This is also true for its central part, which dominates the minihalo emission, whereas the steepening in the spectrum of the tail, which does not contribute significantly to the total flux of the minihalo, may be caused by an underestimate of its flux density at 8.44 GHz. However, due to possibly significant flux density losses at 8.44 GHz, we are unable with the current data to determine the actual change of slope at high frequencies.
5.3. Study of the spectral index distribution
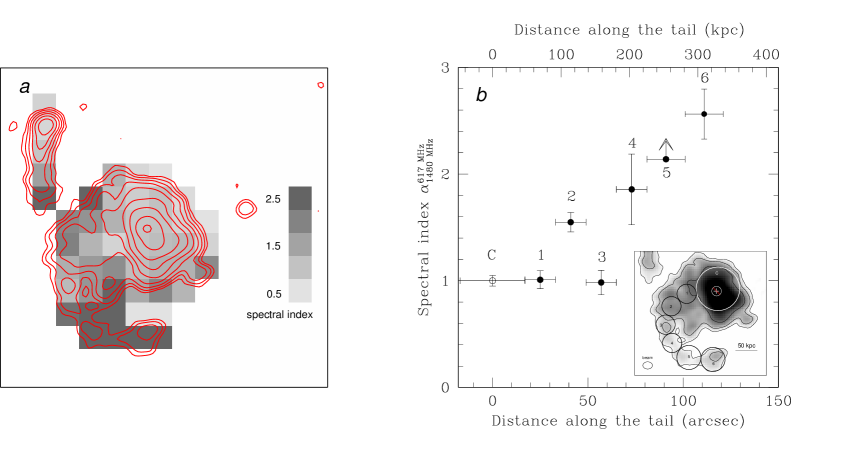
We obtained a spectral index map of the minihalo by comparing a pair of images at 617 MHz and 1.48 GHz. We selected these frequencies because of the similar sensitivity ( Jy beam-1) and coverage of the observations, which ensure a good description of the minihalo flux density and morphology. We produced images at 617 MHz and 1.48 GHz imposing the same range and restoring beam of , and corrected them for the primary-beam attenuation. The two images were then aligned and binned by 8 pixels (). Bins with large uncertainties on the spectral index were blanked. The resulting qualitative spectral index image is shown in Fig. 8(a), with the 617 MHz contours overlaid to provide a reference for the source morphology.
The spectral index distribution in central region of the minihalo is quite uniform with an average , in good agreement with the slope of the total spectrum in this frequency range (Fig. 6(b)). The spectral index of the tail is steeper and it increases systematically from to with increasing distance from the center. To analyzed such trend, we first extracted the flux densities at 617 MHz and 1.48 GHz in circular regions along the tail, as shown by the black circles in the inset of Fig. 8(b), and then computed the corresponding spectral indices. The size of each circle was chosen to be larger than one beam to sample independent regions ( for regions 1 to 4, and for regions 5 and 6). In Fig. 8(b), we show the spectral index as a function of the distance from the cluster center along the minihalo tail. For a comparison, we also report the spectral index of the central region computed in a region, as shown by the white circle in the inset. The profile is consistent with the trend seen in Fig. 8(a); the increase in spectral index is along the 230 kpc-long tail.
Fig. 8(a) also shows the spectral index distribution in the head tail radio source. As commonly observed in this type of radio galaxies, a gradual increase of is visible going from the region of the head, which has the flattest spectral index (), to the end of the tail. Such steepening reflects the progressive aging of the relativistic electrons as they travel away from the core (e.g., Murgia et al., 2010).
6. Discussion
6.1. Physical origin of the minihalo
Radio spectral properties of minihalos — the spectral shape and its spatial variations — provide a discriminator for the physical mechanism responsible for the generation of the radio-emitting relativistic electrons in cluster cores (see Brunetti & Jones 2014 for a review). However, because of the rarity of minihalos and technical difficulty of separating the central bright radio source from an often much fainter extended source that is the minihalo, spectral data on the minihalos are scarce. Until the present work, only three minihalos had known spectra, none of them detailed. Perseus (Sijbring 1993) and Ophiuchus (Murgia et al., 2010) each have measurements at three frequencies, which are consistent with power-law spectra (although there is a hint of a high-frequency steepening in Ophiuchus). The recently discovered minihalo in RX J1532.9+3021 (Hlavacek-Larrondo et al., 2013; Giacintucci et al., 2014) has measurements at four frequencies, which are again consistent with a power law up to 1.4 GHz, while hinting at steepening at higher frequencies (Giacintucci et al., 2014). Spatially resolved measurements of the minihalo spectral slope were reported for Perseus (Sijbring 1993) and Ophiuchus (Murgia et al., 2010), but their quality and spatial coverage at the frequencies used for the spectral index mapping is limited.
In this paper, we presented a new high-sensitivity, well-resolved, multifrequency dataset for the radio minihalo in RXJ1720.1, which makes it the best-studied object of this class. We report the detection of a possible high-frequency break in the spectrum of this minihalo (§5.1), though deeper high-frequency observations are needed to quantify the change of the slope. Furthermore, we detected significant, systematic spatial variations of the minihalo spectrum — the spectral index steepens with the distance from the cluster (and minihalo) center (§5.3).
A high-frequency break in the total spectrum favors a reacceleration scenario over plausible alternatives, such as the pure “secondary” model, in which the radio-emitting relativistic electrons are produced by hadronic collisions and the spectrum of the electrons is expected to be a power law (Pfrommer & Enßlin, 2004). The spectrum of a minihalo powered by turbulence is expected to be a power law with a break or cutoff, which is a consequence of the low efficiency of turbulence as an acceleration mechanism (e.g., Gitti et al., 2002). The balance between the energy gain through reacceleration and the losses (primarily via synchrotron and inverse Compton (iC) radiation) sets a cutoff in the resulting energy distribution of the electrons that, in turn, creates a break in the synchrotron spectrum at a frequency determined by the acceleration efficiency (see, e.g., simulations of this process in a realistic turbulent cluster core by Z13). Our observed spectrum of the RX J1720.1 minihalo exhibits a possible steepening of the spectral index above 5 GHz. We see indication of a high-frequency spectral break in the spectrum of the central part (the dominant contributor to the total flux) and, separately, a hint of steepening in the tail. The significant steepening of the spectral index with increasing distance along the spiral tail (Fig. 9b) further favors a reacceleration scenario, because such strong spectral variations across the minihalo are not expected in the “secondary” model (ZuHone et al. 2014). A similar steepening of the radio spectrum with increased distance from the cluster center has been reported by Murgia et al. (2010) for the Ophiuchus minihalo (although for that cluster, only a fraction of the minihalo was detected at both frequencies that were used for the spectral map). Spatial variations of the spectral slope were also reported for the Perseus minihalo (Sijbring 1993); in fact, spatial variations in Perseus prompted the hypothesis of turbulent reacceleration for the origin of the minihalos (Gitti et al., 2002).
Because of their smaller size, the requirement of in-situ acceleration or injection of the radio-emitting electrons in minihalos is less strict than in giant radio halos. For this reason, here we also discuss the possibility that the observed spectral steepening along the spiral tail (Fig. 8) is simply caused by aging of relativistic electrons that originate in the central region of the minihalo (e.g., in the radio galaxy) and are advected, or diffuse, to its periphery. In this case, steeper spectra seen in Fig. 8 are simply produced by older electrons. To evaluate whether advection is a possibility, we can estimate the age of the relativistic electrons and check what gas velocity is required to transport them to the observed distances. Since we do not know the magnetic field in this cluster, we will use the field strength for which the total synchrotron and iC energy losses are at their minimum, G, where G is the field whose energy density equals that of the Cosmic Microwave Background (CMB). For the fields above or below this value, the age of the electrons would be shorter, so we assume this value for a conservative estimate. Fig. 9(a) shows the minimum advection velocity for this field that would match the observed spectral steepening of the minihalo, as a function of distance along the spiral tail. Here we assume an injection (initial) spectral power-law slope of 1, consistent with the spectrum of the central region of the minihalo. The resulting velocities are several times larger than the typical gas velocities found in numerical simulations of sloshing cores (e.g., Ascasibar & Markevitch 2006; ZuHone et al. 2011, Z13), and higher than even the sound speed. Thus, the advection explanation is not feasible.
Particle diffusion along the magnetic field lines may also play a role. In this case, the maximum age of the relativistic electrons determines the minimum spatial diffusion coefficient along the field lines for GeV particles, , where is the diffusion time and is the diffusion scale. Again, for a conservative estimate, we assume an optimistic picture in which a magnetic field with intensity G (that maximizes the electron lifetime) is mostly aligned along the tail of the minihalo, as seen in MHD simulations of the sloshing cool cores ZuHone et al. (2011). We also assume that there are no significant perturbations or waves on small scales that would reduce the diffusion along the field lines due to scatter of the particle pitch angle. The spatial diffusion coefficient required to explain the observed spectral steepening is shown in Fig. 9(b). The required values are very large — for example, orders of magnitude higher than current estimates for our Galaxy (Berezinskii et al., 1990).
Even in the absence of micro-scale perturbations that could strongly reduce diffusion along the field lines, the field should be advected and perturbed by large-scale gas motions, including turbulence. The required minimum values of derived in Fig. 9(b) place a lower limit on the effective mean-free path of particles and — because particles travel strictly along the field lines — on the minimum coherence (or tangling) scales of the magnetic fields. Using from Fig. 9(b), where is the speed of light, we find kpc, which is in tension with the minimum scales of magnetic field fluctuations observed in similar environments (Kuchar & Enßlin, 2011). Thus, diffusion of relativistic electrons originating in the central region outwards along the field lines seems to be unable to explain the observed spectral behavior in the minihalo tail, although this possibility cannot be firmly ruled out due to our very scarse knowledge of the magnetic field properties and particle/diffusion transport in these environments.

6.2. Minihalo confinement
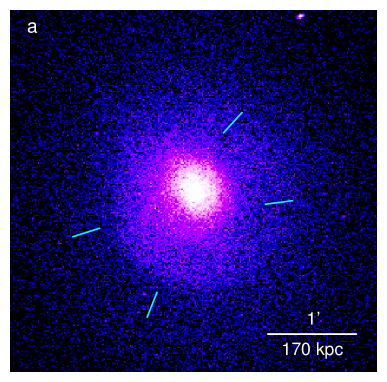
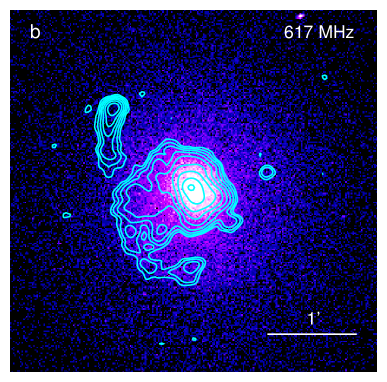
In Fig. 10(a), we show a Chandra X-ray image of RX J1720.1, obtained from the combination of three observations (ObsIDs 1453, 3224 and 4631, for a total clean exposure of 42.5 ks; see Mazzotta & Giacintucci 2008 for details), showing the complex core of this otherwise relaxed cluster (Fig. 1). Two cold fronts, located on the opposite sides from the cluster center, appear to form a spiral structure that is seen in numerous simulations of sloshing of the central low-entropy gas in cluster cores (e.g., Ascasibar & Markevitch 2006, Zuhone et al. 2011). In panel (b), we overlay the 617 MHz radio brightness contours of the minihalo on the same X-ray image. As previously noticed by Mazzotta & Giacintucci (2008), the radio emission appears entirely contained within these cold fronts. The new, higher-sensitivity radio image shows that the minihalo tail is more extended than it was in the earlier data, and traces the SE cold front remarkably well.
In panel (c), we present an overlay of the radio contours on the Chandra projected temperature map, obtained using the observations ObsID 3224 and 4631 (for a total clean exposure of 34.5 ks) following the algorithm described in Bourdin & Mazzotta (2008). Temperature values are derived from spectra from overlapping square bins of varying scales, allowing us to map the temperature variations using a B2-spline wavelet transform. This algorithm has been adapted to the Chandra ACIS-I instrument responses, using the background model of Bartalucci et al. (2014). The wavelet transform has been thresholded at and detects significant features on angular scales . The radio emission correlates well with the cool gas spiral structure seen in the core of RX J1720.1. Panel (d) shows a snapshot from Z13 simulations of a radio minihalo in a relaxed cluster of similar mass, formed by turbulent reacceleration of electrons in a sloshing cool core. The similarity of simulations with the minihalo in RX J1720.1 is striking.
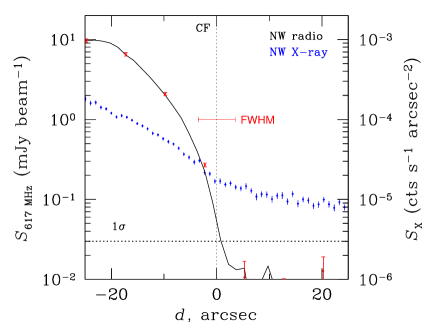
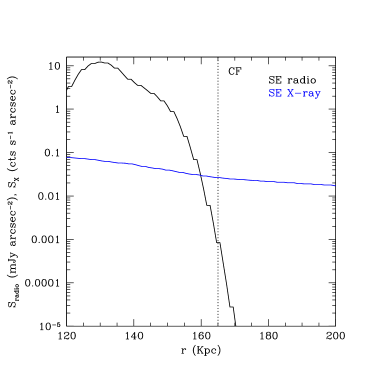
The radial profiles of the radio and X-ray brightness in the upper panels of Fig. 11 show the confinement of the minihalo within the cold fronts more clearly. The profiles were extracted in the NW and SE sectors shown by dashes in Fig. 10(a). The profiles were centered on the center of curvature of the fronts (RA= 17h 20m 10.3s, Dec= for SE and RA=17h 20m 11.6s, Dec= for NW, respectively). The -axis has a zero at the X-ray cold front radii ( and , respectively).
At cold fronts, the X-ray brightness shows the subtle edges typical of sloshing cold fronts. However, the radio profiles show an abrupt drop at those positions — no significant radio emission is seen beyond the fronts, even with the high sensitivity of our data that allows us to detect radio brightness at least two orders of magnitude below the peak of the minihalo. We stress that this behavior of the radio brightness is not an artifact of the radio image reconstruction from the interferometric data, since the largest detectable angular scale at 617 MHz (Table 2) is almost an order of magnitude larger than the size of the minihalo.
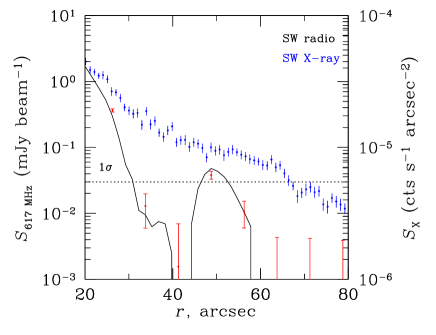
In the middle panels of Fig. 11, we show the radial profiles extracted in 90∘ NE and SW quadrants centered on the cluster X-ray peak, where no X-ray cold fronts are visible. Unlike the smooth X-ray brightness profiles, the radio brightness decreases sharply in those directions as well.
The observed behavior of the radio and X-ray profiles is similar to that seen in simulations that assume the turbulent reacceleration origin of the radio emission, as shown in the lower panels of Fig. 11 (Z13). The radio brightness in the simulated minihalo cuts off exactly at the positions of the X-ray cold fronts. The reason is that turbulence is confined to the volume enclosed by the cold fronts.


6.3. Source of seed relativistic electrons
Minihalos usually surround a compact radio source associated with the central AGN, whose powerful explosions blow the radio bubbles commonly seen filling the cavities in the X-ray gas (e.g., Perseus, Fabian et al. 2011; McNamara & Nulsen 2007 for a review). These AGNs cannot be the primary source of the radio-emitting electrons in minihalos, because the time required for the electrons to spread around the minihalo is too long compared to their radiative cooling time (e.g., Jaffe 1977; see our estimates for diffusion and advection in §6.1 for the minihalo in RXJ1720.1). However, the central AGN can be the source of seed electrons for in-situ reacceleration (e.g., Cassano et al., 2008). Large-scale sloshing motions may disrupt the old radio bubbles inflated by AGN outbursts and redistribute the aging relativistic plasma throughout the core region, where turbulence then picks them up and reaccelerates (e.g., Z13; see also discussion in Giacintucci et al. 2014). As mentioned above, hadronic collisions, which should produce relativistic electrons throughout the cluster volume, may also be the source of seed electrons.
In RX J1720.1, the central radio galaxy is weak ( W Hz-1 at 1.48 GHz) and compact ( kpc). No X-ray cavities are visibile in the cluster core region, consistent with the absence of any radio lobes and jets on the corresponding kpc scales. However, unlike the flat spectra of core-dominated radio galaxies and sources in which the emission is dominated by the beamed radiation of a jet pointing toward us (e.g., Massaro et al., 2013), the spectrum of the RXJ1720.1 radio galaxy is relatively steep () and similar to that of extended, active radio galaxies. This suggests that the AGN is in the active stage and possesses radio jets/lobes, but they are on sub-kpc scales. They could be revealed by radio observations with higher angular resolution. It is possible that the radio galaxy is small because it is young — perhaps it restarted recently after the cessation of the previous cycle of nuclear activity. The ongoing sloshing motion of the gas core may have had enough time to break up the old, faded radio lobes from the past cycles, and spread their relativistic content throughout the sloshing region. Interestingly, Z13, in their simulation of a sloshing core, considered an initial distribution of seed relativistic electrons in the shape of two filled spheres, mimicking two radio bubbles. Sloshing mixed them thoroughly, and the resulting radio map was very similar to that from the alternative model with the initial uniform distribution of the seed electrons — the final distribution of the radio brightness was determined by the locations of the strongest gas turbulence.
7. Summary and conclusions
We presented multi-frequency GMRT and VLA observations of the radio minihalo in the cool core of RX J1720.1, which constitute the most detailed radio dataset for this class of objects to date. The RXJ1720.1 minihalo consists of a bright central region that contains most of its flux density, and a kpc-long, arc-shaped tail of lower surface brightness.
Based on our flux density measurements at six frequencies between 317 MHz and 8.44 GHz, we studied the integrated radio spectrum of the minihalo and its components. We found indication of a possible steepening of the spectrum above 5 GHz. This steepening is seen separately in the spectrum of the central region of the minihalo and possibly in the spectrum of the tail. Deeper, high-frequency observations are necessary to confirm this steepening and quantify the change of the spectral slope. If confirmed, the presence of a break has important implications for the physical mechanism responsible for the radio-emitting relativistic electrons.
The map of the spectral index between 617 MHz and 1.48 GHz shows that the
spectrum steepens systematically with increasing distance from the center,
in particular, along the tail of the minihalo. We have shown that
interpretations of this steepening that involve diffusion or advection of
electrons produced in the central region and their aging along the way
require extreme microphysical conditions or implausible gas velocities.
The proposed mechanisms for the origin of minihalos are turbulent reacceleration
and continuous injection of secondary electrons due to inelastic collisions between
relativistic and thermal protons. The presence of a possible spectral break
and strong spatial variations of the spectral index challenge the “secondary”
origin of the minihalo and favors reacceleration by turbulence. As shown
in MHD simulations (Z13), the
required turbulence can be generated by sloshing of the
low-entropy gas in the cluster cool core. Sloshing also amplifies
the magnetic field in the core, increasing the radio emission from the
cosmic-ray electrons. The turbulence should be limited to the
volume enclosed by cold fronts visible in the X-ray. This scenario produces
a radio minihalo entirely
contained within the sharp boundaries at the positions of cold fronts —
exactly as we observe in RXJ1720.1.
Acknowledgements.
The authors thank the anonymous referee, whose comments and suggestions improved the paper. SG thanks Tracy Clarke for useful discussions. SG acknowledges the support of NASA through Einstein Postdoctoral Fellowship PF0-110071 awarded by the Chandra X-ray Center (CXC), which is operated by SAO. JAZ is supported under the NASA Postdoctoral Program. GMRT is run by the National Centre for Radio Astrophysics of the Tata Institute of Fundamental Research. The National Radio Astronomy Observatory is a facility of the National Science Foundation operated under cooperative agreement by Associated Universities, Inc. The scientific results reported in this article are based on observations made by the Chandra X-ray Observatory.
References
- Ascasibar & Markevitch (2006) Ascasibar, Y., & Markevitch, M. 2006, ApJ, 650, 102
- Bartalucci et al. (2014) Bartalucci, I., Mazzotta, P., Bourdin, H., Vikhlinin, A., 2014, A&A, submitted
- Berezinskii et al. (1990) Berezinskii, V. S., Bulanov, S. V., Dogiel, V. A., & Ptuskin, V. S. 1990, Amsterdam: North-Holland, 1990, edited by Ginzburg, V.L.,
- Böhringer et al. (2000) Böhringer, H., Voges, W., Huchra, J. P., et al. 2000, ApJS, 129, 435
- Bourdin & Mazzotta (2008) Bourdin, H., & Mazzotta, P. 2008, A&A, 479, 307
- Brunetti et al. (2007) Brunetti, G., Venturi, T., Dallacasa, D., et al. 2007, ApJ, 670, L5
- Brunetti & Jones (2014) Brunetti, G., & Jones, T. W. 2014, International Journal of Modern Physics D, 23, 30007
- Cassano et al. (2008) Cassano, R., Gitti, M., & Brunetti, G. 2008, A&A, 486, L31
- Cassano et al. (2013) Cassano, R., Ettori, S., Brunetti, G., et al. 2013, ApJ, 777, 141
- Cavagnolo et al. (2009) Cavagnolo, K. W., Donahue, M., Voit, G. M., & Sun, M. 2009, ApJS, 182, 12
- Chandra et al. (2004) Chandra, P., Ray, A., & Bhatnagar, S. 2004, ApJ, 612, 974
- Condon (1992) Condon, J. J. 1992, ARA&A, 30, 575
- Dupke & White (2003) Dupke, R., & White, R. E., III 2003, ApJ, 583, L13
- Ettori et al. (2013) Ettori, S., Gastaldello, F., Gitti, M., et al. 2013, A&A, 555, A93
- Fabian et al. (2011) Fabian, A. C., Sanders, J. S., Allen, S. W., et al. 2011, MNRAS, 418, 2154
- Feretti & Venturi (2002) Feretti, L., & Venturi, T. 2002, Merging Processes in Galaxy Clusters, 272, 163
- Fujita et al. (2004) Fujita, Y., Matsumoto, T., & Wada, K. 2004, ApJ, 612, L9
- Fujita et al. (2007) Fujita, Y., Kohri, K., Yamazaki, R., & Kino, M. 2007, ApJ, 663, L61
- Fujita & Ohira (2012) Fujita, Y., & Ohira, Y. 2012, ApJ, 746, 53
- Fujita & Ohira (2013) Fujita, Y., & Ohira, Y. 2013, MNRAS, 428, 599
- Ghizzardi et al. (2010) Ghizzardi, S., Rossetti, M., & Molendi, S. 2010, A&A, 516, A32
- Giacintucci et al. (2008) Giacintucci, S., Venturi, T., Macario, G., et al. 2008, A&A, 486, 347
- Giacintucci et al. (2011) Giacintucci, S., O’Sullivan, E., Vrtilek, J., et al. 2011, ApJ, 732, 95
- Giacintucci et al. (2014) Giacintucci, S., Markevitch, M., Venturi, T., et al. 2014, ApJ, 781, 9
- Gitti et al. (2002) Gitti, M., Brunetti, G., & Setti, G. 2002, A&A, 386, 456
- Hess et al. (2012) Hess, K. M., Wilcots, E. M., & Hartwick, V. L. 2012, AJ, 144, 48
- Hlavacek-Larrondo et al. (2011) Hlavacek-Larrondo, J., Fabian, A. C., Sanders, J. S., & Taylor, G. B. 2011, MNRAS, 415, 3520
- Hlavacek-Larrondo et al. (2013) Hlavacek-Larrondo, J., Allen, S. W., Taylor, G. B., et al. 2013, ApJ, 777, 163
- Jaffe (1977) Jaffe, W. J. 1977, ApJ, 212, 1
- Kale al. (2013) Kale, R., Venturi, T., Giacintucci, S., et al. 2013, A&A, 557, A99
- Keshet (2010) Keshet, U. 2010, arXiv:1011.0729
- Keshet & Loeb (2010) Keshet, U., & Loeb, A. 2010, ApJ, 722, 737
- Keshet et al. (2010) Keshet, U., Markevitch, M., Birnboim, Y., & Loeb, A. 2010, ApJ, 719, L74
- Kuchar & Enßlin (2011) Kuchar, P., & Enßlin, T. A. 2011, A&A, 529, A13
- Lane et al. (2012) Lane, W. M., Cotton, W. D., Helmboldt, J. F., & Kassim, N. E. 2012, Radio Science, 47, 0
- Markevitch et al. (2001) Markevitch, M., Vikhlinin, A., & Mazzotta, P. 2001, ApJ, 562, L153
- Markevitch & Vikhlinin (2007) Markevitch, M., & Vikhlinin, A. 2007, Phys. Rep., 443, 1
- Massaro et al. (2013) Massaro, F., Giroletti, M., Paggi, A., et al. 2013, ApJS, 208, 15
- Mazzotta et al. (2001) Mazzotta, P., Markevitch, M., Vikhlinin, A., et al. 2001, ApJ, 555, 205
- Mazzotta et al. (2003) Mazzotta, P., Edge, A. C., & Markevitch, M. 2003, ApJ, 596, 190
- Mazzotta & Giacintucci (2008) Mazzotta, P., & Giacintucci, S. 2008, ApJ, 675, L9
- Mazzotta & Giacintucci (2008) Mazzotta, P., & Giacintucci, S. 2008, ApJ, 675, L9
- McNamara & Nulsen (2007) McNamara, B. R., & Nulsen, P. E. J. 2007, ARA&A, 45, 117
- Murgia et al. (2010) Murgia, M., Eckert, D., Govoni, F., et al. 2010, A&A, 514, A76
- Owers et al. (2009) Owers, M. S., Nulsen, P. E. J., Couch, W. J., & Markevitch, M. 2009, ApJ, 704, 1349
- Owers et al. (2011) Owers, M. S., Nulsen, P. E. J., & Couch, W. J. 2011, ApJ, 741, 122
- Perley & Butler (2013) Perley, R. A., & Butler, B. J. 2013, ApJS, 204, 19
- Pfrommer & Enßlin (2004) Pfrommer, C., & Enßlin, T. A. 2004, A&A, 413, 17
- Piffaretti et al. (2011) Piffaretti, R., Arnaud, M., Pratt, G. W., Pointecouteau, E., & Melin, J.-B. 2011, A&A, 534, A109
- Planck Collaboration et al. (2013) Planck Collaboration, Ade, P. A. R., Aghanim, N., et al. 2013, arXiv:1303.5089
- Roediger et al. (2011) Roediger, E., Brüggen, M., Simionescu, A., et al. 2011, MNRAS, 413, 2057
- Scaife & Heald (2012) Scaife, A. M. M., & Heald, G. H. 2012, MNRAS, 423, L30
- Sijbring (1993) Sijbring L.G., PhD Thesis, University of Groningen, A radio continuum and HI Line study of the Perseus cluster (1993)
- Tittley & Henriksen (2005) Tittley, E. R., & Henriksen, M. 2005, ApJ, 618, 227
- Vazza et al. (2012) Vazza, F., Roediger, E., & Brüggen, M. 2012, A&A, 544, A103
- Venturi et al. (2008) Venturi, T., Giacintucci, S., Dallacasa, D., et al. 2008, A&A, 484, 327
- Zandanel et al. (2014) Zandanel, F., Pfrommer, C., & Prada, F. 2014, MNRAS, 438, 124
- ZuHone et al. (2011) ZuHone, J. A., Markevitch, M., & Lee, D. 2011, ApJ, 743, 16
- ZuHone et al. (2013) ZuHone, J. A., Markevitch, M., Brunetti, G., & Giacintucci, S. 2013, ApJ, 762, 78 (Z13)
- ZuHone et al. (2014) ZuHone, J. A., Brunetti, G., Giacintucci, S., Markevitch, M., 2014, ApJ, submitted, arXiv:1403.6743