Physics of beer tapping
Abstract
The popular bar prank known in colloquial English as beer tapping consists in hitting the top of a beer bottle with a solid object, usually another bottle, to trigger the foaming over of the former within a few seconds. Despite the trick being known for long time, to the best of our knowledge, the phenomenon still lacks scientific explanation. Although it seems natural to think that shock-induced cavitation enhances the diffusion of CO2 from the supersaturated bulk liquid into the bubbles by breaking them up, the subtle mechanism by which this happens remains unknown. Here we show that the overall foaming-over process can be divided into three stages where different physical phenomena take place in different time-scales, namely: bubble-collapse (or cavitation) stage, diffusion-driven stage and buoyancy-driven stage. In the bubble-collapse stage, the impact generates a train of expansion-compression waves in the liquid that leads to the fragmentation of pre-existing gas cavities. Upon bubble fragmentation, the sudden increase of the interface-area-to-volume ratio enhances mass transfer significantly, which makes the bubble volume grow by a large factor until CO2 is locally depleted. At that point buoyancy takes over, making the bubble clouds rise and eventually form buoyant vortex rings whose volume grows fast due to the feedback between the buoyancy-induced rising speed and the advection-enhanced CO2 transport from the bulk liquid to the bubble. The physics behind this explosive process sheds insight into the dynamics of geological phenomena such as limnic eruptions.
Understanding the formation of foam in a supersaturated carbonated liquid after an impact on the container involves a careful physical description of a number of processes of great interest in several areas of Physics and Chemistry. In order of appearance in this problem: propagation of strong pressure waves in bubbly liquids, bubble collapse and fragmentation, gas-liquid diffusive mass transfer and the dynamics of bubble-laden plumes and vortex rings. All these phenomena are observed, for instance, in the explosive formation of foam occurring in a beer bottle when it is tapped on its mouth, an effect known as beer tapping. In this letter, we will use this effect as a convenient system to quantitatively describe the interaction between the processes mentioned above that ultimately leads to the explosive formation of foam that occurs in gas-driven eruptions ZhangKlingAREPS2006 . As a consequence of the broad range of phenomena taking part in the overall process, the better understanding of the foam forming process in supersaturated liquids finds application in various fields of natural sciences and technology where similar gas-driven eruptions occur. The dynamics of limnic ZhangKlingAREPS2006 ; ZhangNature1996 or explosive volcanic CashmanSparksGSAB2013 ; Magan_etalJVGR2004 eruptions and the formation of flavour-releasing aerosols by bursting Champagne bubbles LigerBelair_etalPNAS2009 are just a few examples. Mott and Woods MottWoodsJVGR2010 have triggered a chain reaction in a stably-stratified tank containing a deep layer of CO2-saturated lemonade and a shallower layer of fresh water by spilling a gravity current of salt grains along the bottom of the tank. This example shows that the dynamics of CO2 bubbles in daily-life liquids can be used to explain complex natural phenomena such as limnic eruptions.
To understand how the processes described above interact to lead to the foaming-up of beer, we have carried out an experimental investigation impacting commercial beer bottles under well-controlled repeatable conditions (see Supplementary Material). In particular, bubbles have been generated at a fixed location far from the bottle walls by focusing a laser pulse into the bulk liquid. In this way, we avoid the variability in the formation of bubbles upon the impact caused by the arbitrary distribution of nucleation sites Brennen1995 , thus ensuring that a bubble with a known initial size is always present in the measurement volume. By recording the evolution of these gas bubbles with a high-speed camera and the liquid pressure temporal evolution with a hydrophone we provide qualitative and quantitative analyses of the various processes that develop during the foam formation. Thus, we divide the overall foaming-over process into well-differentiated stages controlled by different physical mechanisms. More importantly, we show experimental evidence supporting the explanation given for each step of the outgassing process.
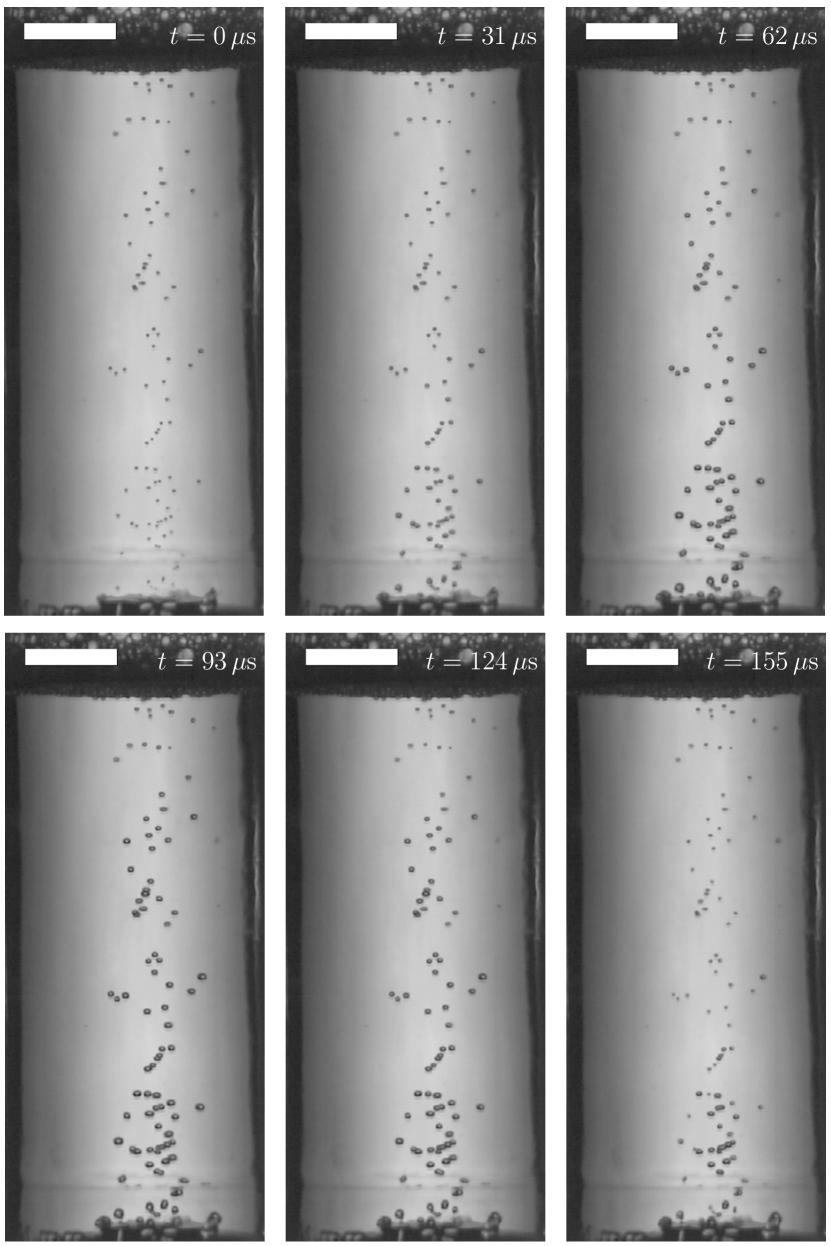
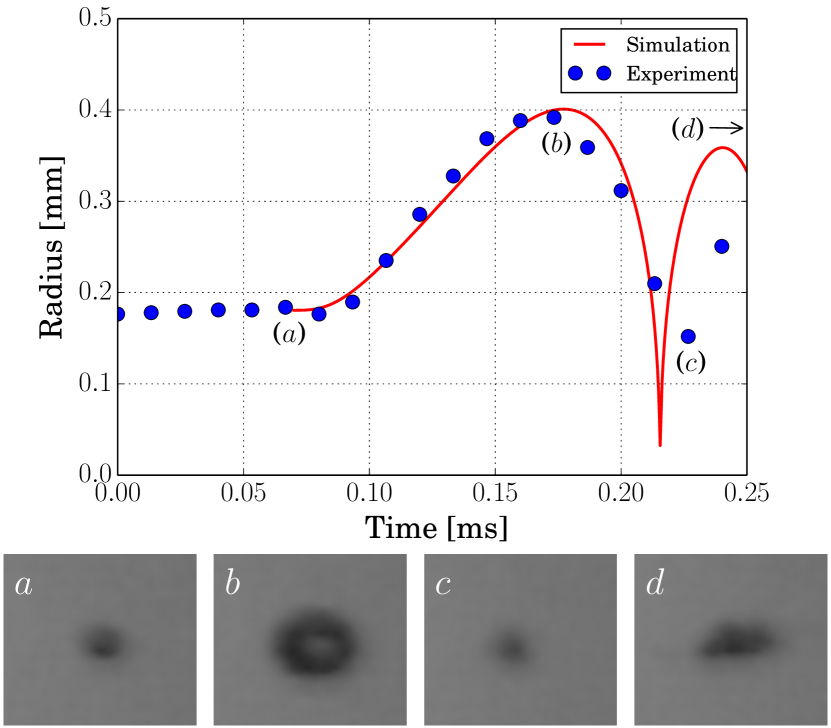
The chain of events that ultimately leads to the foaming-up of beer is triggered by a sudden impact on the top of the bottle, which generates a compression wave that propagates through the glass towards the bottom as predicted by the classical theory of impact on solids Goldsmith2001 . When the wave reaches the base of the bottle, it is partially transmitted to the liquid as an expansion wave that travels towards the free surface, where it bounces back as a compression wave. A simple model for the impact problem Goldsmith2001 implies that the stiffer the bottle, the more efficient is the transmission of the expansion wave to the liquid. Thus, the shock is more efficiently transmitted into the liquid in the case of a glass container than in a softer bottle (e.g. plastic), although the expansion wave is still generated, albeit its smaller amplitude. The train of waves transmitted to the liquid bounce back and forth several times until it damps out. Figure 1 shows snapshots of the first instants after the impact to illustrate the effects of the first expansion-compression cycle. It can be seen how bubbles start to expand first near the bottom whereas, at approximately , those located near the free surface begin to shrink. The train of rarefaction-compression waves drives the fragmentation of most of the existing gas pockets during the first wave cycles. Figure 2 illustrates a typical time evolution of the bubble radius measured in our experiments along with snapshots showing the bubble at different relevant instants of the expansion-collapse process (see also Movies S1 and S2 in Supplementary Material). This first stage of the overall foaming-up process lasts of the order of the acoustic time of the liquid volume, usually , assuming a typical liquid height and a speed of sound around . Notice that, since waves propagating in bubbly liquids are strongly damped, the intensity of successive rebounded waves decays rapidly thus they are less likely to cause bubble collapse.
Similarly to what happens in the generation of medical ultrasound contrast agents through sonication (ref. Feinstein_etalJACC1984 ) or, albeit in a more violent way, in sonoluminescence Brenner_etalRMP2002 , it seems reasonable to attribute the break-up of the bubbles to a Rayleigh-Taylor instability Brenner_etalRMP2002 . The number of fragments, , resulting upon the break up of a bubble cannot be measured due to the high void fraction of the resulting bubble cloud (Fig. 2d). Instead, an estimation of this number is obtained using the model of Brennen BrennenJFM2002 , based on the ideas put forward by several authors ProsperettiSeminaraPoF1978 ; Ioss_etalPoF1989 . Following this model (see Supplementary Material), the most unstable mode is given by
| (1) |
with , evaluated at the instant when the radius, , is minimum, the fluid density and the liquid-gas surface tension. The size of the fragments is expected to be of the order of , thus the number of fragments generated is . For the typical bubble sizes and pressure wave amplitudes used in these experiments, we find a most unstable mode of the order of and a number of fragments .
As a consequence of the fast bubble collapse and break-up, right after the implosion the total gas-liquid interfacial area increases by a factor of the order of . This sudden increase of the interfacial area leads to a second stage where the clouds of bubble fragments grow rapidly as a result of the diffusion of carbonic gas into the newly created cavities. This stage can be modelled using the classical theory of bubble growth in supersaturated media (Ref. EpsteinPlessetJCP1950 ). Under the reasonable assumption that the cloud grows as the sum of its components, this theory states that the cloud size, , follows
| (2) |
where is the difference between the concentration of carbonic gas in the bulk liquid and the saturation value, its diffusivity, the density of the gas inside the bubbles, a dimensionless constant and a known function (Supplementary Material). Taking the estimated number of fragments generated during the collapse of a single bubble, , we expect the radius of the bubble cloud to grow about 100 times faster than a single bubble with the same volume than the cloud. In fact, this magnitude represents an upper bound, since those fragments at the center of the cloud will grow more slowly, due to their limited access to CO2. Initially, the growth rate scales roughly as albeit exhibiting some oscillations caused by cycles of expansions and compressions that are not yet attenuated (see the stage labelled as “diffusion-driven” in Fig. 3, blue squares in the upper panel). This diffusion-driven stage ends when carbon dioxide is locally depleted and thus the cloud’s size significantly moderates its growth.
In the example of figure 3, this occurs at about ms (stage labelled as “depletion”). To avoid the noise introduced by the acoustic waves at short times we have performed additional experiments by focusing a high-energy laser pulse inside the liquid to trigger the formation of a bubble cloud by laser-induced cavitation OhlLindauLauterbornPRL1998 (see Supplementary Material). In the focal region, the laser generates a dense bubble cloud that initially grows as the square root of time, which is consistent with a purely diffusive growth (Fig. 3, red squares in the upper panel).
The rapidly growing bubble clusters act as buoyancy sources that lead to the formation of bubble-laden buoyant vortex rings in time scales of order (Fig. 3c), very much like a localized release of heat forms a thermal TurnerPRSA1957 . As the vortices rise through the liquid, the advection due to their self-induced velocity and the mixing caused by their vortical motion contribute to enhance the transport of CO2 to the bubbles.
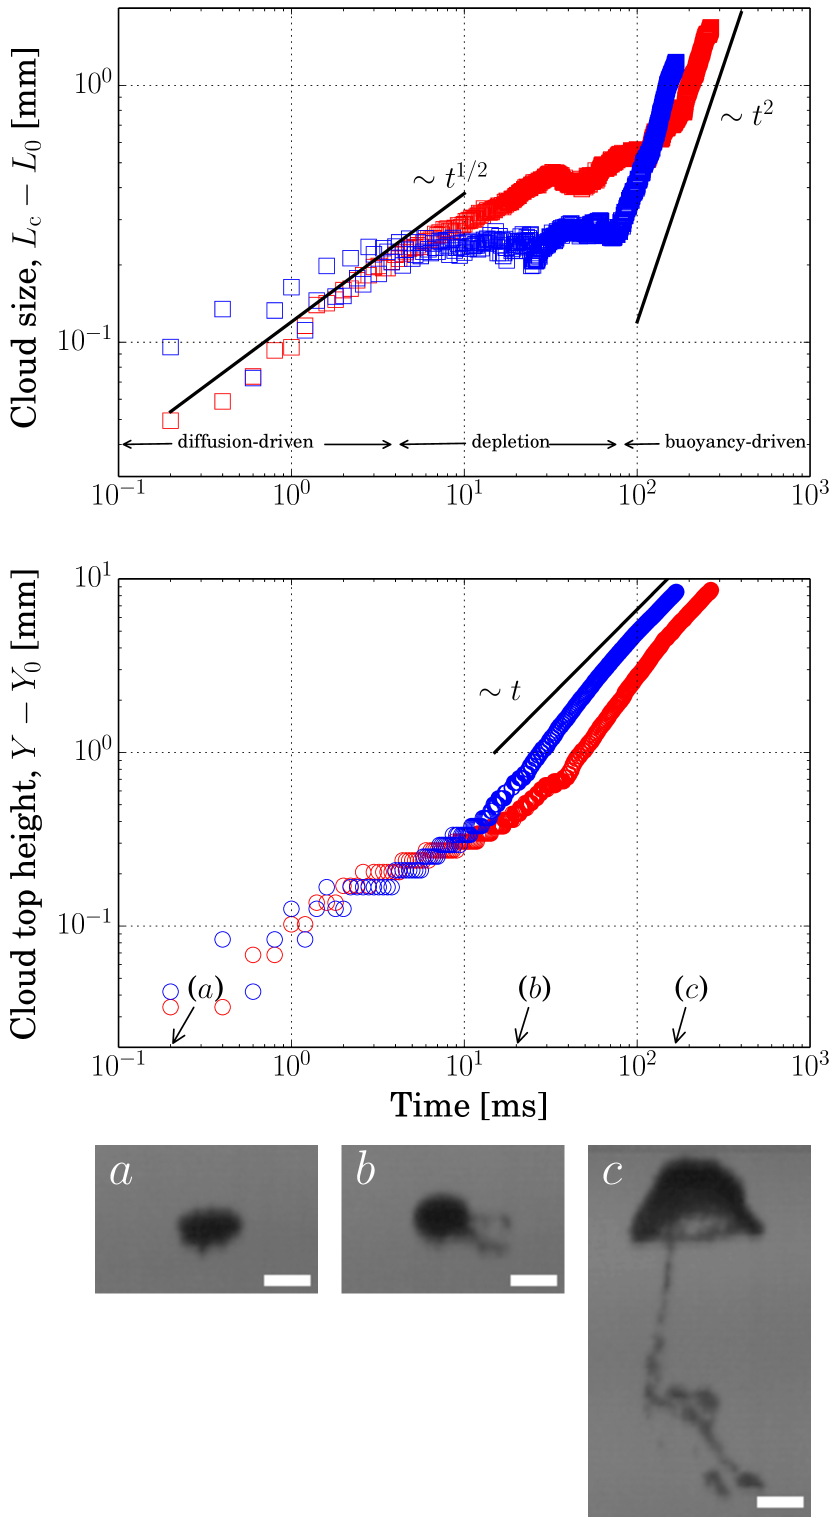
In turn, this results in a growth-rate faster than that found for pure diffusion, namely . Indeed, the cloud’s size grows roughly as during this stage (Fig. 3, upper plot). Moreover, as a consequence of the continuous generation of gas volume inside the vortex, the velocity approaches a constant value (Fig. 3, lower plot) instead of decreasing as happens in buoyant vortex rings induced by the release of a fixed amount of buoyancy. For instance, in thermals originated by the sudden release of a fixed amount of heat, the velocity decays as due to the entrainment of colder fluid TurnerPRSA1957 ; MortonJFM1960 .
Conversely, in the bubble-laden plumes studied here, the feedback between buoyancy-driven rising motion and gas-volume generation results in a nearly constant speed. This behavior is similar to that found in the the so-called autocatalytic vortex rings or plumes RogersMorrisPRL2005 where buoyancy is continuously produced by a chemical reaction that yields products less dense than the reactants. These buoyancy-driven chemically-reacting flows appear, for instance, in the combustion of flame balls in microgravity conditions. Interestingly, they are also relevant in some explosion scenarios for Type Ia supernovae VladimirovaCTM2007 ; RogersMorrisChaos2012 .
The analogy between the bubble-laden plumes observed here and the autocatalytic plumes described in the literature extends also to their morphology. Panel in Fig. 3 shows one of these bubble-laden plumes when it is well developed (see also Movie S3). The plume consists of a vortex with a nearly spherical cap with a thin conduit that ascends more slowly, features observed in the plumes driven by autocatalytic chemical reactions RogersMorrisPRL2005 ; RogersMorrisChaos2012 .
It should be pointed out that, among all the stages of the foaming-up process, this one is the most effective in terms of the amount of liquid outgassing as a result of its self-accelerating nature. This stage starts at times of the order of tens of milliseconds and concludes when the plumes reach the size of the liquid volume, usually of the order of a second.
Remarkably, the behavior of the bubble-laden vortex rings during the diffusion-driven and buoyancy-driven stages is independent of the mechanism used to generate the initial bubble cloud. Figure 3 depicts the evolution of the bubble cluster size and velocity of a bubble cluster originated by laser-induced cavitation. The size and velocity follow the same scaling laws as the vortex created by the pressure-induced bubble implosion. This suggests that similar explosive CO2 outgassing processes driven by the formation of these bubbly plumes may be initiated by other physical mechanisms generating dense bubble clouds such as the introduction of new bubble nucleation sites CoffeyAJP2008 ; WoodsARFM2010 or a sudden change on the saturation conditions occurring either globally Magan_etalJVGR2004 or locally ZhangNature1996 ; WoodsARFM2010 . In fact, our observations suggest that, once the plume is initiated, its dynamics do not seem to depend on the particular initiation mechanism. Thus, one of the main conclusions of this study is that the dynamics of these bubble-laden self-accelerating plumes moving in supersaturated media may partly explain the explosive behavior of systems such as limnic and explosive volcanic eruptions where current models typically neglect the role of these autocatalytic structures ZhangKlingAREPS2006 ; WoodsARFM2010 ; MottWoodsJVGR2010 ; CashmanSparksGSAB2013 ; Magan_etalJVGR2004 .
Finally, two side effects induced by the development of the bubbly plumes must be mentioned here attending to their relevance in the global degassing process in the case of the bottle. Firstly, due to the finite size of the container, a global recirculating motion is generated that drags bubbles from near the free surface deep into the bulk liquid, thus increasing their residence time in the flow and allowing them to grow for longer times. Secondly, the flow induced inside the bottle speeds-up also the growth of gas cavities attached to the walls Jones_etalACIS1999 ; Liger-Belair_etalJPCB2005 through the enhancement in the transport of carbon dioxide towards these cavities, that otherwise would only grow by diffusion. A very similar effect is probably behind the long time scales involved in limnic eruptions. In these phenomena, bubbly plumes form that keep entraining CO2-saturated water from the bottom of the lake until it is almost depleted of this gas due to the global overturning flow that they induce in the lake MottWoodsJVGR2010 . Altogether, the chain of effects described in this letter leads to the fast appearance of foam that has granted beer tapping its popularity.
We would like to thank Dr. Maylis Landeau for her useful comments on the potential applications of the present study. The authors are indebted to Profs. Norman Riley, José Manuel Gordillo, Alejandro Sevilla and Carlos Martínez-Bazán for their insightful comments. We acknowledge the support of the Spanish Ministry of Economy and Competitiveness through grant DPI2011-28356-C03-02.
References
- (1) Zhang, Y. Z. and Kling, G. W. Dynamics of lake eruptions and possible ocean eruptions. Annu. Rev. Earth Planet. Sci., 34, 293-324 (2006)
- (2) Zhang, Y. Dynamics of CO2-driven lake eruptions. Nature 379, 57-59 (1996).
- (3) Cashman, K. V. and Sparks, R. S. J. How volcanoes work: a 25 year perspective. Geol Soc. Am. Bull. 125, 664-690 (2013)
- (4) Mangan, M., Mastin, L. and Sisson, T. Gas evolution in eruptive conduits: combining insights from high temperature and pressure decompression experiments with steady-state flow modeling. J. Volcanol. Geothermal Res., 129, 23-36 (2004)
- (5) Liger-Belair, G. et al. Proc. Natl. Acad. Sci. USA 106, 16545-16549 (2009).
- (6) Mott RW and Woods AW. A model of overturn of CO2 lakes triggered by bottom mixing. J. Volcanol. Geothermal Res. 192 151-158 (2010).
- (7) Brennen, C. E., Cavitation and bubble dynamics. Oxford University Press, Oxford (1995).
- (8) Goldsmith, W., Impact: The Theory and Physical Behaviour of Colliding Solids. Dover Publications, New York (2001).
- (9) Feinstein, S. B. et al. Two-dimensional contrast echocardiography. I. In vitro development and quantitative analysis of echo contrast agents. J. Am. Coll. Cardiol. 3, 14-20 (1984).
- (10) Brenner, M. P., Hilgenfeldt, S. & Lohse D. Single-bubble sonoluminiscence. Rev. Mod. Phys. 74, 425-484 (2002).
- (11) Brennen, C. E. Fission of collapsing cavitation bubbles. J. Fluid Mech. 472, 153-166 (2002).
- (12) Prosperetti, A & Seminara, G. Linear stability of a growing or collapsing bubble in a slightly viscous liquid. Phys. Fluids 21, 1465-1470 (1978).
- (13) Ioss, P. L. & Rossi, M. Stability of a compressed gas bubble in a viscous fluid. Phys. Fluids A 1, 915-923 (1989).
- (14) Epstein, P. S. & Plesset, M. S. On the stability of gas bubbles in liquid-gas solutions. J. Chem. Phys. 18, 1505-1509 (1950).
- (15) Ohl, C. D., Linday, O. & Lauterborn, W. Luminescence from spherically and aspherically collapsing laser induced bubbles. Phys. Rev. Lett. 80, 393-396 (1998).
- (16) Turner, J. S. Buoyant vortex rings. Proc. R. Soc. Lond. A 239, 61-75 (1957).
- (17) Morton, B. R. Weak thermal vortex rings. J. Fluid Mech. 9, 107-118 (1960).
- (18) Rogers, M. C. & Morris, S. W. Buoyant Plumes and Vortex Rings in an Autocatalytic Chemical Reaction. Phys. Rev. Lett. 95, 024505 (2005).
- (19) Vladimirova, N. Model flames in the Boussinesq limit: Rising bubbles. Comb. Theor. Modelling 11, 377-400 (2007).
- (20) Rogers, M. C. & Morris, S. W. The heads and tails of buoyant autocatalytic balls. Chaos 22, 037110 (2012).
- (21) Coffey, T. S. Diet coke and mentos: what is really behind this physical reaction? Am. J. Phys. 76, 551-557 (2008)
- (22) Jones, S. F., Evans, G. M. & Galvin, K. P. Bubble nucleation from gas cavities - a review. Adv. Colloid Interf. Sci. 80, 27-50 (1999).
- (23) Liger-Belair, G., Voisin, C. & Jeandet, P. Modeling nonclassical heterogeneous bubble nucleation from cellulose fibers: application to bubbling in carbonated beverages. J. Phys. Chem. B 109, 14573-14580 (2005).
- (24) Woods, A. W. Turbulent Plumes in Nature. Annu. Rev. Fluid Mech. 42, 391-412 (2010).
Supplementary Material
Experimental techniques:
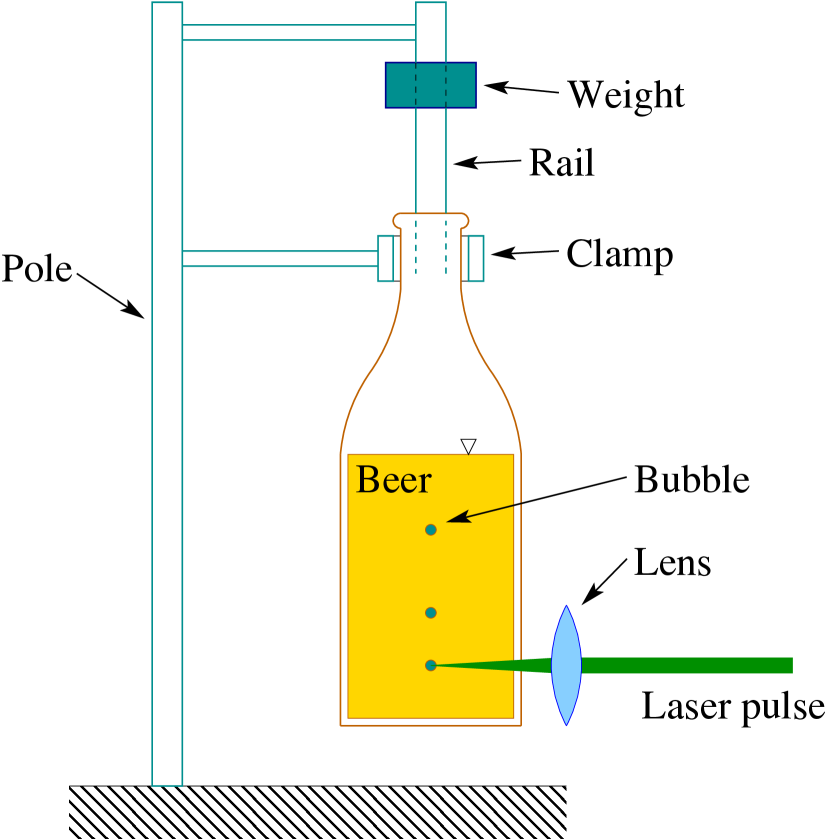
In a first set of experiments, the pressure fluctuations induced in the liquid upon the impact were recorded with a hydrophone. In these experiments, the bottle was filled with deionized water, to delay the formation of cavitation bubbles at the hydrophone’s surface. In a second set of experiments, actual beer was used (CO2 concentration: g/l, measurement provided by the manufacturer). The evolution of bubbles existing in the liquid previously to the impact was recorded with a high-speed camera. To ensure that a bubble is present at the camera’s focal point, bubbles were generated by focusing a low-energy YaG laser pulse inside the bulk liquid with a convergent lens before the impact. In this way, we avoid the variability in the location and size of the bubble formed upon the impact due to the randomness of the distribution of nucleation sites found in all liquids Brennen1995 . In these two experimental sets, the bottle was impacted by dropping a brass weight (90 g.) in a controlled and repeatable manner from a height of 25 mm. (see Fig. 4). Moreover, the bottle is held by the neck using a rigid clamp that prevents the net motion of the bottle after the impact and keeps the bottom above the ground, thus preventing the partial transmission of the wave to the bench.
Finally, a third kind of experiment was performed where, instead of hitting the bottle mechanically, a high-energy laser pulse was focused inside the beer to induce cavitation, similarly as described in OhlLindauLauterbornPRL1998 , thus creating a bubble cloud that serves as a seed to eventually trigger the formation of a bubble-laden plume. In all the sets, the projected area of the bubble cluster, , was measured using custom-made software. The cluster size, , was then calculated as the diameter of a circle with the same area, namely .
Estimation of the number of bubble fragments: Upon bubble collapse, the high void fraction of the resulting cloud of fragments precludes the application of any measurement technique to directly determine the number of those fragments. To get at least an order of magnitude estimation of that number, we apply the model proposed by Brennen BrennenJFM2002 . Briefly, this model uses the equation for the amplitude, , of a spherical harmonic perturbation of order ,
| (3) |
where is the liquid density and the liquid-gas surface tension. Notice that, to determine the evolution of the perturbations, the time-history of the bubble radius, , is needed. As a further simplification, since the growth of the surface instabilities is very fast compared to the bubble radial dynamics, both the radius, , and its acceleration, , are considered constant during the final instants of the break-up process. Thus, it is now possible to calculate the fastest-growing mode, , i.e. that maximizes the expression in brackets, , in equation 3:
| (4) |
where , evaluated using the minimum bubble radius, and the acceleration at the time at which that radius is reached. Consequently, Brennen’s model allows us to compute the fastest-growing mode using only values of the radius and its acceleration at the collapse time.
Nonetheless, the short duration of the collapse stage impedes recording the process with enough time resolution to estimate either the minimum bubble radius or the acceleration during this stage (see Figs. 2c and 2d). Therefore, to obtain these parameters to apply Brennen’s model BrennenJFM2002 , the evolution of the bubble radius has been computed numerically by integrating the Rayleigh-Plesset equation:
| (5) |
where kg/(ms) is the liquid viscosity, is the heat capacity ratio of the gas (CO2) and is the pressure pulse induced in the system, given by , with amplitude kPa and period ms. These values were measured with a hydrophone at the bubble’s location. Moreover, the following values have been used: the CO2-water surface tension, N/m, the water density, kg/m3, and the ambient pressure, Pa.
Figure 2 shows the good agreement between the numerical and the experimental results before the break up, justifying the usage of the numerical parameters to estimate the number of fragments resulting from it. For instance, from the experiment shown in figure 2, we obtain . This value ranges between 120-160 in all our experiments, with a maximum different between the maximum radius calculated numerically and the measurement always within 10% or less.
Modelling the growth rate of a bubble cloud: To get an estimation of the growth rate of the bubble cloud due to the diffusion of CO2 before buoyancy becomes important (diffusion-stage), we assume that the cluster’s volume grows as the sum of the volume of its components. The time evolution of the radius of a fragment, , is given be the Epstein-Plesset equation (Ref. EpsteinPlessetJCP1950 ),
| (6) |
where is the diffusivity of CO2 in water, the density of the gas inside the bubble and the difference between the concentration of CO2 far away from the cloud and that at the bubble’s surface. Neglecting the capillary pressure, the solution to the equation is well approximated by
| (7) |
with the initial radius and (ref. EpsteinPlessetJCP1950 ). Notice that the second term in this expression corresponds to the solution to Eq. (7) at long times. Here we have added the first term, the initial radius, to obtain an expression that yields small relative errors for both long and short times. Assuming that the fragments are equally sized, the volume of the cloud can be written as
| (8) |
where the dimensionless constant accounts for the fact that the cluster contains some amount of liquid separating the bubbles. Taking the cube root of the expression, and denoting the initial cluster size by , we get
| (9) |
Finally, we would like to comment on the applicability of the Epstein-Plesset equation to this problem. This equation describes the growth of an isolated bubble, whereas in this case bubbles belong to a dense cluster. Therefore we expect that, at some point, the CO2 must be depleted, with only those bubbles closer to the clouds’ surface being still able to grow. This is consistent with the behavior observed in figure 3b, where the growth rate of the cluster decreases notably at about 10 ms.
Movie labels:
Movie S1. Bubble fragmentation 1: fragmentation of a bubble as a result of the passage of the train of expansion-compression waves. This is the same bubble shown in Fig. 2. Scale bar: 500 m.
Movie S2. Bubble fragmentation 2: the fragmentation of a gas bubble is shown, together with a plot of its instantaneous radius. Notice how, after the second compression, the bubble breaks-up and forms a cloud of bubble fragments.
Movie S3. Bubble plume development: this movie shows the evolution of a bubble cloud during the buoyancy-driven stage. Notice the large increase of the foam volume. This plume corresponds to the blue symbols of Fig. 3. Scale bar: 1 mm.
Movie S4. Global view of the bottle after the impact: the movie shows the development and growth of the bubble plumes after hitting the bottle. To make more evident the process, the formation of bubbles has been forced by placing a metal disk at the bottom of the bottle, what effectively introduces a large number of nucleation sites at the bottom.