Abundant molecular gas and inefficient star formation in intracluster regions: Ram pressure stripped tail of the Norma galaxy ESO137-001**affiliation: Based on observations made with ESO telescopes at La Silla Paranal Observatory under programme ID 088.B-0934.
Abstract
For the first time, we reveal large amounts of cold molecular gas in a ram pressure stripped tail, out to a large, “intracluster” distance from the galaxy. With the APEX telescope we have detected 12CO(2-1) emission corresponding to more than of H2 in three H bright regions along the tail of the Norma cluster galaxy ESO 137-001, out to a projected distance of 40 kpc from the disk. ESO 137-001 has an 80 kpc long and bright X-ray tail associated with a shorter (40 kpc) and broader tail of numerous star-forming H II regions. The amount of of H2 found in the most distant region is similar to molecular masses of tidal dwarf galaxies, though the standard Galactic CO-to-H2 factor could overestimate the H2 content. Along the tail, we find the amount of molecular gas to drop, while masses of the X-ray emitting and diffuse ionized components stay roughly constant. Moreover, the amounts of hot and cold gas are large and similar, and together nearly account for the missing gas from the disk. We find a very low star formation efficiency ( yr) in the stripped gas in ESO 137-001 and suggest that this is due to a low average gas density in the tail, or turbulent heating of the interstellar medium that is induced by a ram pressure shock. The unprecedented bulk of observed H2 in the ESO 137-001 tail suggests that some stripped gas may survive ram pressure stripping in the molecular phase.
Subject headings:
galaxies: clusters: individual (A3627) — galaxies: individual (ESO 137-001) — galaxies: evolution — galaxies: ISM — galaxies: star formation — submillimeter: ISM1. Introduction
The dense environments of galaxy clusters and groups have been identified as places where transformations of galaxies from blue, star-forming to red, gas-poor systems happen. Late-type galaxies are rare in the cores of galaxy clusters although dominate in their outer parts and outside of clusters (the morphology-density relation, Dressler, 1980; van der Wel et al., 2010). Cluster galaxy populations evolve over cosmic time, as shown by the excess of optically blue galaxies in clusters at higher redshifts (the Butcher-Oemler effect, Butcher & Oemler, 1978, 1984). Several mechanisms are active in clusters that could account for the observed evolution, such as mutual gravitational interactions of galaxies, including mergers and rapid galaxy encounters, alias harassment, the tidal influence of the cluster potential, and ram pressure of the intracluster medium (ICM) on the interstellar matter (ISM) of member galaxies (Gunn & Gott, 1972), accompanied by numerous hydrodynamic effects.
While there is a wealth of observational evidence of one-sided, clearly ram pressure stripped, gas tails in: (a) H I in the Virgo cluster (e.g., Kenney et al., 2004; Chung et al., 2007, 2009; Abramson et al., 2011; Kenney et al., 2014) and more distant clusters (A1367, Scott et al., 2010, 2012), (b) diffuse H tails (Gavazzi et al., 2001; Cortese et al., 2006, 2007; Sun et al., 2007; Yagi et al., 2007; Yoshida et al., 2004, 2008; Kenney et al., 2008; Fossati et al., 2012), (c) young stars seen either in H or UV (Cortese et al., 2006; Sun et al., 2007; Yoshida et al., 2008; Smith et al., 2010; Hester et al., 2010; Yagi et al., 2013; Ebeling et al., 2014), and (d) X-rays (Wang et al., 2004; Finoguenov et al., 2004; Machacek et al., 2005; Sun & Vikhlinin, 2005; Sun et al., 2006, 2010), no example of a prominent (cold) molecular one-sided tail is known up to now, except a few cases of extraplanar molecular gas located fairly close to the disk (NGC 4438, NGC 4522, Vollmer et al., 2005, 2008). Recently, Jáchym et al. (2013) searched for cold molecular gas in the star-forming ram pressure stripped tail of the Virgo dwarf galaxy IC3418, that is (almost) completely stripped, but reached only sensitive upper limits. Presence of molecular gas has been known in some intracluster regions though, as revealed by Carbon monoxide (CO) emission, the most widely used tracer of the molecular interstellar medium. Observations of filaments near cluster cores have revealed anomalously strong H2 emission that may extend to large distances from the cD galaxies (Johnstone et al., 2007; Salomé et al., 2011). Also, in the off-disk locations of the Virgo cluster galaxy M86, Dasyra et al. (2012) found CO emission in the long H tidal trail that connects M86 with NGC 4438.
One of the main issues in galaxy formation and evolution is to understand the star formation history, and in particular how star formation is triggered, and how it can be suddenly quenched. Environmental effects could play an important role in this matter, and in particular ram pressure stripping of the gas of spiral galaxies. Stars form from cold molecular interstellar gas gathered into giant molecular clouds (GMCs, e.g., Wong & Blitz, 2002). While H I can be easily stripped from galaxies by the ICM wind, the GMCs are less efficiently removed since they are typically denser and distributed with a higher concentration to the galactic center. Very recently, Boselli et al. (2014) found evidence that Virgo cluster galaxies that are H I deficient have on average also somewhat less molecular gas than H I-normal field galaxies. The effective H2 ram pressure stripping in these galaxies may be a consequence of removal of diffuse H I that normally feeds giant molecular clouds. Moreover, hydrodynamic ablation by the ICM wind is assumed to assist the effective H2 stripping (Nulsen, 1982; Quilis et al., 2000; Kapferer et al., 2009; Tonnesen & Bryan, 2009).
Numerical simulations predict that in the gas-stripped tails, depending on the ICM ambient pressure, radiative cooling can form in situ new dense (molecular) clouds which might then form a population of new stars (Kapferer et al., 2009; Tonnesen & Bryan, 2009). If their native gas clumps were accelerated by ram pressure to velocities exceeding the escape speed from the galaxy, such stars can contribute to the intracluster light (ICL) population. In extreme environments of massive or merging galaxy clusters it is possible that strong ram pressures could directly strip the dense molecular clouds.
1.1. The galaxy ESO 137-001
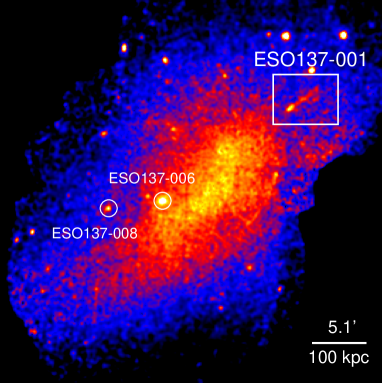
The Norma cluster (Abell 3627, Mpc, , km s-1) is the closest () rich cluster comparable in mass and number of galaxies to Coma or Perseus111Mean radial velocity of km s-1 was measured for the A3627 cluster by Woudt et al. (2008) from radial velocities of 296 member galaxies.. It occurs close to the center of the Great Attractor, at the crossing of a web of filaments of galaxies (dubbed the Norma wall; Woudt et al., 2008). The Norma cluster is strongly elongated along the Norma wall indicating an ongoing merger at the cluster core (see the central part of the cluster in Fig. 1). The spiral and irregular galaxy population appears far from relaxed (Woudt et al., 2008). The center of the cluster is assumed to be at the position of the cD galaxy ESO 137-006.
| ESO 137-001 (WKK6176): | |
|---|---|
| RA, Dec (J2000) | , |
| type | SBc |
| radial velocity | km s-1 |
| major/minor diameter | / |
| PA, inclination11Sun et al. (2007) give | , |
| total and magnitudes22from Sun et al. (2007), the correction for the intrinsic extinction is not applied | , |
| stellar mass33from Sun et al. (2010) and Sivanandam et al. (2010) | |
| rotation velocity44from -band velocity-luminosity relation (Sivanandam et al., 2010) | km s-1 |
| luminosity distance33from Sun et al. (2010) and Sivanandam et al. (2010) | 69.6 Mpc |
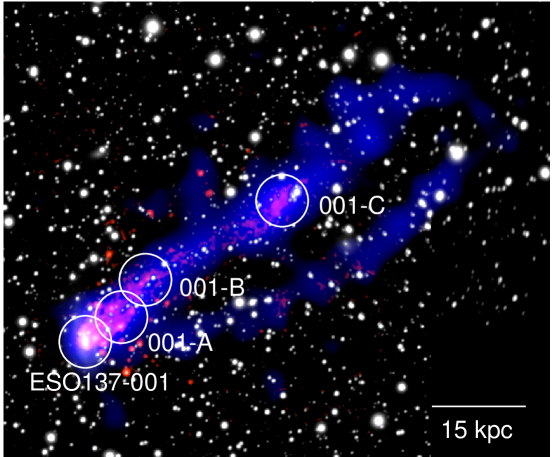
At a projected distance of kpc from the cluster center to the NW direction a blue galaxy ESO 137-001 is located (see Fig. 1 and Table 1). Its line-of-sight velocity is about -200 km s-1 w.r.t. the cluster mean which suggests that the main velocity component is in the plane of the sky. and XMM- imaging revealed a long, narrow X-ray tail extending from the galaxy to kpc projected distance (Sun et al., 2006), see the left panel of Fig. 2. It points away from the direction to the cluster center. The total estimated X-ray gas mass is about . Deeper observation revealed even a fainter secondary X-ray tail that is well separated from the primary one (Sun et al., 2010). The bright X-ray emission in the tails is presumably arising from mixing of cold stripped ISM with the surrounding hot ICM (Sun et al., 2010; Tonnesen et al., 2011). Currently, Ruszkowski et al. (2014) suggested that the tail bifurcation may arise as a consequence of magnetized ram pressure wind that produces very filamentary morphology of the tail.
Optical images of ESO 137-001 reveal a kpc long H tail comprised of diffuse gas and discrete H II regions roughly coincident with the X-ray tail. Moreover, a number of discrete H II regions are occurring outside the visible X-ray tail, forming a broader tail (Sun et al., 2007). A large amount of star formation corresponding to the total number of more than 30 H II regions is thus occurring well outside the main body of the galaxy. The total mass of starbursts in the H II regions in the tail is estimated to about . ESO 137-001 is expected to host a significant amount of H I and H2 initially. To a weak limit of no H I was detected with ATCA (Australia Telescope Compact Array, Vollmer et al., 2001)222The upper limit is lower than in Vollmer et al. (2001) since a lower luminosity distance of 69.6 Mpc is adopted for the A3627 cluster. It is possible that some (extended) H I emission was filtered out by the ATCA interferometric observation. No single-dish data are available.. Spitzer IRS observations however revealed more than of warm H2 ( K) in the galaxy and inner 20 kpc of the tail (Sivanandam et al., 2010). As this warm gas is likely a small fraction of the total molecular hydrogen, deep H I and CO observations are expected to reveal the cold component in the galaxy.
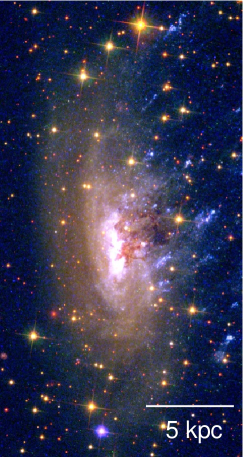
ESO 137-001 is an excellent candidate for an ongoing transformation from a blue, gas-rich to a red, gas-poor galaxy due to violent removal of its ISM by ram pressure stripping. It has the most dramatic tail of a late-type galaxy observed up today, making it an ideal laboratory for detailed studies of the complex processes that take place during ram pressure stripping. A3627 is a rich cluster where ram pressure can be 1-2 orders of magnitude stronger than in Virgo. The high pressure (including thermal pressure) environment might therefore be strong enough to affect even denser (molecular) gas. HST observations revealed a complex structure with disrupted dust content, filaments of young stars, and bright extraplanar star clusters in the inner tail of ESO 137-001 (see Fig. 2, right panel). Detailed study of these observations will be published elsewhere. Herschel PACS and SPIRE imaging shows a dust trail emanating from the galaxy that is coaligned with the warm H2, H and the more prominent of the two X-ray tails (Sivanandam et al., in prep.).
In this paper we want to answer basic questions about the presence, amount, spatial distribution, and origin of molecular gas in the star-forming stripped tail of ESO 137-001. With APEX, we searched for 12CO(2-1) emission in regions covering the main body of the galaxy, as well as in the H emission peaks in the tail. The paper is structured in the following way: observations performed are introduced in Section 2, the results are presented in Section 3, the efficiency of star formation in the system is studied in Section 4, the structure of the stripped gas is analyzed in Section 5, the ram pressure operating on the galaxy is semi-analytically estimated in Section 6. Discussion follows in Section 7, and the conclusions in Section 8. We adopt a cluster redshift of 0.0163 for A3627 (Woudt et al., 2008). Assuming km s-1 Mpc-1, , and , the luminosity distance is 69.6 Mpc, and kpc.
2. Observations
The observations of ESO 137-001 were carried out with the Atacama Pathfinder EXperiment (APEX) 12 m antenna in September 2011333In the same APEX programme, the Norma ram pressure stripped galaxy ESO 137-002 (Sun et al., 2010) was also observed. The results will be discussed in a forthcoming paper.. Using the APEX-1 receiver of the Swedish Heterodyne Facility Instrument (SHFI) the observations were done at the frequency of the 12CO(2–1) ( GHz) line. The eXtended Fast Fourier Transform Spectrometer (XFFTS) backend was used with a total bandwidth of 2.5 GHz divided into 32768 channels. The corresponding velocity resolution is about 0.1 km s-1. The XFFTS consists of two units with a 1 GHz overlap region. It thus covers the entire IF bandwidth of the SHFI. At 230 GHz the FWHM of the primary beam of the telescope is about which, with the adopted distance of the Norma Cluster of Mpc, corresponds to about 8.4 kpc. The main beam projected area arcsec kpc2, including a factor of a Gaussian beamshape correction. The system temperatures were typically about 140 K and the data are of an excellent quality.
| Source | R.A. | Dec. | ||
|---|---|---|---|---|
| (J2000) | (J2000) | (km s-1) | (min) | |
| ESO137-001 | 16:13:27.24 | -60:45:50.6 | 4630 | 13 |
| 001-A | 16:13:24.75 | -60:45:39.5 | 4600 | 21 |
| 001-B | 16:13:23.30 | -60:45:21.0 | 4600 | 56 |
| 001-C | 16:13:14.34 | -60:44:42.4 | 4500 | 137 |
The observations were done in a symmetric Wobbler switching mode with the maximum throw of in order to avoid with OFF positions the tail if oriented in azimuth. The Wobbler switching is known to provide better baseline stability than position switching. The integration points in ESO 137-001 were selected to cover its main body, as well as H bright regions in its tail, including one at a large projected distance of from the galaxy (see scheme in Fig. 2). The list of observed positions is given in Tab. 2, together with information on their radial velocity and actual on-source observing time. The receiver was tuned to the 12CO(2-1) frequency shifted in each position to its respective optical radial velocity (given in Table 2). Observing conditions were good with PWV less than 1 mm.
The data were reduced according to the standard procedure using CLASS from the GILDAS software package developed at IRAM. Bad scans were flagged and emission line-free channels in the total width of about 1000 km s-1 were used to subtract first-order baselines. The corrected antenna temperatures, , provided by the APEX calibration pipeline (Dumke & Mac-Auliffe, 2010), were converted to main-beam brightness temperature by , using a main beam efficiency of about at 230 GHz. The rms noise levels typically of mK per 12.7 km s-1 channels were obtained. Gaussian fits were used to measure peak , width, and position of the detected CO lines. Flux densities can be obtained using the conversion factor Jy beam-1 K-1 for the APEX telescope.
3. Results
3.1. Main body of ESO 137-001
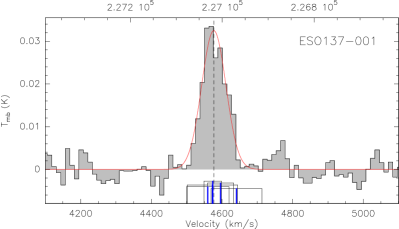
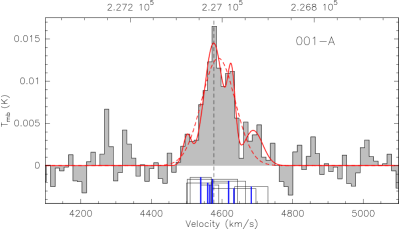
In the pointing centered on the main body of ESO 137-001, CO(2-1) emission is strongly detected (see Fig. 3, the top left panel). The corresponding molecular gas mass is about , following , where we assume a typical values for the CO(2-1)-to-CO(1-0) ratio of 0.8 (e.g., Leroy et al., 2009), and a standard Galactic CO(1-0)-to-H2 conversion factor of cm-2(K km s (e.g., Kennicutt & Evans, 2012; Feldmann et al., 2012). The formula includes a factor of 1.36 to account for the presence of Helium. Using a Gaussian fit (plotted in Fig. 3 over the spectrum) we measure the linewidth of 81 km s-1 and the central velocity of the line of km s-1, assuming the radio definition of the velocity444 km s-1. Other parameters of the line are given in Table 3. Sun et al. (2007) measured the radial velocity of the central emission nebula from two different optical CTIO 1.5 m spectra to km s-1 and km s-1, which is very close to our measurement555 km s-1..
As is apparent from Fig. 2, the central APEX beam has been contaminated by a contribution from off-disk regions. Within its kpc FWHM it encompasses not only the central H emission nebula but also five identified off-disk H II regions (Sun et al., 2007), including the brightest one (ELO1 in Sun et al., 2007) that is located only about 2 kpc downstream in the tail. Their radial velocities are mostly close ( km s-1) to the galaxy’s system velocity, except one at km s-1 located near the southern beam edge. The radial velocities of the encompassed H II regions are shown at the bottom of the spectrum panel in Fig. 3 with the blue bars with black wings corresponding to the errors. The ratio of H luminosities of the central nebula and of the brightest off-disk region ELO1 is (Sun et al., 2007). This suggests that the central nebula could dominate also the CO emission in the main body pointing, however, we don’t know what is the relation between H and CO emission and thus cannot say what fraction of the total H2 mass of detected in the main body point belongs to the off-disk sources.
| Source | rms | velocity | FWHM | ||||
| (mK) | (km s-1) | (km s-1) | (mK) | (K km s-1) | (K km s-1) | () | |
| ESO137-001 | 2.6 | 32.5 | 2.7 | ||||
| 001-A | 1.9 | 12.7 | 1.6 | ||||
| 3.5 | - | ||||||
| 14.5 | - | ||||||
| 9.3 | - | ||||||
| 4.2 | - | ||||||
| 001-B | 1.2 | 5.9 | 0.8 | ||||
| 7.9 | - | ||||||
| 5.5 | - | ||||||
| 2.9 | - | ||||||
| 001-C | 1.0 | 4.4 | 0.4 |
3.2. Molecular gas in the halo – the inner tail of ESO 137-001
In the innermost tail pointing 001-A, located roughly one beam ( kpc) downstream of the galaxy center, CO(2-1) emission is detected with very high significance (see Fig. 3, the top right panel). The measured CO luminosity corresponds to of molecular gas, about half the mass found in the main body position. Although the X-factor is uncertain for the special environment of a gas stripped tail, we assume the Galactic value because the metallicity measured in the tail is close to solar (, Sun et al., 2010). The actual value of the X-factor will be discussed in a forthcoming paper based on observations of other CO transitions in the system. Multiple components are visible in the 001-A line – a wing at the low-velocity side, a double-profile main part, and a feature at the high-velocity side centered at km s-1. In Table 3 the parameters of the multiple Gaussian fits are given together with a single Gaussian fit of the whole line. The central velocity of the single fit is only slightly higher ( km s-1) than in the main body position. We discuss the components in more detail in Subsection 7.1. The 001-A pointing encompasses three bright H II regions at radial velocities , , and km s-1 with respect to the galaxy’s systemic velocity, as well as several weaker regions including one at the edge of the beam that has a higher radial velocity ( km s-1) which corresponds well to the high-velocity feature in the CO spectrum.
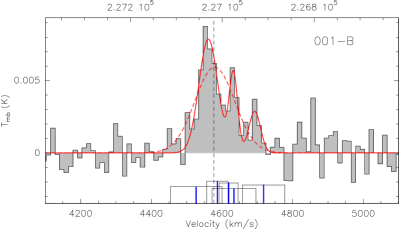
Advancing another kpc along the tail to the 001-B point, about of molecular gas is detected (see Fig. 3, the bottom left panel), about half of the amount found in 001-A. The line profile again shows several velocity components that are more distinct than in the case of 001-A. The parameters of a multiple Gaussian profile fit are given in Table 3. Although not included in the fitting, there is a hint of a low-velocity feature similar to that in 001-A. The 001-B pointing encompasses several bright H II regions which are moving at about km s-1 to km s-1 relative to the systemic velocity along the line of sight. Thus CO and H velocities are again well consistent.
In total, in the inner tail regions 001-A and 001-B we thus detected almost the same amount () of molecular gas as in the galaxy pointing. Taking into account the contribution of off-disk regions to the main body point intensity, and the uncovered parts of the tail, there probably is more H2 in the inner kpc of the tail than in the main body.
3.3. IC molecular gas – the outer tail of ESO 137-001
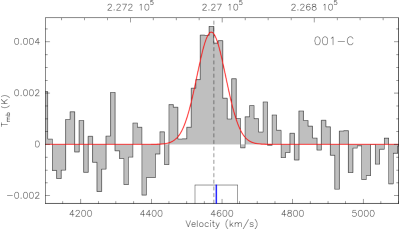
Strong CO(2-1) emission is detected even in the outermost position we have searched located at kpc (in projection) from the main body, where both X-ray and H emission peak (see Fig. 3, the bottom right panel). This is the first time CO emitting gas is detected in intra-cluster regions of a clearly ram pressure stripped tail, that moreover is associated spatially with star-forming regions and X-ray emitting gas. The corresponding molecular gas mass is , which is about a factor 2 less than in the region 001-B, and it constitutes about 15% of the total H2 mass found in the tail. As we will discuss later in Section 5.2, higher molecular gas temperature in the tail (as well as optical thickness and other effects), especially at the farthest pointing 001-C, could possibly decrease the CO-to-H2 conversion factor from a Galactic value that we used, and therefore yield an overestimate of the H2 content (Bolatto et al., 2013).
A single Gaussian fit of the CO line is centered at km s-1 which is very close to the central velocity of the main body line. This indicates that indeed the gas-stripped tail extends almost entirely in the plane of the sky and suggests that also the orbital motion of the galaxy happens mostly in the plane of the sky. Table 3 further summarizes the parameters of the line fit. The CO line profile is asymmetric, indicating again an internal structure. Only one H II region identified by Sun et al. (2007) occurs in the 001-C pointing area. Its radial velocity is well consistent with the central velocity of the CO line (see the blue bar in the bottom right panel of Fig. 3).
The tidal truncation radius of the dark matter halo of ESO 137-001 is estimated to be about 15 kpc (Sun et al., 2010). This suggests that the molecular gas detected in the 001-C region could already be released from the gravitational well of the galaxy and thus contribute directly to the intracluster material in the Norma cluster. Due to the lack of (almost) any radial velocity component however, we cannot determine whether the detected molecular gas is indeed at velocities exceeding the escape speed from the galaxy or stays bound to it.
4. Efficiency of star formation
The optical spectroscopy and the H imaging revealed star-forming nucleus of ESO 137-001, as well as over 30 H II regions downstream in the tail (Sun et al., 2007, 2010). Subsequent infrared data showed associated m excess sources in the inner of the tail (Sivanandam et al., 2010). In this section, we estimate how efficient has been the transformation of the detected molecular gas into stars. We are especially interested in the situation in the gas-stripped tail of the galaxy.
| Source | SFRHα | ||
|---|---|---|---|
| (erg s-1) | ( yr-1) | (K km s-1 pc2) | |
| ESO137-001 | |||
| 001-A | |||
| 001-B | |||
| 001-C |
4.1. Star formation in the disk
The rate of ongoing star formation (SFR) corresponding to the H luminosity of the main body of ESO 137-001 can be calculated from the Kennicutt & Evans (2012) relation
| (1) |
that uses the initial mass function (IMF) of Kroupa & Weidner (2003). The H luminosity of H II regions covered by the ESO 137-001 main body APEX pointing is erg s-1 (see Table 4), dominated by the central nebula. The corresponding SFR is yr-1. It has been shown that multiwavelength observations may reduce uncertainties and errors in SFR determination caused mainly by dust attenuation, especially for edge-on galaxies. While there is no data for ESO 137-001 from Spitzer/MIPS, the Wide-Field Infrared Survey Explorer (WISE) measured in its band 4 (22 m) a flux density of 58.7 mJy. Using the SFR WISE calibration relations of Lee et al. (2013) corrected for Kroupa IMF, in combination with the H flux of the galaxy (Sun et al., 2007), the corresponding SFR of the main body of ESO 137-001 is yr-1.
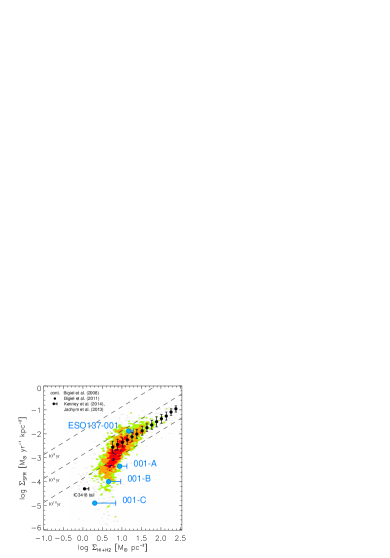
In Fig. 4, the deduced star formation rate in ESO 137-001 averaged over the observed APEX 230 GHz beam area ( kpc2) is plotted into a Kennicutt-Schmidt-type plot showing the as a function of the total (molecular + atomic) gas column density. In the plot, measurements from disks of seven nearby spiral galaxies sampled at sub-kpc scales by Bigiel et al. (2008, their Fig. 8) are shown for comparison. The filled circle at the ESO 137-001’s position in Fig. 4 correspond to the H2 column density, while the ATCA H I upper limit is displayed with the horizontal error bar. Thus, in the main body of ESO 137-001, the measured molecular gas depletion time (i.e., consumption timescale due to star formation, also known as the inverse of the star formation efficiency) is well consistent with average values found in other nearby spiral galaxies ( Gyr, Bigiel et al., 2011, see black dots in Fig. 4). The (total) gas surface density of pc-2 was identified as a limit below which the star formation efficiency starts to vary substantially (at a given gas surface density). Bigiel et al. (2008) propose that this is due to local conditions, such as metallicity, gas pressure, etc., that start to play a role. In such places, typically. The averaged H2 column density in the main body ESO 137-001 pointing exceeds this limit.
4.2. Star formation in the tail
In the gas-stripped tail of ESO 137-001, the only observed SF tracer in all our APEX regions is H emission that gives evidence of recent star formation over the last Myr666We note that the classical SFR-luminosity relation is expected to work well for (a) continuous star formation approximation where SFR is constant over the timescale of H emission and (b) regions where H emission averages over more emitting sources. We are not sure how well the two conditions are fulfilled in the ESO 137-001 tail. The estimate of SFRs in the complex environments of a gas-stripped tail is thus far from trivial.. Table 4 summarizes H luminosities of H II regions covered by our APEX pointings (circles with a diameter). In Table 4, a 1 mag extinction correction was applied, which is probably too high for the tail regions, however, this only makes conclusions of this section stronger. Following Eq. 1, the SFR in the innermost tail region 001-A is low, yr-1. It further drops by a factor of 4.5 when going to the region 001-B, and by another factor of in the most distant IC position 001-C, down to yr-1 (see Table 4). The total star formation rate in the three tail regions is yr-1. This amount is consistent with predictions of numerical simulations by Tonnesen & Bryan (2012) who found the total SFR saturated at yr-1 in the ram pressure stripped tail of their (massive) model galaxy. The low levels of star formation in the inner tail are also suggested from Spitzer/MIPS m-band observations of Sivanandam et al. (2010) who measured in a region that covers partially our 001-A and 001-B apertures a flux of less than 10% of the value from their nuclear region that roughly corresponds to our ESO 137-001 aperture.
The H-based star formation rates averaged over the APEX beams are for the observed tail pointings also placed into the Kennicutt-Schmidt-type plot in Fig. 4. Again, the filled circles correspond to H2 column densities, while the ATCA upper limits on the H I mass per pointing ( pc-2) are taken into account and displayed with the horizontal error bars. Clearly, the location of the points 001-A, 001-B, and 001-C in Fig. 4 indicates much lower efficiency of star formation in the gas-stripped tail of ESO 137-001 than is typical in star-forming ISM in the inner parts of spiral disks. The molecular gas depletion times are above yr, thus exceeding a Hubble time, which indicates that most of the stripped gas does not form stars but remains gaseous and ultimately joins the ICM. Similarly low SFEs are found in the outer disks of spiral galaxies, in H I-rich dwarf irregular galaxies (e.g., Huang et al., 2012; Lee et al., 2009), or in low surface brightness disks (e.g., Wyder et al., 2009), where however, H I is likely to represent most of the ISM and CO is mostly undetected (Bigiel et al., 2010). The CO-bright gas-stripped tail of ESO 137-001 (with only upper limits on the H I content) thus represents a special environment of SF distinct from the above typical categories.
While the Kennicutt-Schmidt law finds a tight correlation between the surface densities and in galactic disks for which the typical unobserved scale height is pc, in the tail of ESO 137-001 the unobserved thickness is likely a few kpc. A low average density of the gas that is distributed in a wide 3D tail is thus probably an important factor in the observed low SFE. Another factor could be ram pressure induced shocks that may increase thermal and turbulent pressure of the stripped ISM (Sivanandam et al., 2010). Turbulence can suppress star formation by inhibiting collapse of molecular clouds.
In Fig. 4 we also plot for comparison the total gas column density (H I detected, H2 measured to upper limits) averaged over the outer parts ( kpc2) of the star-forming tail of the Virgo cluster ram pressure stripped dwarf galaxy IC3418, where the total H luminosity of the H II regions corresponds to a star formation rate of yr-1 (Kenney et al., 2014; Jáchym et al., 2013). The resulting star formation efficiency is again lower than yr.
Similarly, in the ram pressure stripped extraplanar gas of several Virgo cluster spirals, Vollmer et al. (2012) and Boissier et al. (2012) found a depressed SFE with respect to the available amount of total gas. In one case (NGC 4438), Vollmer et al. (2012) determined a lower SFE even with respect to the molecular gas. They suggested that the stripped gas loses the gravitational confinement and associated pressure of the galactic disk which leads to a decrease in gas density and consequently in star formation. As we will discuss later in Section 7.2, the thermal ICM pressure at the location of ESO 137-001 in the Norma cluster however is estimated to be similar to midplane pressures in galactic disks. Low SFEs are known also from other H2 luminous sources, such as radio galaxies where radio-loud AGNs are assumed to enhance heating and turbulence in the molecular gas in disks, or e.g., in the Stephan’s Quintet where turbulence invoked by galaxy-tidal arm collision is a probable source of heating (e.g., Nesvadba et al., 2010; Guillard et al., 2012).
4.3. Ram Pressure Dwarf Galaxy in the making?
With the detected large reservoir of of molecular gas, the (intra-cluster) region 001-C resembles tidal dwarf galaxies (TDGs; e.g., Braine et al., 2001) in that it is young, it also has formed by condensation of pre-enriched matter that belonged to a parent galaxy, it is now (probably) decoupled, and it may be gravitationally bound. We thus speculate it could be an example of a ram pressure dwarf galaxy (aka RPDG) in the making from the local collapse of abundant (stripped) gas. While in TDGs a typical molecular gas fraction is (and it may grow as more H I transforms into H2), in 001-C the dominant gas phase is likely H2.
However, in the extreme environment of the outer gas-stripped tail embedded in a hot ICM, the actual amount of molecular gas in the 001-C region may be overestimated by a galactic X-factor. Moreover, while in TDGs the efficiency of star formation was measured to be similar to spirals, it is much lower in the 001-C pointing. Also, the suggested value of star formation rate in the 001-C region (of the order of yr-1) is similar to values found in compact knots of collisional debris of interacting galaxies rather than in TDGs (Duc & Renaud, 2013). However, it could be that in 001-C we are only observing the onset of star formation. Thus, to decide whether within the 001-C pointing we are observing only a compact star-forming knot, or (for the first time) a ram pressure stripped dwarf galaxy building up, more detailed observations, including sensitive H I search, are needed to determine the total mass of the object, its kinematics, and especially its self-gravitation.
5. Gas phases in the stripped tails
In order to better understand the structure of the gas-stripped tail of ESO 137-001, in this section we will summarize and compare the fractions of different gas phases in the tail as a whole, as well as search for trends along the tail by studying local variations in the observed regions.
5.1. The whole tail of ESO 137-001
| Source | cold H2 | warm H2 | H I | H | X-rays |
| () | () | () | () | () | |
| body | aafootnotemark: | - | bbfootnotemark: | -ccfootnotemark: | 0.8 |
| tail | aafootnotemark: | 1.9 | |||
| 001-A | 6.4 | 1.3 | |||
| 001-B | 3.4 | 0.9 | |||
| 001-C | 1.8 | - | 1.4 |
In addition to our APEX detection of more than of cold molecular gas in the three observed pointings in the tail of ESO 137-001, current amounts of other gas phases in the tail have been known at least to upper limits from previous observations:
- –
-
–
No H I was detected to a limit of per beam with ATCA (Australia Telescope Compact Array, Vollmer et al., 2001) which translates to an upper limit of for the whole tails, assuming they cover about 4 times the ATCA beam size.
-
–
Up to of ionized, H emitting diffuse gas was found in the tails (Sun et al., 2007), assuming the H tail is approximated by a cylinder 40 kpc long with a diameter of 3.5 kpc, and where is the volume filling factor of the H gas that is expected to be low, as suggested from numerical simulations of ram pressure stripping where bright H emission is produced at the edges of dense neutral clouds (Tonnesen et al., 2011). For (see e.g., Sec. 8.4 in Jáchym et al., 2013), the upper limit on the amount of H emitting gas is about .
-
–
Spitzer observations revealed about of warm ( K) H2 in the galaxy and the inner 20 kpc of the tail (Sivanandam et al., 2010).
The total gas mass in the tail thus is , including the ATCA H I upper limits, while the total gas mass in the disk of ESO 137-001 is (see Table 5). It means that the amounts of ram pressure stripped gas possibly exceed the current gas mass left in the disk. Since the original (pre-stripping) gas content of the galaxy estimated from its stellar mass and an assumption of a typical gas to stellar mass ratio is (Sun et al., 2010; Sivanandam et al., 2010), it also means that the observed amount of stripped gas nearly accounts for the missing gas from the disk. The mass ratio of the most abundant phases in the whole tail, the cold-to-hot, (H2+H I)-to-X-ray, gas spans from about to , assuming the Galactic CO-to-H2 conversion factor and taking into account the H I upper limit. The amounts of cold and hot gas in the tail are thus large and similar.
Our observations show for the first time that H2, H, and X-ray emission can be at observable levels in a single ram pressure stripped tail at a large scale of several tens of kpc. This supports predictions of numerical simulations (Tonnesen et al., 2011; Tonnesen & Bryan, 2012) that further suggested that the amounts of X-ray emitting gas and the star-forming cold gas in the tail depend strongly on the surrounding ICM pressure. In their model with the thermal ICM pressure close to that at the location of ESO 137-001 (but with a lower ram pressure), the ratio of cold-to-hot components in the tail is about , and it drops to for about a two-times higher thermal pressure. Note however, that in Tonnesen et al. (2011) the cold component corresponds to gas in the temperature range of K, and the hot component to K, i.e., keV, thus not completely consistent with the observations. They also estimated that in the Norma cluster, the radius at which the ICM pressure falls below the minimum value needed for a tail to have observable X-ray emission, is kpc. This is very close to the projected distance of ESO 137-001 from the Norma center, which suggests that the galaxy may have lit up in soft X-rays rather recently.
5.2. Systematic gradient along the tail
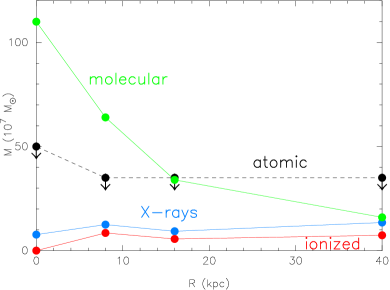
In order to understand the evolution of gas in the tail, it is of great interest to know how the balance between the different gas phases changes along the tail. It is expected that the ram pressure stripped cool gas either heats up by the surrounding hot ICM or cools via radiative cooling and transforms into molecular gas. In Table 5 and in Fig. 5, we summarize the amounts of different gas phases in the observed tail regions (APEX beams) as a function of the projected distance from the disk. We note that the lines in Fig. 5 connecting the four data points are intended to guide the eye and do not reflect real mass profiles between the observed positions. Fig. 5 clearly shows that the farther from the disk, the amount of molecular gas decreases while the amounts of diffuse ionized and X-ray emitting components stay roughly constant. We summarize the local mass ratios of individual gas phases along the tail:
-
–
The ratio of cold-to-hot (H2-to-X-ray) masses decreases from about 5 in the 001-A region to in the 001-C region, assuming a constant CO-to-H2 conversion factor.
-
–
Also the ratio of cool-to-warm ionized (H2-to-H) components along the tail decreases from in the 001-A region to in 001-C, assuming that the H volume filling factor does not change.
-
–
The ratio of hot-to-warm ionized (X-ray-to-H) masses is quite similar in all three regions and close to .
-
–
The warm-to-cold molecular gas ratio can be also followed. The region defined in Sivanandam et al. (2010) as “tail” covers about a half of the 001-A pointing and a quarter of the 001-B pointing. It contains of warm H2, while of cold H2. Thus, the warm to cold (mid-IR-to-CO) H2 mass fraction is .
The ratio of warm-to-cold molecular gas in the inner tail of ESO 137-001 is higher than in star-forming galaxies, where it usually is (Guillard et al., 2012; Nesvadba et al., 2010; Roussel et al., 2007). The observed value is close to ratios measured in cool cores of cluster and group central galaxies or in environments where molecular gas is shock or cosmic rays heated rather than UV-heated. For example, in intra-galactic medium of Stephan’s Quintet the ratio of warm-to-cold H2 was measured to by Guillard et al. (2012), who also suggested that a high heating rate in the H2 gas is probably maintained by turbulence invoked by galaxy-tidal arm collision. The observed value is consistent with shock heating (as suggested by Sivanandam et al., 2010) and possibly heat conduction from ICM as other sources of heating that must exist in the tail, other than star formation. It is likely that the diffuse component of H in the tail is not associated with star formation but is powered by shocks or other processes, such as heat conduction (Sun et al., 2007). For example, shocks from ram pressure were proposed to be responsible for elevated levels of radio continuum emission, as well as for elevated ratios of warm H2/PAH in Virgo spirals being stripped (Murphy et al., 2009; Wong et al., 2014, respectively). Consequently, the CO emission in the tail of ESO 137-001 may trace not only cold molecular gas but also warmer gas (Guillard et al., 2012) and thus the actual amount of cold H2 in the gas-stripped tail could be lower than corresponding to the standard CO-to-H2 conversion factor (e.g., Bolatto et al., 2013).
| Source | ||||||
|---|---|---|---|---|---|---|
| ESO 137-001 | 2.7 | 7.7 | 11.7 | - | - | - |
| 001-A | 2.3 | 12.5 | 3.0 | 1.9 | 38 | 1.3 |
| 001-B | 1.3 | 9.3 | 1.1 | 0.9 | 25 | 1.5 |
| 001-C | 2.1 | 13.5 | 1.1 | 1.1 | 33 | 1.9 |
The H and X-ray fluxes and masses derived for the APEX apertures are listed in Table 6. The H fluxes were derived using the case B recombination theory and we didn’t assume any intrinsic extinction for the diffuse H emission (although there may be as there is dust in the tail). A large uncertainty comes from the H emissivity and the filling factor. The X-ray masses are uncertain from the spectral model and the filling factor.
The positional coincidence of the H, X-ray, and CO emission in the tail of ESO 137-001 suggests that different gas components mutually interplay and possibly exchange energy. The origin of the observed soft X-ray emission in the tail is presumed to arise at the mixing interfaces of cold stripped ISM and the surrounding hot ICM (Sun et al., 2010; Tonnesen et al., 2011). The drop of molecular gas amounts along the tail could point to decreasing mean gas density in the tail with increasing distance (for example due to more acceleration at larger distances that makes the gas more spread out in the tail direction in its outer parts), to long timescale of heating, or to a recent increase in the ram pressure stripping strength and stripping rate that has pushed more dense gas to the inner tail regions only (see Section 6). We note that our CO observations may be biased by targeting only the H peaks. Also, changing X-factor along the tail could to some extent contribute to the decrease of molecular gas. Even so, in ESO 137-001, it is the first time that we can follow in rough outline the distribution of cold molecular gas in a ram pressure stripped tail.
6. Ram pressure stripping of ESO 137-001
The previous thorough analysis of Sivanandam et al. (2010); Sun et al. (2007, 2010) showed that ESO 137-001 is a clear case of ram pressure stripping, which is consistent with its high H I-deficiency , the undisturbed morphology of its stellar disk, and the presence of a prominent one-sided tail. Other indicators suggest that the effects of ram pressure on the galaxy may have been strong: ESO 137-001 is projected very close to the center of the Norma cluster that moreover is a rich and massive cluster. Thus, local ICM density is presumably high, as well as the galaxy’s orbital velocity. In addition, the rather low mass of ESO 137-001 makes it easier to strip. Its rotation velocity of km s-1 is lower than rotation velocities of the most studied Virgo ram pressure stripped galaxies with typically km s-1 (NGC 4522, NGC 4402; Kenney & Koopmann, 1999; Crowl et al., 2005) up to km s-1 (NGC 4330; Abramson et al., 2011).
6.1. Possible orbits
In order to estimate the ram pressure stripping history of ESO 137-001, we will first numerically study its possible orbits in the Norma cluster. Such orbits need to be consistent with the galaxy’s current position on the sky, the line-of-sight velocity, and the plane of the sky velocity direction (indicated by the projected tail direction)777The position angle of the (main) tail varies along its length – in the inner parts, both young stellar streams in the HST image and the X-ray emission show PA, while in the outer tail it is . We measure PA from North through West.. The free parameters of the model are the current l-o-s distance relative to the cluster center and velocity component in the plane of the sky. According to the measured absence of a radial velocity gradient along the tail, most of ESO 137-001’s orbital motion must be happening close to the plane of the sky, and the actual distance of the galaxy from the cluster center is thus possibly close to the projected one. The orientation of the gas-stripped tail pointing away from the cluster center then suggests that the galaxy is currently approaching pericenter.
The gravitational potential of the Norma cluster can be modeled with a Navarro-Frenk-White profile (NFW, Navarro et al., 1996) with parameters given in Table 7. This yields a cluster with and Mpc and the distribution of mass with radius that is well consistent with the values measured by Woudt et al. (2008). Since the Norma cluster is not relaxed, its dark matter distribution may be in reality bimodal, following the two interacting subclusters around giant ellipticals ESO 137-008 and ESO 137-006 (see Fig. 1). ESO 137-001 however lies outside of the central merging region. Also the distribution of ICM in the NW part of the cluster looks more symmetric than the opposite side where the X-ray emission is elongated. In our modeling ESO 137-006 was considered the cluster center (see Fig. 1) since the peak of the galaxy density distribution is located only from it (Woudt et al., 2008).
| cluster: | kpc | |
|---|---|---|
| kg m-3 | kpc | |
| galaxy: | kpcaafootnotemark: | |
| kpc | ||
| kpc |
We cover a wide range of values of the free parameters: the velocity component in the plane of the sky spans from 1000 km s-1 to 4000 km s-1 and the l-o-s distance relative to the cluster center from kpc to 600 kpc (although negative and positive distances are almost equivalent due to only small radial velocity component). For a given velocity the trend is the following: with increasing l-o-s distance the pericenter distance grows, and the apo-to-pericenter ratio decreases. Cosmological simulations (e.g., Wetzel, 2011) have suggested that galaxies at infalling to massive () host halos occur preferentially on radial orbits with an average eccentricity of , and thus a mean apo-to-pericentric ratio of . Mean pericenter and apocenter distances are and , respectively. Typical turn-around radii (where the characteristic infall velocity is equal to the Hubble flow) of radially infalling galaxies in clusters are thus several Mpc (e.g., Zu & Weinberg, 2013). ESO 137-001 is believed to be on its first infall.
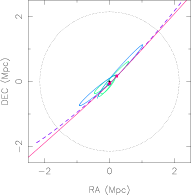
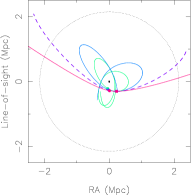
Although the velocity dispersion of km s-1 measured within Mpc radius of the Norma cluster (Woudt et al., 2008) suggests a 3D orbital velocity of km s-1, all our model runs for ESO 137-001 with velocities lower than km s-1 are too compact and do not cross the cluster virial radius. This is illustrated in Fig. 6 where model orbits with the current plane of the sky velocity component in the range from 2100 km s-1 to 3900 km s-1 are shown. Thus to reach the above typical orbital parameters of infalling galaxies in cosmological simulations, our modeling suggests ESO 137-001 to have a rather high orbital velocity km s-1. This is also supported by simulations of Tonnesen & Bryan (2008) that suggested that the relative galaxy-ICM velocities within inner kpc of a large cluster are larger than km s-1.
As a fiducial orbit for further ram pressure modeling we select the one with km s-1 and the line-of-sight distance relative to the cluster center of kpc (see the purple curve in Fig. 6) for which the pericenter distance and the peri-to-apocenter ratio are consistent with the mean values predicted for infalling galaxies from cosmological simulations. Along the fiducial orbit the galaxy currently is about 100 Myr before pericenter.
6.2. Effects of ram pressure
We will follow the effects of ram pressure on ESO 137-001 along the fiducial model orbit. By means of semi-analytic calculations we estimate how ISM parcels with different column densities react to a time varying ram pressure. We thus neglect all hydrodynamic effects, such as Kelvin-Helmholtz (KH) and Rayleigh-Taylor (RT) instabilities or gas compression that can accompany the dynamical ram pressure. The acceleration due to local ram pressure may be expressed as
| (2) |
where is the mean column density of an ISM parcel, is the vertical component of its relative velocity with respect to the surrounding ICM, and is the gravitational restoring force of the disk + bulge + halo galaxy components in the vertical direction. We then numerically solve the equation of motion (Eq. 2) along the fiducial orbit for different values of and for different disk radii. We have not accounted for the changing wind angle along the orbit and instead use a face-on wind888With the small relative radial velocity of the galaxy and its high inclination, ram pressure is expected to be operating on the galaxy close to face-on ()..
To model the ICM distribution we follow Boehringer et al. (1996) who fitted the western less disturbed part of the A3627 cluster with a -model centered on the X-ray peak located about west from ESO 137-006. The -profile parameters are given in Table 7, together with the parameters of the model galaxy. For ESO 137-001, the -band velocity-luminosity relation mag (NED) yields a rotation velocity of km s-1 (Courteau et al., 2007). Assuming a flat rotation curve this corresponds to a dynamical mass of within the observed stellar disk radius of kpc (Sivanandam et al., 2010). We assume a simple Plummer dark matter halo with the total mass of and the scale radius of 10 kpc, although the halo parameters are somewhat uncertain and the simulation is sensitive to them.
Along our fiducial orbit the galaxy is currently about 100 Myr before pericenter but due to the offset of ICM distribution from ESO 137-006, it is only about 60 Myr before peak ram pressure. Correspondingly, the current ram pressure has a high value of dyne cm-2 and the peak ram pressure will reach dyne cm-2. The FWHM of the ram pressure time profile is Myr.
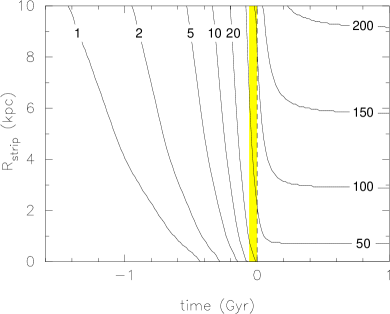
Figure 7 displays the evolution of stripping radii for ISM components with different column densities along the fiducial orbit. We consider an ISM element to be stripped when its vertical velocity exceeds the escape speed from the galaxy. Fig. 7 suggests that gas with pc-2 is currently completely stripped from the galaxy ( kpc), and that stripping has proceeded to denser gas (about pc-2) at larger disk radii. The figure also indicates the timescale of stripping. As expected, lower-density gas begins to be accelerated earlier along the orbit than more dense clumps, and also stripping proceeds from outer radii of the disk inwards. It means that a mixture of different density gas forms in the tail since denser clumps from outer radii may be stripped to similar distances at the same time as less dense gas from inner radii. The timescale for stripping depends on the ISM parcel’s column density and on its location in the disk. In Fig. 7 one can also infer how dense ISM will be stripped from the galaxy in the future after it passes through the peak ram pressure.
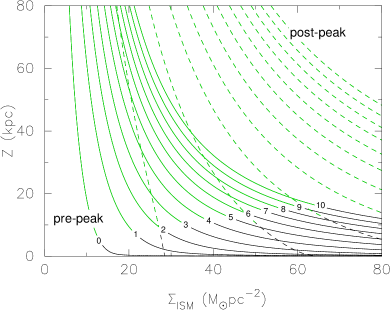
To compare the predictions of our model with the observed length of the tail of ESO 137-001, Fig. 8 displays the vertical distances that ISM elements have reached as a function of their column density and radius in the disk (solid curves). It indicates that gas with the maximum density of pc-2 (depending on radius) could currently be stripped to large distances exceeding the observed length of the ESO 137-001’s X-ray tail, while denser gas of up to pc-2 is only pushed to inner tail regions. More specifically, Table 8 gives column densities of elements stripped from different disk radii to vertical distances matching those of the whole tail length, and of the projected locations of the 001-C and 001-A regions. For comparison, situation in a symmetrical, 60 Myr post-peak time, i.e., about 120 Myr from now, is also shown in Fig. 8 (dashed curves).
| Radius in the disk: | |||
|---|---|---|---|
| Vertical distance | 2 kpc | 6 kpc | 10 kpc |
| tail (80 kpc) | 10 | 17 | 20 |
| 001-C (40 kpc) | 15 | 25 | 35 |
| 001-A (10 kpc) | 25 | 60 | 90 |
Our calculations show the effects of ram pressure on ISM with different column densities and suggest that rather dense clumps may be stripped/shifted from the disk of ESO 137-001. However, real GMCs have strong internal density gradients, and ram pressure is thus most likely able to ablate the outer portions of a cloud rather than remove it entirely (even though the cloud’s average density may be low enough to be displaced according to the model). Current observations of Galactic GMCs have suggested that column densities of dense cores of GMCs reach values of several hundreds of pc-2 while the mean column density over the whole clouds is rather low ( pc-2, Heyer et al., 2009), much lower than previously estimated by Solomon et al. (1987). Fig. 7 shows that ram pressure has likely been increasing substantially during last couple of 100 Myr and thus it is possible that ablation of clouds may have progressed into the central parts of some of them and effectively stripped them.
The exceptional features of ESO 137-001 (in comparison with most of other known RPS galaxies), such as the bright and long X-ray tail, unprecedented SF activity downstream from the galaxy, as well as the wealth of CO emission in the tail, support the idea of a recent strong ram pressure stripping. This is also suggested by the presence of dust filaments revealed in the HST and Herschel imaging since typical column densities of the dust clouds that produce significant optical extinction are at least pc-2 (Abramson & Kenney, 2014). Very recently, Ebeling et al. (2014) reported a discovery of several strongly ram pressure stripped galaxies falling into massive clusters. Similarly to ESO 137-001, these galaxies are located close ( kpc in projection) to the center of their host cluster. It is thus possible that also in these galaxies ram pressure stripping may have currently proceeded to denser ISM since H I removal is expected to take place at larger distances from the cluster center along the orbit of the infalling galaxies.
7. Discussion
In the following sections we will identify possible traces of turbulence in the tail of ESO 137-001 from kinematic structure of the detected CO lines, and we will discuss turbulence as a possible mechanism suppressing star formation in the stripped gas. Since hydrostatic pressure in galactic disks is suggested to be the key parameter that determines the transformation between atomic and molecular gas, we will compare the ICM pressure operating on ESO 137-001 with values typical in galaxies. Further, we will discuss possible origins of the detected molecular gas in the galaxy’s tail, as well as think about the evolutionary state of the ”orphan” H II regions occurring in the broad parts of the tail.
7.1. Multiple line components and the tail kinematics
While the ESO 137-001 main body CO line is only slightly asymmetric, the tail spectral lines all show substructure. Using the CLASS routine FIT we decomposed the spectra in the 001-A and 001-B positions into several Gaussian components (see Fig. 3 and Table 3) showing that the kinematics of the CO-emitting gas is rather complex, especially in the inner parts of the tail. This may reflect individual (large) condensations of dense gas possibly consistent with the observed distinct H II regions (as already suggested in Fig. 3 by blue bars showing radial velocities of the H II regions). The molecular gas masses of the individual resolved components span a range of . The FWHMs of their Gaussian fits are of the order of km s-1, i.e., km s-1 velocity dispersions (since the relationship between FWHM of a Gaussian fit and the velocity dispersion is ). These rather small values are consistent with the ongoing star formation in the spatially associated regions (star clusters) since the gas is more concentrated and possibly self-gravitating. Much better spatial and spectral resolution would be needed to further resolve smaller entities, such as individual molecular clouds whose velocity dispersions are smaller, typically km s-1, and their masses are , and diameters pc (e.g., Solomon et al., 1987).
In the observed tail regions, the CO emission is more extended in velocity than in the main body (see Fig. 3 and Table 3), especially in the 001-B pointing where individual line components are clearly distinct. While some of the velocity spread could be due to the rotational motion of the disk that will survive into the (inner) tail, we expect turbulent motions driven to the stripped ISM by the high-speed interaction between the galaxy and the surrounding ICM to be important. A turbulent velocity field was observed to develop in the stripped gas in numerical simulations due to the KH instability that leads to formation of eddy-like structures in the tail (e.g., Tonnesen & Bryan, 2010; Roediger & Hensler, 2005; Roediger et al., 2006). The typical rms turbulent velocity averaged over a galaxy’s tail is predicted to be of the order of km s-1 (e.g., Subramanian et al., 2006). For example, in the Virgo cluster galaxy NGC 4388, Yoshida et al. (2004) revealed turbulent kinematic structure of the ram pressure stripped ionized gas with abrupt velocity changes of up to km s-1. Dense gas that we detect in CO line emission possibly does not reflect the whole range of turbulent motions present in the tail of ESO 137-001.
The present observations allow us to roughly estimate the turbulent kinetic energy carried by the CO emitting gas in the tail of ESO 137-001. From , where is the molecular gas mass derived from the CO(2-1) intensity and is the 1-dimensional, l-o-s velocity dispersion measured from the (multiple) Gaussian fits of the CO(2-1) lines (see Table 3), the kinetic energies for the 001-A, 001-B, and 001-C tail positions are about erg, erg, and erg, respectively. In total, the observed CO emitting gas in the tail carries erg. For comparison, the main body position has the kinetic energy of about erg, most of its linewidth however comes from (ordered) rotational motion, not turbulent motion. This is also partly true for the tail positions as suggested from radial velocities of the H II regions (Sun et al., 2010). The total turbulent energy in the CO emitting gas in the tail thus may be lower than the above estimated value by a factor of few. For comparison, we can estimate the thermal energy of the hot ( keV; Sun et al., 2010) X-ray emitting plasma encompassed in the three observed regions in the tail of ESO 137-001 from . Assuming the beam area kpc2, the tail l-o-s width kpc, and the electron density cm-3 (Sun et al., 2010), the carried thermal energy is erg. Despite the limitations of the estimate, it suggests that the thermal energy of the hot gas is by a factor of larger than the turbulent energy of the CO emitting gas.
7.2. Molecular gas fraction vs. local pressure in the tail
The molecular-to-atomic surface density ratio () correlates in galaxies with the interstellar pressure (Blitz & Rosolowsky, 2004, 2006). In Fig. 9 we compare lower limits on measured in the observed regions of ESO 137-001 (corresponding to our APEX detections and the ATCA upper limits, see Table 5) with data from disks of nearby galaxies (Blitz & Rosolowsky, 2006; Leroy et al., 2008) in a figure adopted from Krumholz et al. (2009). In the plot we further constrain the thermal and total (thermal + ram) ICM pressure operating on ESO 137-001, corresponding to X-ray observations (Sun et al., 2010) and our simulations (Section 6). The surrounding ICM thermal pressure at the position of ESO 137-001 in A3627 is dyne cm K cm-3. The resulting area in Fig. 9 is filled with a color gradient indicating that if actual values of were known, the lower limits on in ESO 137-001 would very likely shift to higher values and thus would cover values observed in disks of nearby galaxies.
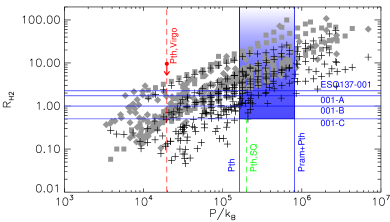
Figure 9 shows that the ICM (thermal and ram) pressure at the location of ESO 137-001 in the Norma cluster is similar to pressures operating in the completely different environments of galactic disks. This offers an explanation for the detected bulk of molecular gas in the gas-stripped tail of the galaxy. For comparison, in Fig. 9 we also indicate the value of the thermal pressure in the Virgo cluster, at the location of the ram pressure stripped dwarf galaxy IC3418. It is about an order of magnitude lower than the thermal pressure at ESO 137-001, thus suggesting much lower ratios. Consistently, an upper limit on in one of the observed regions in the outer tail of IC3418, where CO was only measured to upper limits and H I was detected (Jáchym et al., 2013; Kenney et al., 2014) is shown with the red arrow. Further, in Fig. 9 is also indicated the value of the thermal pressure of the hot plasma in the densest star-forming inter-galactic region in the X-ray brightest area (“ridge”) of the Stephan’s Quintet (Guillard et al., 2009). We note that the average thermal pressure in the Stephan’s Quintet compact group is lower than the pressures in the Norma and Virgo clusters.
Although we find that the molecular-to-atomic gas ratios in the gas-stripped tail of ESO 137-001 may be consistent with values typical in galactic disks thanks to similar pressures in the two environments, the star formation efficiency in the tail is much lower than in the galaxies (as shown in Section 4.2). Among the effects preventing star formation could be large scale turbulence driven from interaction with the surrounding ICM. Turbulence can provide further support against gravity in cold molecular clouds, leading to small SFEs. Sivanandam et al. (2010) detected pure rotational H2 transitions S(0) through S(7) in the inner tail of ESO 137-001 suggesting that indeed during momentum transfer by ram pressure, shocks are driven into the ISM which increases its thermal and turbulent pressure. Moreover, they showed that H2 S(1) emission is (in the inner tail) much more extended than m and m emission, indicating that star formation proceeds only in a part of the stripped molecular gas. This may suggest that most of the molecular gas detected in the stripping tail of ESO 137-001 is most probably not-self-gravitating due to turbulence and surviving thanks to a lack of photodissociating UV radiation. Also, magnetic fields could prevent the collapse of molecular clouds.
7.3. Origin of H2 in the tail
In this section we qualitatively discuss the origin of the molecular gas in the tail of ESO 137-001. The total H2 mass of more than revealed within the three APEX apertures in the gas-stripped tail of the galaxy is a large amount possibly exceeding the original H2 mass in the galaxy. From the scaling relation deduced for example from the COLDGASS survey (Saintonge et al., 2011) or from typical molecular gas fraction of in an Sc galaxy (Obreschkow & Rawlings, 2009), an average H2 mass of is expected in an unperturbed galaxy with the stellar mass of , although such estimates are only approximate (within a factor of few).
The origin of the molecular gas detected in the tail may be twofold. Either it has entirely formed in situ out of stripped atomic gas, or some pre-existing molecular gas contributed to it. For the in-situ formation scenario, the density of the stripped gas plays a role since it determines the timescale for condensation and H2 formation following an inverse relation (Guillard et al., 2009). Higher-density clumps can then radiatively cool down more easily and eventually form molecular gas, while the low-density stripped phase is compressed by the ICM, starts to mix with it, and likely accounts for the X-ray emitting hot gas in the tail (Tonnesen et al., 2011). Our simplified calculations in Section 6 suggested that ram pressure operating on ESO 137-001 has been strong enough to shift (or even strip) ISM clumps with column densities exceeding values typical in some molecular clouds. Since stripping proceeds (for a given disk radius) from low to high density gas, distant tail regions are more likely to host H2 that formed in situ from a lower density gas phase, while inner tail may contain also directly stripped dense, possibly molecular ISM clumps.
The question arises whether the molecular phase can survive the effects of ram pressure and thus directly contribute to the observed CO surface brightness. Molecular clouds are affected in several ways – photodissociated by the UV radiation, X-ray dissociated (as in X-ray dissociation regions, XDRs, Maloney et al., 1996), disrupted and ablated by hydrodynamic effects connected to the ram pressure stripping, or dissolved due to their limited lifetime that typically is yr (e.g., Murray, 2011). However, it can be shown that the timescales of the hydrodynamic processes are long and may be suppressed by magnetic fields (Yamagami & Fujita, 2011), as well as the UV radiation that is the dominant removal process in the stellar disks is presumably absent in the tail environment. Numerical simulations also suggested that high ram pressures compress ISM clouds making them more resistant to ablation (Tonnesen & Bryan, 2009). Consequently, it is possible that molecular clouds could survive through at least yr and indeed get by ram pressure to the (inner) tail. Sivanandam et al. (2010) also suggested that the original molecular phase in the disk may be dissociated by the shock induced by the supersonic ram pressure. Such a shock-dissociated molecular gas however is expected to reform in the tail if dust survives (e.g., Guillard et al., 2009).
The presence of dust is crucial for H2 formation. The HST (see Fig. 2, right panel; Sun et al., in prep.) and Herschel SPIRE (Sivanandam et al., in prep.) imaging indeed revealed in ESO 137-001 a dust trail emanating from the galaxy that is coaligned with its gas-stripped tail up to kpc. In summary, we suggest that the two scenarios of H2 origin likely combine in the gas-stripped tail of ESO 137-001. The wealth of CO emission observed in its inner tail may correspond to directly stripped relatively dense ISM clumps that not only are able to quickly form H2 but also may possess molecular phase that survived the effects of ram pressure. The CO emission detected in the outer tail region is then more likely to originate from in situ formation from a stripped diffuse atomic component. Some H I thus must be present in the tail of ESO 137-001. It is possible that the ATCA observations (Vollmer et al., 2001) are at the limit of detection. Data analysis is ongoing of deeper observations with ATCA (Sun et al., in prep.).
7.4. Orhpan H II regions in the broad tail
We have not observed the broad parts of the tail where “orphan” H II regions not associated with any X-ray emission occur (see the left panel of Fig. 2). However, their H luminosities are comparable to those in the central tail, suggesting that a bulk of CO emission could be present in the broad tail too. Calculations in Sec. 6 suggest that these regions were formed from relatively dense gas that was stripped from the outer disk (few ) yr earlier than equally dense gas from the inner disk. This is due to the gravitational restoring force that is weaker at larger galactocentric radii and thus a weaker ram pressure is required to strip gas of a given surface density from the outer disk than from the inner disk. However, all H II regions that are spread through the tail are of a similar age ( Myr). This suggests that star-forming H II regions are constantly forming and dying away throughout the tail, possibly due to evolution of the stripped gas. This is also seen in numerical simulations where the exact temperature and density of the stripped gas determines how long it takes before the gas cools and condenses into clouds, invoking a large spread in the height of stars above the disc (Tonnesen & Bryan, 2012). It is not clear why X-ray emission is absent in the broad tail. It may be due to too much mixing that already lowered the density of the hot gas to the point where the X-ray emissivity is low (Tonnesen et al., 2011). The orphan H II regions thus possibly represent a later evolutionary stage in a gas-stripped tail after the gas supply from part of the disk is exhausted. Then the once X-ray bright (least dense) gas is pushed to larger tail distances while the dense, star-forming regions decouple from it. At earlier stages, when there is still gas from the disk supplying the tail, the tail has a range of densities, and fast-moving low density gas can be spatially coincident with dense lumps. This is probably seen in the narrow tail.
8. Conclusions
We present new APEX 12CO(2-1) observations of ESO 137-001, a Norma cluster spiral galaxy that is currently being violently transformed from a late to an early-type by strong ram pressure stripping. A prominent 80 kpc X-ray double-structure tail extends from the galaxy, together with a 40 kpc H tail. It also contains warm H2 emission in the inner tail. ESO 137-001 is an excellent example of extreme ram pressure stripping and may become completely gas-free in the near future. Our APEX observations reveal large amounts of cold molecular gas traced by 12CO(2-1) emission in the disk of ESO 137-001 as well as in its gas-stripped tail. It is the first time that a large amount of cold H2 is found in a ram pressure stripped tail. The main results of our analysis are:
-
1.
More than of molecular gas was detected in the three APEX 230 GHz apertures along the tail of ESO 137-001, including a kpc distant intra-cluster region in its outer part where both X-ray and H emission peak. Although the X-factor is uncertain in the special environment of a gas-stripped tail, we assume the Galactic value because the metallicity measured in the tail is close to solar (). As suggested by the high warm to cold (mid-IR to CO) molecular gas mass ratio measured in the inner part of the tail, the CO emission may trace not only cold but also warmer molecular gas. Consequently, the standard value of the X-factor could overestimate the H2 content in the tail. Nevertheless, currently there may be more molecular gas in the tail of the galaxy than in its main body.
-
2.
In the most distant ( kpc) tail region, more than of H2 was revealed. Since the estimated tidal truncation radius of the galaxy is 15 kpc, the detected molecular gas may already be released from the gravitational well of the galaxy. The detected amount is similar to typical molecular masses of tidal dwarf galaxies. We speculate that a ram pressure dwarf galaxy (RPDG) could be forming in this location. More detailed observations measuring the self-gravitation of the object are needed, though.
-
3.
About of molecular gas was detected in the APEX aperture centered on the main body of ESO 137-001. This is a factor of at least less than the original molecular gas content of the galaxy, as estimated from typical amounts expected in unperturbed spiral galaxies of the same stellar mass.
-
4.
Our observations show that H2, H, and X-ray emission can be at observable levels in a single ram pressure stripped tail. The amounts of cold and hot gas in the tail are large and similar () and together nearly account for the missing original gas in the disk. Following our measurements, the amount of molecular gas decreases along the tail, while masses of other gas phases (X-ray, ionized) are roughly constant. This could correspond to a decreasing mean gas density along the tail, to long timescales of heating, or to increasing ram pressure that has been able to recently push denser gas to the inner tail regions.
-
5.
The star formation efficiency was found to be very low in the tail environment ( yr), while it is consistent with other spiral galaxies in the main body of ESO 137-001. This indicates that most of the stripped gas does not form stars but remains gaseous and ultimately joins the ICM. Similarly low SFEs are found for example in the outer disks of spiral galaxies where however H I is likely to represent most of the ISM and CO is mostly undetected. This is in contrast to the CO bright tail of ESO 137-001 where H I was measured only to upper limits. Star clusters formed in the tail from the gas accelerated by ram pressure to high velocities exceeding the escape speed from the galaxy, will contribute to the intra-cluster light population.
-
6.
The ICM thermal (+ ram) pressure at the location of ESO 137-001 in the Norma cluster is similar to midplane gas pressures that occur in the (inner) disks of galaxies. Moreover, the lower limits on the molecular-to-atomic gas ratio in the tail of ESO 137-001 (corresponding to our APEX detections and the ATCA H I upper limits) are consistent with values measured in galactic disks. Nevertheless, the star formation efficiency in the tail is much lower than in the galaxies. We suggest that this is due to a low average gas density in the tail, or turbulence driven from interaction with the surrounding ICM, preventing the stripped cold gas from star formation. The elevated ratio of warm-to-cold molecular gas in the inner tail of ESO 137-001 is close to ratios measured in cool cores of cluster and group central galaxies or in environments where molecular gas is heated by shocks or cosmic rays rather than UV-heated.
-
7.
Our semi-analytic modeling of possible orbits of ESO 137-001 in the Norma cluster indicate that the galaxy may be at a high velocity of km s-1 in order to be consistent with a first infall scenario. Consequently, the ram pressure experienced by ESO 137-001 possibly has been strong enough to shift or strip from the disk some gas clumps with column densities exceeding values found in Milky Way typical molecular clouds. Such dense gas in the tail can transform more readily into molecular gas than stripped diffuse gas. Moreover, some fraction of the stripped gas can survive in the molecular phase and contribute to the unprecedented CO brightness of the gas stripped tail of the galaxy, especially in its inner parts. The molecular gas detected in the outer tail is more likely to originate from in situ transformation of stripped diffuse atomic gas.
Future ALMA observations with high spatial resolution will enable us to study ESO 137-001 in a great detail and to better understand the process of cold gas stripping and mixing with the surrounding ICM, as well as the star formation in the special environment of a ram pressure stripped tail.
Acknowledgments
We acknowledge support by the Czech Science Foundation grant
P209/12/1795, the project M100031203 of the Academy of Sciences of the
Czech Republic, and the institutional research project RVO:67985815.
This research was further supported under Australian Research Council’s
Discovery Projects funding scheme (project number 130100664).
We thank our anonymous referee for helpful comments that improved the
quality of this paper.
This research has made use of the NASA/IPAC Extragalactic Database
(NED) which is operated by the Jet Propulsion Laboratory, California
Institute of Technology, under contract with the National Aeronautics
and Space Administration. We further acknowledge the usage of the
HyperLeda database (http://leda.univ-lyon1.fr).
Facilities: APEX (SHFI)
References
- Abramson & Kenney (2014) Abramson, A., & Kenney, J. D. P. 2014, AJ, 147, 63
- Abramson et al. (2011) Abramson, A., Kenney, J. D. P., Crowl, H. H., et al. 2011, AJ, 141, 164
- Bigiel et al. (2010) Bigiel, F., Leroy, A., Walter, F., et al. 2010, AJ, 140, 1194
- Bigiel et al. (2008) —. 2008, AJ, 136, 2846
- Bigiel et al. (2011) Bigiel, F., Leroy, A. K., Walter, F., et al. 2011, ApJ, 730, L13
- Blitz & Rosolowsky (2004) Blitz, L., & Rosolowsky, E. 2004, ApJ, 612, L29
- Blitz & Rosolowsky (2006) —. 2006, ApJ, 650, 933
- Boehringer et al. (1996) Boehringer, H., Neumann, D. M., Schindler, S., & Kraan-Korteweg, R. C. 1996, ApJ, 467, 168
- Boissier et al. (2012) Boissier, S., Boselli, A., Duc, P.-A., et al. 2012, A&A, 545, A142
- Bolatto et al. (2013) Bolatto, A. D., Wolfire, M., & Leroy, A. K. 2013, ARA&A, 51, 207
- Boselli et al. (2014) Boselli, A., Cortese, L., Boquien, M., et al. 2014, A&A, 564, A67
- Braine et al. (2001) Braine, J., Duc, P.-A., Lisenfeld, U., et al. 2001, A&A, 378, 51
- Butcher & Oemler (1978) Butcher, H., & Oemler, Jr., A. 1978, ApJ, 219, 18
- Butcher & Oemler (1984) —. 1984, ApJ, 285, 426
- Chung et al. (2009) Chung, A., van Gorkom, J. H., Kenney, J. D. P., Crowl, H., & Vollmer, B. 2009, AJ, 138, 1741
- Chung et al. (2007) Chung, A., van Gorkom, J. H., Kenney, J. D. P., & Vollmer, B. 2007, ApJ, 659, L115
- Cortese et al. (2006) Cortese, L., Gavazzi, G., Boselli, A., et al. 2006, A&A, 453, 847
- Cortese et al. (2007) Cortese, L., Marcillac, D., Richard, J., et al. 2007, MNRAS, 376, 157
- Courteau et al. (2007) Courteau, S., Dutton, A. A., van den Bosch, F. C., et al. 2007, ApJ, 671, 203
- Crowl et al. (2005) Crowl, H. H., Kenney, J. D. P., van Gorkom, J. H., & Vollmer, B. 2005, AJ, 130, 65
- Dasyra et al. (2012) Dasyra, K. M., Combes, F., Salomé, P., & Braine, J. 2012, A&A, 540, A112
- Dressler (1980) Dressler, A. 1980, ApJ, 236, 351
- Duc & Renaud (2013) Duc, P.-A., & Renaud, F. 2013, in Lecture Notes in Physics, Berlin Springer Verlag, Vol. 861, Lecture Notes in Physics, Berlin Springer Verlag, ed. J. Souchay, S. Mathis, & T. Tokieda, 327
- Dumke & Mac-Auliffe (2010) Dumke, M., & Mac-Auliffe, F. 2010, in Society of Photo-Optical Instrumentation Engineers (SPIE) Conference Series, Vol. 7737, Society of Photo-Optical Instrumentation Engineers (SPIE) Conference Series
- Ebeling et al. (2014) Ebeling, H., Stephenson, L. N., & Edge, A. C. 2014, ApJ, 781, L40
- Feldmann et al. (2012) Feldmann, R., Gnedin, N. Y., & Kravtsov, A. V. 2012, ApJ, 758, 127
- Finoguenov et al. (2004) Finoguenov, A., Briel, U. G., Henry, J. P., et al. 2004, A&A, 419, 47
- Fossati et al. (2012) Fossati, M., Gavazzi, G., Boselli, A., & Fumagalli, M. 2012, A&A, 544, A128
- Gavazzi et al. (2001) Gavazzi, G., Boselli, A., Mayer, L., et al. 2001, ApJ, 563, L23
- Guillard et al. (2009) Guillard, P., Boulanger, F., Pineau Des Forêts, G., & Appleton, P. N. 2009, A&A, 502, 515
- Guillard et al. (2012) Guillard, P., Boulanger, F., Pineau des Forêts, G., et al. 2012, ApJ, 749, 158
- Gunn & Gott (1972) Gunn, J. E., & Gott, III, J. R. 1972, ApJ, 176, 1
- Hester et al. (2010) Hester, J. A., Seibert, M., Neill, J. D., et al. 2010, ApJ, 716, L14
- Heyer et al. (2009) Heyer, M., Krawczyk, C., Duval, J., & Jackson, J. M. 2009, ApJ, 699, 1092
- Huang et al. (2012) Huang, S., Haynes, M. P., Giovanelli, R., et al. 2012, AJ, 143, 133
- Jáchym et al. (2013) Jáchym, P., Kenney, J. D. P., Ružička, A., et al. 2013, A&A, 556, A99
- Johnstone et al. (2007) Johnstone, R. M., Hatch, N. A., Ferland, G. J., et al. 2007, MNRAS, 382, 1246
- Kapferer et al. (2009) Kapferer, W., Sluka, C., Schindler, S., Ferrari, C., & Ziegler, B. 2009, A&A, 499, 87
- Kenney et al. (2014) Kenney, J. D. P., Geha, M., Jáchym, P., et al. 2014, ApJ, 780, 119
- Kenney & Koopmann (1999) Kenney, J. D. P., & Koopmann, R. A. 1999, AJ, 117, 181
- Kenney et al. (2008) Kenney, J. D. P., Tal, T., Crowl, H. H., Feldmeier, J., & Jacoby, G. H. 2008, ApJ, 687, L69
- Kenney et al. (2004) Kenney, J. D. P., van Gorkom, J. H., & Vollmer, B. 2004, AJ, 127, 3361
- Kennicutt & Evans (2012) Kennicutt, R. C., & Evans, N. J. 2012, ARA&A, 50, 531
- Kroupa & Weidner (2003) Kroupa, P., & Weidner, C. 2003, ApJ, 598, 1076
- Krumholz et al. (2009) Krumholz, M. R., McKee, C. F., & Tumlinson, J. 2009, ApJ, 693, 216
- Lee et al. (2013) Lee, J. C., Hwang, H. S., & Ko, J. 2013, ApJ, 774, 62
- Lee et al. (2009) Lee, J. C., Gil de Paz, A., Tremonti, C., et al. 2009, ApJ, 706, 599
- Leroy et al. (2008) Leroy, A. K., Walter, F., Brinks, E., et al. 2008, AJ, 136, 2782
- Leroy et al. (2009) Leroy, A. K., Walter, F., Bigiel, F., et al. 2009, AJ, 137, 4670
- Machacek et al. (2005) Machacek, M., Dosaj, A., Forman, W., et al. 2005, ApJ, 621, 663
- Maloney et al. (1996) Maloney, P. R., Hollenbach, D. J., & Tielens, A. G. G. M. 1996, ApJ, 466, 561
- Murphy et al. (2009) Murphy, E. J., Kenney, J. D. P., Helou, G., Chung, A., & Howell, J. H. 2009, ApJ, 694, 1435
- Murray (2011) Murray, N. 2011, ApJ, 729, 133
- Navarro et al. (1996) Navarro, J. F., Frenk, C. S., & White, S. D. M. 1996, ApJ, 462, 563
- Nesvadba et al. (2010) Nesvadba, N. P. H., Boulanger, F., Salomé, P., et al. 2010, A&A, 521, A65
- Nulsen (1982) Nulsen, P. E. J. 1982, MNRAS, 198, 1007
- Obreschkow & Rawlings (2009) Obreschkow, D., & Rawlings, S. 2009, MNRAS, 394, 1857
- Paturel et al. (2003) Paturel, G., Petit, C., Prugniel, P., et al. 2003, A&A, 412, 45
- Quilis et al. (2000) Quilis, V., Moore, B., & Bower, R. 2000, Science, 288, 1617
- Roediger et al. (2006) Roediger, E., Brüggen, M., & Hoeft, M. 2006, MNRAS, 371, 609
- Roediger & Hensler (2005) Roediger, E., & Hensler, G. 2005, A&A, 433, 875
- Roussel et al. (2007) Roussel, H., Helou, G., Hollenbach, D. J., et al. 2007, ApJ, 669, 959
- Ruszkowski et al. (2014) Ruszkowski, M., Brüggen, M., Lee, D., & Shin, M.-S. 2014, ApJ, 784, 75
- Saintonge et al. (2011) Saintonge, A., Kauffmann, G., Kramer, C., et al. 2011, MNRAS, 415, 32
- Salomé et al. (2011) Salomé, P., Combes, F., Revaz, Y., et al. 2011, A&A, 531, A85
- Scott et al. (2012) Scott, T. C., Cortese, L., Brinks, E., et al. 2012, MNRAS, 419, L19
- Scott et al. (2010) Scott, T. C., Bravo-Alfaro, H., Brinks, E., et al. 2010, MNRAS, 403, 1175
- Sivanandam et al. (2010) Sivanandam, S., Rieke, M. J., & Rieke, G. H. 2010, ApJ, 717, 147
- Smith et al. (2010) Smith, R. J., Lucey, J. R., Hammer, D., et al. 2010, MNRAS, 408, 1417
- Solomon et al. (1987) Solomon, P. M., Rivolo, A. R., Barrett, J., & Yahil, A. 1987, ApJ, 319, 730
- Subramanian et al. (2006) Subramanian, K., Shukurov, A., & Haugen, N. E. L. 2006, MNRAS, 366, 1437
- Sun et al. (2010) Sun, M., Donahue, M., Roediger, E., et al. 2010, ApJ, 708, 946
- Sun et al. (2007) Sun, M., Donahue, M., & Voit, G. M. 2007, ApJ, 671, 190
- Sun et al. (2006) Sun, M., Jones, C., Forman, W., et al. 2006, ApJ, 637, L81
- Sun & Vikhlinin (2005) Sun, M., & Vikhlinin, A. 2005, ApJ, 621, 718
- Tonnesen & Bryan (2008) Tonnesen, S., & Bryan, G. L. 2008, ApJ, 684, L9
- Tonnesen & Bryan (2009) —. 2009, ApJ, 694, 789
- Tonnesen & Bryan (2010) —. 2010, ApJ, 709, 1203
- Tonnesen & Bryan (2012) —. 2012, MNRAS, 2609
- Tonnesen et al. (2011) Tonnesen, S., Bryan, G. L., & Chen, R. 2011, ApJ, 731, 98
- van der Wel et al. (2010) van der Wel, A., Bell, E. F., Holden, B. P., Skibba, R. A., & Rix, H.-W. 2010, ApJ, 714, 1779
- Vollmer et al. (2005) Vollmer, B., Braine, J., Combes, F., & Sofue, Y. 2005, A&A, 441, 473
- Vollmer et al. (2008) Vollmer, B., Braine, J., Pappalardo, C., & Hily-Blant, P. 2008, A&A, 491, 455
- Vollmer et al. (2001) Vollmer, B., Cayatte, V., van Driel, W., et al. 2001, A&A, 369, 432
- Vollmer et al. (2012) Vollmer, B., Wong, O. I., Braine, J., Chung, A., & Kenney, J. D. P. 2012, A&A, 543, A33
- Wang et al. (2004) Wang, Q. D., Owen, F., & Ledlow, M. 2004, ApJ, 611, 821
- Wetzel (2011) Wetzel, A. R. 2011, MNRAS, 412, 49
- Wong et al. (2014) Wong, O. I., Kenney, J. D. P., Murphy, E. J., & Helou, G. 2014, ApJ, 783, 109
- Wong & Blitz (2002) Wong, T., & Blitz, L. 2002, ApJ, 569, 157
- Woudt et al. (2008) Woudt, P. A., Kraan-Korteweg, R. C., Lucey, J., Fairall, A. P., & Moore, S. A. W. 2008, MNRAS, 383, 445
- Wyder et al. (2009) Wyder, T. K., Martin, D. C., Barlow, T. A., et al. 2009, ApJ, 696, 1834
- Yagi et al. (2013) Yagi, M., Gu, L., Fujita, Y., et al. 2013, ApJ, 778, 91
- Yagi et al. (2007) Yagi, M., Komiyama, Y., Yoshida, M., et al. 2007, ApJ, 660, 1209
- Yamagami & Fujita (2011) Yamagami, T., & Fujita, Y. 2011, PASJ, 63, 1165
- Yoshida et al. (2004) Yoshida, M., Ohyama, Y., Iye, M., et al. 2004, AJ, 127, 90
- Yoshida et al. (2008) Yoshida, M., Yagi, M., Komiyama, Y., et al. 2008, ApJ, 688, 918
- Zu & Weinberg (2013) Zu, Y., & Weinberg, D. H. 2013, MNRAS, 431, 3319