High Spatial Resolution of the Mid-Infrared Emission of Compton-Thick Seyfert 2 Galaxy Mrk 3
Abstract
Mid-infrared (MIR) spectra observed with Gemini/Michelle were used to study the nuclear region of the Compton-thick Seyfert 2 (Sy 2) galaxy Mrk 3 at a spatial resolution of 200 pc. No polycyclic aromatic hydrocarbons (PAHs) emission bands were detected in the N-band spectrum of Mrk 3. However, intense [Ar iii] 8.99 m, [S iv] 10.5 m and [Ne ii] 12.8 m ionic emission-lines, as well as silicate absorption feature at 9.7m have been found in the nuclear extraction (200 pc). We also present subarcsecond-resolution Michelle N-band image of Mrk 3 which resolves its circumnuclear region. This diffuse MIR emission shows up as a wings towards East-West direction closely aligned with the S-shaped of the Narrow Line Region (NLR) observed at optical [O iii] 5007Å image with Hubble/FOC. The nuclear continuum spectrum can be well represented by a theoretical torus spectral energy distribution (SED), suggesting that the nucleus of Mrk 3 may host a dusty toroidal structure predicted by the unified model of active galactic nucleus (AGN). In addition, the hydrogen column density (N cm-2) estimated with a torus model for Mrk 3 is consistent with the value derived from X-ray spectroscopy. The torus model geometry of Mrk 3 is similar to that of NGC 3281, both Compton-thick galaxies, confirmed through fitting the 9.7m silicate band profile. This results might provide further evidence that the silicate-rich dust can be associated with the AGN torus and may also be responsible for the absorption observed at X-ray wavelengths in those galaxies.
keywords:
galaxies: Seyfert – galaxies: individual, Mrk3 – infrared: ISM – ISM: molecules – ISM: dust, extinction – techniques: spectroscopic1 Introduction
The currently favoured unified models of active galactic nucleus (AGN) are “orientation-based models”. They propose that the differences between different classes of objects arise because of their different orientations to the observer. These models propose the existence of a dense concentration of absorbing material in their central engine in a toroidal distribution, which blocks the broad line region (BLR) from the line of sight in Type 2 objects (see Antonucci, 1993; Urry & Padovani, 1995, for a review ). However, a not well understood, but key issue in AGN physics is the composition and nature of this dusty torus.
For example, several of these models predict that the silicate emission/absorption features at 9.7m and 18m are related to the observers viewing angle, in the framework of the AGN unified model (e.g. Pier & Krolik, 1992; Granato & Danese, 1994; Granato et al., 1997; Rowan-Robinson, 1995; Nenkova et al., 2002, 2008a, 2008b; Schartmann et al., 2005, 2008; Dullemond & van Bemmel, 2005; Fritz et al., 2006; Hönig et al., 2006; Hönig & Kishimoto, 2010; Stalevski et al., 2012; Heymann & Siebenmorgen, 2012; Efstathiou et al., 2013, and references therein). The strengths of these features are sensitive to the dust distribution and could be a direct evidence of a connection between mid-infrared (MIR) optically-thick galaxies and Compton-thick AGNs (see Shi et al., 2006; Mushotzky et al., 1993; Wu et al., 2009; Georgantopoulos et al., 2011). In fact, we fitted the silicate feature at 9.7m of the Compton-thick NGC 3281 (Sales et al., 2011), using the clumpy torus models (Nenkova et al., 2002, 2008a, 2008b), and found that the hydrogen column density derived from silicate profile is similar to that derived from X-Ray spectrum originally employed to classify this galaxy as Compton-thick source (see also Shi et al., 2006; Mushotzky et al., 1993; Thompson et al., 2009).
Such result is further supported by the finding of Shi et al. (2006) which using observations of 9.7m silicate features in 97 AGNs found that the strength of the silicate feature correlates with the Hi column density estimated from fitting the X-ray data, with high Hi columns corresponding to silicate absorption while low ones correspond to silicate emission. On the other hand, Thompson et al. (2009), for instance, suggested that even more informative than the 9.7m feature alone the combination of it with the 18m silicate feature reveals the geometry of the reprocessing dust around the AGNs, discriminating between smooth and clumpy distributions (see also Sirocky et al., 2008), moreover, comparing 31 Sy 1 spectra obtained with IRS of 21 higher luminosity QSOs, these authors conclude that the weak emission lines observed are a consequence of clumpy AGN surroundings. In addition, Goulding et al. (2012) studying the 20 nearest bona fide Compton-thick AGNs with hard X-ray measurements, shows that only about half of nearby Compton-thick AGNs have strong Si-absorption features and conclude that the dominant contribution to the observed MIR dust extinction observed is not solely related to the compact dusty obscuring structure surrounding the central engine but it can be originated from the host galaxy instead.
This paper is a part of a project that investigate the possibility that the presence of a silicate absorption feature at 9.7m would be a signature of an heavily obscured AGN, we present here a study of the nuclear spectrum of Mrk 3, a SB0 galaxy hosting an optically classified Seyfert 2 (Sy 2) nucleus with a BLR detected in polarized light (Adams, 1977; Miller & Goodrich, 1990; Tran, 1995; Collins et al., 2005). Capetti et al. (1995) show that the narrow line region (NLR) of Mrk 3 has a S-shaped morphology, extended over nearly 2″, with a large number of resolved knots. They suggest that this morphology may be a consequence of the strong interaction between the NLR with the radio emission plasma (see Capetti et al., 1995; Ruiz et al., 2001; Schmitt et al., 2003a).
It is also known that Mrk 3 has a complex X-ray spectrum with heavily-absorbed, and cold reflection components, accompanied by a strong iron K line at 6.4 keV (Awaki et al., 1991, 2008; Cappi et al., 1999; Turner et al., 1997; Sako et al., 2000). Awaki et al. (2008) obtained an intrinsic 2-10 keV luminosity of erg s-1, and suggested it was direct emission from Mrk 3. In addition, they found that there is a heavily absorbed dust/gas component of N cm-2 obscuring the direct line of sight to the nucleus, and lead them to classify Mrk 3 as a Compton-thick galaxy (see also Awaki et al., 1990, 1991; Iwasawa et al., 1994; Sako et al., 2000).
Nevertheless, the derived value of the hydrogen column density of Mrk 3 is arguable, in the light of studies developed by Winter et al. (2009), who have shown that this target reveals a complex X-ray spectrum and a peculiar position in the color-color diagram of versus , suggesting that its has high column density with a complex changin-look (see Winter et al., 2009, for more details).
In this paper we present ground based, high spatial resolution, MIR spectra of the Compton-thick galaxy Mrk 3. Such observation allowed the dust distribution to be studied in the central 200 pc of this galaxy. As stated above the main goal is to investigate if the presence of a silicate absorption feature at 9.7m of Mrk 3 can be interpreted as a signature of an heavily obscured AGN caused by the dusty torus of the unified model. In addition, we briefly discuss the connection of dusty torus material with Compton-thick scattering material found in Sy 2 Mrk 3 and NGC 3281.
2 Observations and Data Reduction
Michelle is a MIR (m) imager and spectrometer with a 320240 pixels Si:As IBC array. When configured as a long slit spectrometer it a plate scale of 0183/pixel and a 216 long slit. The low-resolution () long slit mode was used, with the 2-pixel wide (0366) slit, resulting in a dispersion of 0.024 m pixel-1 and a spectral resolution of 0.08m. The spectral coverage is 7m centred at 9.5m. The total on-source integration time was 10 minutes.
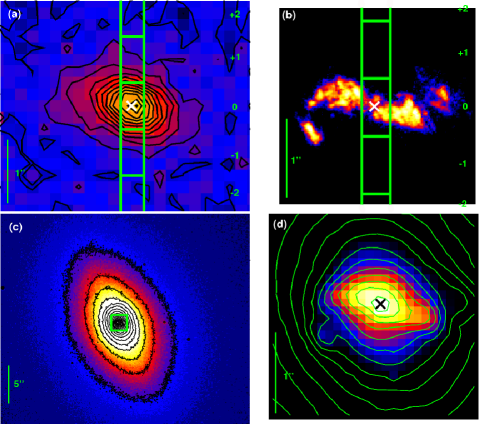
The data were obtained in queue mode at Gemini North, in 2010 February 05 UT, as part of program GN-2009B-Q-61 (PI: Pastoriza, M.). We obtained acquisition images with on-source time roughly 5s through the -band and Mrk 3 was observed under clear conditions (photometric/cloudless), with precipitable waver vapour (PWV) in range of 2.3mm or less. The long-slit orientation, as well as the extraction area of each spectrum are superposed upon the -band acquisition and [O iii] 5007Å (Schmitt et al., 2003b) images of Mrk 3 (Fig. 1a,b). We also present in Figure 1c, the HST/WFPC2 archive optical continuum image (F814W filter, Program 8645, PI: Windhorst, R.). The green box overplotted on this panel represents the field of view of 25x25 and its amplification is shown in Fig. 1d.
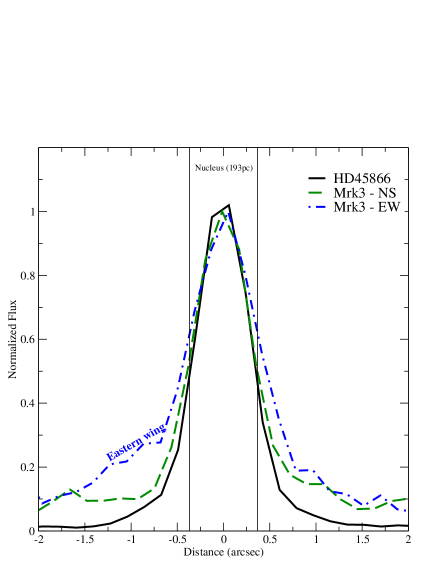
The image quality was measured from the -band acquisition image of the telluric standard HD45866 and turns out to be 07 (Fig. 2). In the same figure, we have also shown the spatial emission profile of Mrk 3 from two directions, North to South (dash line) and East to West one (dash-dot line). Note that the spatial profile of the North to South (N-S) direction corresponds to our chosen position of the Michelle’s long slit (see Fig. 1). Both emission profiles, the N-S and East to West (E-W) directions, were normalized using the average flux of the two central pixels (0366) of Mrk 3.
A standard chop/nod technique was used to remove time-variable sky background, telescope thermal emission, and the effect of 1/f noise from the array/electronics. The long-slit was oriented along P.A. = 0° with a chop throw of 15″, oriented along P.A. = 90°, which includes only the signal of the guided beam position in the frame and avoid possible nod effects in the spatial direction. The same slit position/nod orientations were used for the telluric standards.
Data reduction employed the midir and gnirs sub-packages of Gemini IRAF 111IRAF is distributed by the National Optical Astronomy Observatory, which is operated by the Association of Universities for Research in Astronomy (AURA), Inc., under cooperative agreement with the National Science Foundation. package. The final spectrum was extracted from the combined the chop- and nod-subtracted frames using the tasks tprepare and mistack. Wavelength calibration was obtained from the skylines in the raw frames. Removal of the telluric absorption lines from the galaxy spectrum, and the flux calibration were performed using the mstelluric task, selecting HD 45866 (Cohen et al., 1999) as telluric standard, observed immediately after the science target.
As seen in Fig. 2, Mrk 3 has a luminosity profile similar to that of the point like source meaning that the bright AGN emission could dominate the total emission, however, there can be a contamination of an issuance arising from an extranuclear location. In the light of these thought, we performed two extraction from the 2D-spectral image of Mrk 3 aiming estimate the contribution of the host galaxy around the AGN.
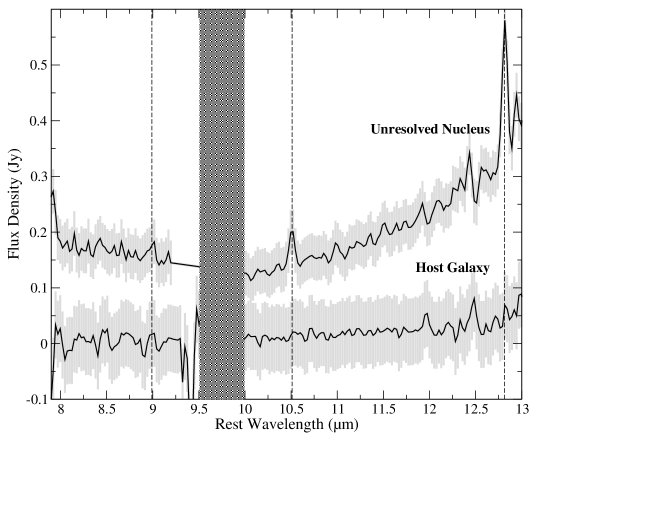
Therefore, first extraction was taken as the stellar FWHM (an apertures of four pixels or 0732 which correspond to 193 pc for a distance of 55Mpc, using = 74 km s-1 Mpc-1) and the other one is a spectrum of the whole emission available on the Michelle’s long-slit (1 kpc). The host galaxy emission spectrum was derived by multiplying the central spectrum by a constant 1.314, further subtracting the result from the spectrum of the largest possible aperture. This accounts for the infinite aperture correction of the FWHM extraction of Gaussian profile (see Ruschel-Dutra et al., 2014). We show in Fig. 3 both the nuclear and host galaxy spectra. The nuclear spectrum, unresolved point like source, was chosen to be centred at the peak of the continuum at m which also coincides with the optical peak (see Fig. 1).
The unresolved central spectrum of Mrk 3 clearly reveals the silicate absorption feature at 9.7m as well as prominent forbidden lines of [Ar iii] 8.9 m, [S iv] 10.5 m and [Ne ii] 12.8 m, although the PAH emission is completely absent (Fig. 3). The corresponding spectrum of the host galaxy neither provides emission lines nor silicate features, but this spectrum really shows low signal to noise to drive any conclusive analysis.
3 Results and Discussion
3.1 Acquisition Image of Mrk 3: Mid-Infrared Emission in the Narrow Line Region
As it can be seen in Fig. 1a, Mrk 3 shows resolved prominent wings with extended emission in a roughly East to West direction centred on the unresolved nucleus. This emission lobe has a position angle (P.A.) of 70∘ and the easterly wing extended within 1.5″, while the westerly minor knot is elongated to 0.7″. The emission in N-S direction is unresolved with a FWHM quite similar to that of the telluric star, 07, which might suggest that the bulk of emission perpendicular to the wing direction is dominated by the central unresolved bright source implying that the putative torus can be the source of the central emission (see Section 4). On the other hand, we should note that the spatial resolution of the data is not sufficient to resolve the compact () point-like source on the N-S direction meaning that the torus emission could come from smaller region, pursuant to we need data with higher spatial resolution to address this assumption.
Mrk 3 is a Sy 2 galaxy with a spectacular S-shaped NLR in [O iii] 5007Å emission image (Fig. 1). Its biconical region is extended toward 2″along the E-W direction and has been interpreted as the result of a rapid expansion of a cocoon of hot gas heated by radio emission (Capetti et al., 1995; Schmitt et al., 2003a). Curiously our -band acquisition image (Fig. 1ab) mimics a cylindrical shell aligned with the ionization cone of [O iii] 5007Å line. The same assumption can be drawn from the collapsed emission profile (Fig. 2) measured in the central 0366 along to E-W direction. It is also notable that the Eastern wing is the brightest and the most extended emission, 1″, of Mrk 3 at N-band wavelength. Both, the spatial position and open angle of this emission feature, from N-band coincide with enhanced east wing presents in the HST image of [O iii] 5007Å emission line.
The -band emission structure is also spatially enclosed within the extended emission present in the optical continuum image of the HST/WFPC2 F814W filter (see Fig. 1cd). In order to highlight the extended NLR we also overploted contours on the optical continuum within the same field of view (25 x 25) of [O iii] 5007Å image. The spatial coincidence of the extended MIR emission with the observed size of the high excitation emission region might suggest that the dust present in the NLR of Mrk 3 contributes to N-band emission. Indeed, the dust located within the ionization cone which maybe heated by the central engine can contribute to the emission at MIR wavelength as it has been observed in several other AGNs (e.g. Reunanen et al., 2010; Mason et al., 2006; Packham et al., 2005; Radomski et al., 2002, 2003).
| Radius | Flux Density | Surface Brightness | Total Flux |
|---|---|---|---|
| (arcsec) | (Jy) | (Jy arcsec-2) | (percent) |
| 0.366 | 0.21 | 0.51 | 36% |
| 0.732 | 0.44 | 0.26 | 73% |
| 1.098 | 0.55 | 0.15 | 91% |
| 1.464 | 0.59 | 0.09 | 97% |
| 1.83 | 0.60 | 0.06 | 100% |
| Errors in the flux calibration are accurate to be roughly 15% | |||
| according to Mason et al. (2006); Packham et al. (2005). | |||
In Table 1 are listed the N-band flux density and surface brightness measured with aperture upon different radius (see column 1). From these values, we can detected two region of emitting dust. The brightest one arise from the central 0366 ( pc) region which contributed with 36% of the total flux measured inside radius of 183, as well as with the bulk of the N-band emission (surface brightness 0.51 Jy arcsec-2, see column 3 in Tab. 1). This result suggests that such component which dominates the unresolved point like source might emerge from the dusty torus predicted by unified model (see also Packham et al., 2005; Radomski et al., 2002, 2003). We call the attention that the used spatial resolution does not resolve the torus emission, thus the Silicate emission comes from the central 200 pc. But it is clear that outside this region the emission of Silicate if it exists, is less than the detection limit of our Gemini/Michelle data.
The acquisition N-band image also shows a second component that is a extended diffuse emission with lower surface brightness extending up to 800 pc from the nucleus. This extended emission, which coincides with the NLR seen in the HST image of [O iii] 5007Å (Fig. 1), is therefore probably due to the dust emission located in the NLR and heated by the central source of Mrk 3.
3.2 Silicate absorption and Emission Lines Measurements
According to Hao et al. (2007), the presence of silicate absorption feature at 9.7m and no evidence of PAH emission bands could be interpreted as a galaxy with a heavily obscured active nucleus (see also Shi et al., 2006; Mushotzky et al., 1993; Thompson et al., 2009; Sales et al., 2010, 2011). This picture seems to be the case of our nuclear spectrum of Mrk 3 (Fig. 3) which presents a clear absorption feature at 9.7m, as well as strong ionic lines at [Ar iii] 8.9 m, [S iv] 10.5 m and [Ne ii] 12.8 m, but no PAH have been observed.
On the other hand, the high resolution extended spectrum of Mrk 3 obtained with Gemini/Michelle does not reveal such increase in flux, setting not only a lower limit for the galactocentric distance of the dust emission observed by Spitzer/IRS, but also corroborate with the claim that the AGN torus of Mrk 3 is constrained within the central pc extraction.
Following the procedure described by Spoon et al. (2007), we adjusted a liner continuum centred at 8 and 12.5m to derive the intrinsic, unobscured, AGN flux at 9.7m. From that, the apparent strength () of the silicate absorption has been calculated as:
| (1) |
where and are the observed and the intrinsic AGN unobscured fluxes, respectively. Subsequently, we estimated the silicate optical depth, , by the correlation of (Nenkova et al., 2008b). The apparent optical extinction attributed to silicate dust can be inferred from A = 18.5 2 mag (Draine, 2003). The resulting values are listed in Tab. 2.
We estimated a value of = to the unresolved nucleus of Mrk 3. This value is consistent with the average value observed in Sy 2 galaxies (, see Fig. 2 of Hao et al., 2007). From we derived an optical dust extinction of A = 9.6 0.51 mag.
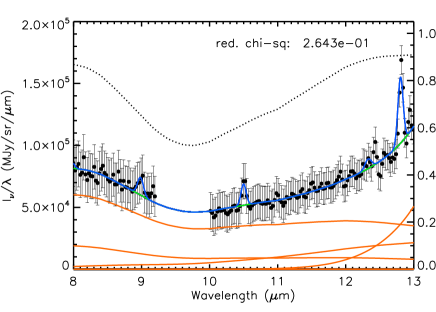
In order to disentangle the contribution from each component in the spectral energy distribution (SED) of Mrk 3 as a function of the distance to the nucleus, we used the pahfit 222Source code and documentation for pahfit are available at http://tir.astro.utoledo.edu/jdsmith/research/pahfit.php IDL routines (Smith et al., 2007). This code decomposes the spectrum as continuum emission from dust and starlight, emission lines, individual and blended PAH emission bands, and also assumes that the light is attenuated by extinction due to silicate grains. The code uses the dust opacity law of Kemper et al. (2004), and the infrared extinction is considered as a power law plus silicate features peaking at 9.7 m.
The pahfit code requires information of the uncertainties, and here those were assumed to be the root-mean-square deviation (RMSD) estimated from the whole spectral range of Michelle’s N-band presented as a grey shaded regions in Fig. 3. Since the spectra do not show PAH emission, this component was not included in the fitting (see Sales et al., 2011). The resulting spectral decomposition of the nuclear extraction of Mrk 3 is shown in Fig. 4, and the fluxes derived to the emission lines are given in Tab. 2.
The unresolved nucleus shows = 1.460.4. Inspecting the measured dust extinction (AV) values obtained using pahfit, one can see that it is larger than those inferred from the Ssil. Such difference arises because the Ssil are obtained from the peak of the silicate feature at 9.7m while the pahfit code takes into account the whole silicate profile (m). Note that the optical depth values are similar to those found in other Seyfert galaxies (Gallimore et al., 2010).
| Features | (m) | Centre |
|---|---|---|
| F [Ar iii] | 8.9 | 7.82 1.9 |
| EW [Ar iii] | 8.9 | 0.039 |
| F [S iv] | 10.5 | 7.60 1.8 |
| EW [S iv] | 10.5 | 0.051 |
| F [Ne ii] | 12.8 | 13.2 2.5 |
| EW [Ne ii] | 12.8 | 0.055 |
| Ssil | 9.7 | -0.52 0.21 |
| A | - | 9.6 0.51 |
| a | 9.7 | 1.46 0.4 |
| AV a | - | 27 0.4 |
| Fluxes are in units of 10-4 W m-2 sr-1. | ||
| EWs are in m. | ||
| a Values derived from pahfit code. | ||
4 Dusty Torus Constraints from the Central Region of Mrk 3
In the unified model for AGN, the presence of a nuclear toroidal structure composed by dust/gas-rich matter, mainly silicate and graphite, is postulated to attenuate the nuclear emission at UV/optical wavelengths and re-emit it in the MIR, which leave unmistakable signatures in the observed SEDs. While the sublimation of the graphite grains creates IR emission at m, the 9.7m feature observed in emission/absorption is attributed to silicate grains (e.g. Barvainis, 1987; Pier & Krolik, 1992; Granato & Danese, 1994; Siebenmorgen et al., 2005; Fritz et al., 2006; Rodríguez-Ardila & Mazzalay, 2006; Riffel et al., 2006, 2009). Some authors consider the torus as a continuous density distribution (e.g. Pier & Krolik, 1992; Granato et al., 1997; Siebenmorgen et al., 2004; Fritz et al., 2006), but it has been postulated that, for dust grains to survive in the torus environment, they should be shielded within clumpy structure (Krolik & Begelman, 1988), which simultaneously provides a natural attenuation of the silicate feature (e.g. Nenkova et al., 2002, 2008a, 2008b; Hönig et al., 2006).
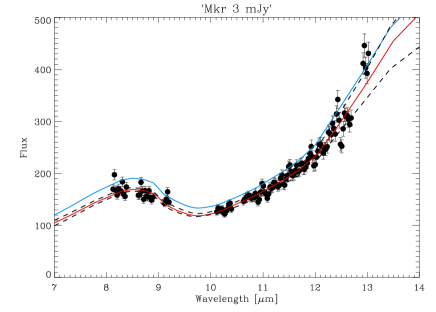
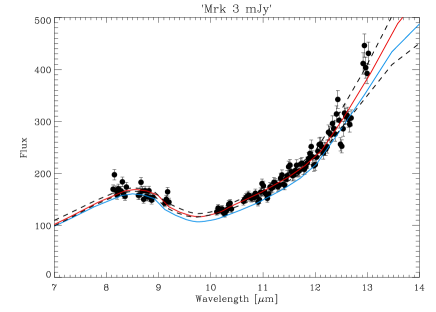
As can be noted on Fig. 2 the emission profile within two central pixels (0366, the same width of Michelle long-slit) is quite similar to that of the telluric standard HD 45866 showing that the dust emission in the NLR is not resolved at this spatial resolution. However, we may infer worth information modelling the emission from the unresolved nucleus. With this purpose, after masking the emission lines and the telluric band region (Fig.3) using a simple interpolation we subsequently compared the unresolved spectrum to clumpy333The models are available at http://www.pa.uky.edu/clumpy/ theoretical SEDs (Nenkova et al., 2002, 2008a, 2008b). These models assume a complex clumpy dust distributions of the toroidal geometry of AGN unified scheme which is constrained by six parameters (i) number of dusty clouds along to the torus equatorial ray, ; (ii) the visual optical depth of each clump, ; (iii) radial extension of the clumpy distribution, , where and are the outer and inner torus radii, respectively; (iv) the radial distribution of clouds as described by a power law ; (v) the torus angular width follows a Gaussian angular distribution described by a half-width ; (vi) the observer’s viewing angle .
In order to constrain the six torus parameters from clumpy model we used the BayesCLUMPY tool developed by Asensio Ramos & Ramos Almeida (2009). Its statistic methodology is based on Bayesian inference framework and performs a Markov Chain Monte Carlo (MCMC) search over the parameter grid. This approach has become commonplace for SED fitting because of its economy and efficiency over an exhaustive search of large parameter spaces.
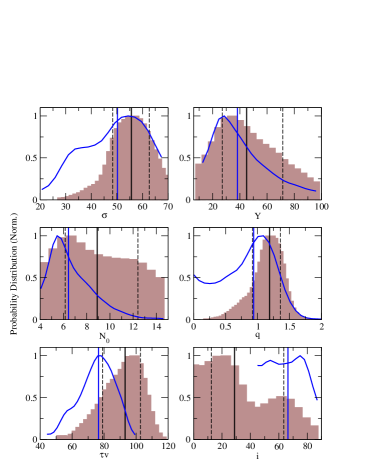
BayesCLUMPY takes into account the first 13 eigenvectors of the principal component analysis, which is a very good representation of the whole model grid of clumpy SED database (see Asensio Ramos & Ramos Almeida, 2009), to describe the observed spectra. The marginalized probability distributions are assessed as histograms of the Markov Chain for each parameter derived from the automatic marginalization properties of the MCMC technique. We perform two running sets (Fig. 5), the first one used all six torus parameters as free while the second run limited the observer’s line of sight angle to be 45∘ (see Alonso-Herrero et al., 2011, for details). The stability of the solution has been confirmed by consecutive runs of the algorithm and the results are shown in Fig. 6 and Tab. 3.
| Parameter | Best Fita | 68% confidence interval | |
|---|---|---|---|
| Upper | Lower | ||
| Angular width () | 56∘ | 48∘ | 63 |
| Radial thickness () | 45 | 27 | 71 |
| Number of clouds () | 9 | 6 | 12 |
| Index of radial density () | 1.18 | 0.92 | 1.35 |
| Observer angle () | 29∘ | 12∘ | 63∘ |
| Cloud optical depth () | 93 mag | 79 mag | 103 mag |
| Observer angle constrained as edge-on view () | |||
| Angular width () | 50∘ | 35∘ | 61∘ |
| Radial thickness () | 38 | 25 | 63 |
| Number of clouds () | 6 | 5 | 9 |
| Index of radial density () | 0.94 | 0.39 | 1.25 |
| Observer angle () | 66∘ | 53∘ | 70∘ |
| Cloud optical depth () | 76 mag | 64 mag | 87 mag |
| aThe value parameters that maximizes their probability (MAP) | |||
| distributions | |||
Following our approach the clumpy model was able to reproduce very well the -band spectrum of Mrk 3 using either observer view angle, , as free parameter (first run) or fixed in Sy 2 edge-on view (second run, Fig. 5 and Tab. 3) predicted by the unified model of AGN (Antonucci, 1993). These modelling claim a presence of an embedded AGN surrounding by a dusty toroidal structure constraining the radial thickness to = 45, as free, or 38 to edge-on view. The first runs turned out that the Mrk 3’s torus has 9 dusty clouds in its equatorial radius with the individual clouds presenting an optical depth of = 93 mag, while the best fit on the second run was reached with 6 clouds, with = 76 mag instead.
Once we have forced the observer’s line of sight to vary between 45 and 90∘, following the assumption that Sy 2 is always viewed close to the torus’s plane, the parameter turns roughly 66 degree, while using as free parameter we reached degree. The hydrogen column density along the observer’s view is estimated by adopting a hydrogen column density of N cm-2 (upper limit value) for each cloud (Nenkova et al., 2002, 2008a, 2008b) and the number of cloud over the observer line of sight as follows
| (2) |
leading to an upper limit value of cm-2 and 4.8 cm-2 using results from the first and second runs (see Fig. 6 and Tab. 4).
Using the equation (Nenkova et al., 2008b):
| (3) |
and adopting a dust sublimation temperature of 1500 K we obtained the torus size as roughly 8 pc and 7 pc from run 1 and 2, respectively.
| Parameter | ||
|---|---|---|
| Bolometric Luminosity, Lbol (erg/s) | 1.82 | 2.17 |
| X-ray luminosity, LX-ray (erg/s) | 9.1 | 1.35 |
| Hydrogen column density, N (cm-2) | 2.7 | 4.8 |
| Direct view of AGN, Pesc (%) | 6 | 0.85 |
| Inner radius of torus, Rd (pc) | 0.17 | 0.19 |
| Outer radius of torus, R0 (pc) | 7.68 | 7.08 |
The scale amplitude of the clumpy model best fit to the N-band observed spectrum turns out the bolometric flux of the AGN. From these, we derived a bolometric luminosity of Lbol = 1.82 erg s-1 for the first run and Lbol = 2.17 erg s-1 using the second one. In order to compare with X-ray observations we converted it, using a correction factor of 20 as proposed by Elvis et al. (2004), to a total X-ray luminosity which reaches a value of LX-rayerg s-1 and LX-rayerg s-1.
4.1 Comparison with Previous Observations
We compare the parameters of the torus derived from the run 1 and 2 with ones obtained from X-ray observed by Awaki et al. (2008, 1990). The results obtained with the second run, which fixed the edge-on torus view, of Mrk 3 is favoured (see Tab. 4) by the physical properties derived from X-ray observation. Indeed, the X-ray luminosity inferred from our modelling turns out a similar value to that derived from the X-ray data (see Tab. 4). Using X-ray high quality wide-band (0.4-70 keV) spectrum of Mrk 3 observed with the Suzaku telescope Awaki et al. (2008) were able to derive an intrinsic X-ray luminosity of L2-10keV = 1.6 erg s-1 for this galaxy, concluding that it is quite completely attenuated by Compton-thick cold matter with cm-2. However, clumpy torus model give us a hydrogen column density, , about twice smaller than those obtained from Awaki et al. (cm-2, 2008, 1990). They also inferred the existence of a Compton shoulder to the iron K line, interpreted as the presence of a dusty torus. They also suggested that the iron emitting matter is located at 1 pc from the hidden nuclear engine. On the other hand, the size of the scattering region, due to the ionized gas, extends roughly over 50 pc (see also Sako et al., 2000; Pounds & Page, 2005; Serlemitsos et al., 2007; Awaki et al., 1990).
Assuming that the probability of a photon escapes from the central source toward of viewing angle , in a clumpy environment composed by optically thick clouds (), is determined by , which is the number of cloud over the observer’s line of sight. The first and second runs yield a and respectively. These results suggest that our run with Sy 2 view recovers a scenario which the amount of ionizing photons from the AGN are absorbed by the torus cloud environment as predict by unified models and it might explain the Sy 2 optical features observed in this galaxy. However, it is difficult to set tightly constraints from our modelling once even not the high-spatial resolution of the Gemini/Michelle -band spectrum could spatially resolve the point like source of Mrk 3 nor allows the contribution from dust in the host galaxy be estimated (see Goulding et al., 2012).
4.2 Compton-thick Torus Model Geometry of Seyfert 2: Mrk 3 and NGC 3281
In the clumpy dust torus model for AGN obscuration discussed above, the observed strength of the silicate dust features is expected to be dependent on the specific geometry and optical depth of the torus (Nenkova et al., 2002; Fritz et al., 2006; Granato & Danese, 1994). In addition, the dust would be co-spatial with cold neutral gas, which absorbs the X-ray wavelength light from the AGN (see Shi et al., 2006; Mushotzky et al., 1993; Wu et al., 2009). In particular, Shi et al. (2006) found that the strength of the silicate feature correlates with the hydrogen column density, suggesting that the material surrounding the central engine is responsible for obscuring both the X-ray and the silicate emission. Therefore, Georgantopoulos et al. (2011) postulates that the presence of a strong MIR silicate feature in absorption is a good method to find the most heavily obscured AGN, also called Compton-thick sources.
Following that line, Sales et al. (2011) represented the torus model geometry of Compton-thick Sy 2 NGC 3281 using the clumpy models, finding evidence that the matter responsible for the silicate absorption at 9.7 m could also be responsible for the X-ray scattering, with a column density of N cm-2. We also constrained parameters of the CLUMPY model to the torus geometry of Mrk 3 (see Section 4), which might indicate a similar correlation between the dusty material associated with the silicate feature and the X-ray scattering region in this galaxy. However, we should note that this conclusion may be subject of some concerns as it has been explored by Goulding et al. (2012) and need to be further addressed. The physical parameters of each torus are listed in Tab. 5.
From our analysis, we can conclude that the torus model geometry derived to NGC 3281 and Mrk 3 are quite similar, which have only differences in the visual optical depth of clump’s clouds as well as the total number of clouds in the torus equatorial radius suggesting that the dust torus in NGC 3281 is more compact than Mrk 3 (Tab. 5).
If we take A as an estimate of the optical extinction along the line of sight, we obtain A = 506 mag for NGC 3281, and A = 393 mag for Mrk 3. The difference in the optical obscuration generated by the two tori may explain the depth of the silicate profiles as the spectrum of NGC 3281 shows a deeper silicate feature than that of Mrk 3 (see Fig. 2 in Sales et al., 2011). It is important to highlight that these comparison between the torus model geometries of Mrk 3 and NGC 3281 is not straightforward because the fitting methodology of the clumpy models used by Sales et al. (2011) is different from that used here.
Furthermore, we can estimate the density of silicate matter as
| (4) |
where was obtained from the pahfit analysis, is the mass absorption coefficient of emitter material, and is emitting region length. Assuming m2 kg-1, which corresponds to MgSiO3 amorphous silicate (see Tab. 5 in Whittet, 2003), and as the length of uncontaminated nuclear extraction (193pc), we obtain kg m-3 and 7.8 kg m-3 for NGC 3281 and Mrk 3 respectively. This difference in the silicate density values is in agreement with the trend found to the optical extinction inferred using the SEDs of the clumpy models.
Note that the modelling of the silicate feature at 9.7m using Nenkova et al. (2002) clump torus also allow us to compare the hydrogen column density with the values derived from X-ray observations. Both NGC 3281, (N) and Mrk 3 (N) have been classified as Compton-thick sources (see also Vignali & Comastri, 2002; Awaki et al., 2008; Sales et al., 2011). Therefore, the results from Sales et al. (2011) and the new results presented here likely provide further evidence that the silicate-rich dust is indeed associated with the AGN torus and possibly also responsible for the absorption observed at X-ray wavelengths. However, it is necessary higher spatial resolution from the data and further accuracy in its modelling.
Since Mrk 3 has a roughly face-on view ( Goulding et al., 2012), we interpreted that the bulk of the N-band emission comes from a region less than the unresolved central 200 pc. In addition, we are assuming that the dominant emission is related to the putative torus of the AGN unified model. However, despite our claim, the high spatial resolution (0366) of Gemini/Michelle is not enough to isolate the Mrk 3 torus emission from its inner 200 pc. Hence, we have to keep in mind that our nuclear spectrum may have a contribution of the silicate dust located the inner 200 pc of the Mrk 3 bulge as suggested for other galaxies (see Deo et al., 2007, 2009; Goulding & Alexander, 2009; Mullaney et al., 2011, for review).
Moreover, Shi et al. (2006) also suggest that the structure of the material surrounding the central black hole requires a multi-phase medium composed by circumnuclear disk geometry plus a middle disk with a diffuse component and embedded denser clouds as well as the clumpy outer disk. Hence, we need to keep in mind, that the direct relation of the dust-to-gas ratio, as we have been used here, is causing concern, but this issue is not part of the scope of this paper and should be investigated more carefully in the future.
| Parameter | NGC 3281 | Mrk 3 |
| Torus angular distribution width () | 70∘ | 50∘ |
| Radial torus thickness () | 20 | 38 |
| Clumps along to torus equatorial radius () | 10 | 6 |
| Power-law index of radial density () | 1.0 | 0.94 |
| Observer viewing angle () | 60∘ | 66∘ |
| Clump visual optical depth () | 40 mag | 76 mag |
| Torus outer radii () | 11 pc | 7 pc |
| Observer visual extinction (A) | 506 mag | 393 mag |
| MgSiO3 amorphous silicate density () | 7.1kg m-3 | 7.8 kg m-3 |
| Observer column density () | 1.5cm-2 | 4.76cm-2 |
| Nuclear extraction size | 65 pc | 193 pc |
5 Summary and Conclusions
In this work we present a study using high spatial resolution (193 pc) spectra of the N-band wavelength (8–13m) of the well known Compton-thick galaxy Mrk 3 in order to investigate the correlation between the Compton-thick material seen at X-ray wavelength and the silicate grain signature at 9.7m. We also compare the results find here to Mrk 3 with those of Compton-thick galaxy NGC 3281, where the silicate absorption properties could be linked to Compton-thick material from X-ray spectra. Our main conclusions are:
-
1.
No polycyclic aromatic hydrocarbons (PAHs) emissions were detected in the Mrk 3 spectra. However, strong [Ar iii] 8.9 m, [S iv] 10.5 m and [Ne ii] 12.8 m ionic emission-lines as well as a silicate absorption feature at 9.7m have been detected at the nuclear spectrum.
-
2.
By analysis of the N-band image of Mrk 3 we are able to detected two emitting region, which the brightest one is dominated by the unresolved central source that might emerge from the dusty torus of the unified model. However, we should note that the spatial resolution of our Gemini/Michelle spectrum could not actually resolve the nuclear torus emission. The second component is an extended MIR emission from the circumnuclear region of Mrk 3. This diffuse dust emission shows up as a wings towards E-W direction mimicking the same S-shaped of the Narrow Line Region as has been seeing in the optical image of [O iii] 5007Å.
-
3.
The nuclear spectrum was compared with SEDs of clumpy torus models, the result suggests that the nuclear region of the Mrk 3 hosts a dusty toroidal structure with an angular cloud distribution of degree, observer’s view angle degree, and an outer radius of R7 pc. The hydrogen column density along the line of sight, derived from Nenkova’s torus models, is N cm-2. The torus models also provide an estimate for the X-ray luminosity (LX-ray erg s-1) of the AGN in Mrk 3 and this value is comparable to that derived from observed X-ray spectra, L = 6.2 erg s-1.
-
4.
By comparing the torus properties of Mrk 3 and NGC 3281 Compton-thick Sy 2 galaxies it turns out similar torus model geometries. This result perhaps indicates further evidence that the silicate dust is associated with the torus predicted by the unified model of AGN, and could also be responsible for the absorption observed at X-ray wavelengths of those galaxies classified as Compton-thick sources. However, it is necessary better spatial resolution in order to address this assumption.
Acknowledgements
MP would like to acknowledge the support from CNPq (grant 308985/2009-5). R.R. acknowledges funding from FAPERGs (ARD 11/1758-5) and CNPq (grant 304796/2011-5). Based on observations obtained at the Gemini Observatory, which is operated by the Association of Universities for Research in Astronomy, Inc., under a cooperative agreement with the NSF on behalf of the Gemini partnership: the National Science Foundation (United States), the Science and Technology Facilities Council (United Kingdom), the National Research Council (Canada), CONICYT (Chile), the Australian Research Council (Australia), Ministério da Ciência e Tecnologia (Brazil), and Ministerio de Ciencia, Tecnología e Innovación Productiva (Argentina).
References
- Adams (1977) Adams, T. F. 1977, ApJS, 33, 19
- Alonso-Herrero et al. (2011) Alonso-Herrero, A., Ramos Almeida, C., Mason, R., et al. 2011, ApJ, 736, 82
- Antonucci (1993) Antonucci, R. 1993, ARA&A, 31, 473
- Asensio Ramos & Ramos Almeida (2009) Asensio Ramos, A., & Ramos Almeida, C. 2009, ApJ, 696, 2075
- Awaki et al. (2008) Awaki, H., Anabuki, N., Fukazawa, Y., et al. 2008, PASJ, 60, 293
- Awaki et al. (1991) Awaki, H., Koyama, K., Inoue, H., & Halpern, J. P. 1991, PASJ, 43, 195
- Awaki et al. (1990) Awaki, H., Koyama, K., Kunieda, H., & Tawara, Y. 1990, Nature, 346, 544
- Barvainis (1987) Barvainis, R. 1987, ApJ, 320, 537
- Capetti et al. (1995) Capetti, A., Macchetto, F., Axon, D. J., Sparks, W. B., & Boksenberg, A. 1995, ApJ, 448, 600
- Cappi et al. (1999) Cappi, M., Bassani, L., Comastri, A., et al. 1999, A&A, 344, 857
- Cohen et al. (1999) Cohen, M., Walker, R. G., Carter, B., Hammersley, P., Kidger, M., & Noguchi, K. 1999, AJ, 117, 1864,
- Collins et al. (2005) Collins, N. R., Kraemer, S. B., Crenshaw, D. M., et al. 2005, ApJ, 619, 116
- Crenshaw et al. (2010) Crenshaw, D. M., Kraemer, S. B., Schmitt, H. R., et al. 2010, AJ, 139, 871
- Deo et al. (2007) Deo, R. P., Crenshaw, D. M., Kraemer, S. B., et al. 2007, ApJ, 671, 124
- Deo et al. (2009) Deo, R. P., Richards, G. T., Crenshaw, D. M., & Kraemer, S. B. 2009, ApJ, 705, 14
- Draine (2003) Draine, B. T. 2003, ARA&A, 41, 241
- Dullemond & van Bemmel (2005) Dullemond, C. P., & van Bemmel, I. M. 2005, A&A, 436, 47
- Efstathiou et al. (2013) Efstathiou, A., Christopher, N., Verma, A., & Siebenmorgen, R. 2013, MNRAS, 436, 1873
- Elvis et al. (2004) Elvis, M., Risaliti, G., Nicastro, F., Miller, J. M., Fiore, F., & Puccetti, S. 2004, ApJ, 615, L25
- Elitzur (2008) Elitzur, M. 2008, NewAR, 52, 274
- Fritz et al. (2006) Fritz, J., Franceschini, A., & Hatziminaoglou, E. 2006, MNRAS, 366, 767
- Gallimore et al. (2010) Gallimore, J. F., Yzaguirre, A., Jakoboski, J., et al. 2010, ApJ, 187, 172
- Georgantopoulos et al. (2011) Georgantopoulos, I., Dasyra, K. M., Rovilos, E., et al. 2011, A&A, 531, A116
- Goulding et al. (2012) Goulding, A. D., Alexander, D. M., Bauer, F. E., et al. 2012, ApJ, 755, 5
- Goulding & Alexander (2009) Goulding, A. D., & Alexander, D. M. 2009, MNRAS, 398, 1165
- Granato & Danese (1994) Granato, G. L., & Danese, L. 1994, MNRAS, 268, 235
- Granato et al. (1997) Granato, G. L., Danese, L., & Franceschini, A. 1997, ApJ, 486, 147
- Hao et al. (2007) Hao, L., Weedman, D. W., Spoon, H. W. W., Marshall, J. A., Levenson, N. A., Elitzur, M., & Houck, J. R. 2007, ApJL, 655, L77
- Heymann & Siebenmorgen (2012) Heymann, F., & Siebenmorgen, R. 2012, ApJ, 751, 27
- Hönig et al. (2006) Hönig, S. F., Beckert, T., Ohnaka, K., & Weigelt, G. 2006, A&A, 452, 459
- Hönig & Kishimoto (2010) Hönig, S. F., & Kishimoto, M. 2010, A&A, 523, A27
- Iwasawa et al. (1994) Iwasawa, K., Yaqoob, T., Awaki, H., & Ogasaka, Y. 1994, PASJ, 46, L167
- Kemper et al. (2004) Kemper, F., Vriend, W. J., & Tielens, A. G. G. M. 2004, ApJ, 609, 826
- Knacke & Thomson (1973) Knacke, R. F., & Thomson, R. K. 1973, PASP, 85, 341
- Krolik & Begelman (1988) Krolik, J. H., & Begelman, M. C. 1988, ApJ, 329, 702
- Mason et al. (2006) Mason, R. E., Geballe, T. R., Packham, C., Levenson, N. A., Elitzur, M., Fisher, R. S., & Perlman, E.
- Miller & Goodrich (1990) Miller, J. S., & Goodrich, R. W. 1990, ApJ, 355, 456
- Mor et al. (2009) Mor, R., Netzer, H., & Elitzur, M. 2009, ApJ, 705, 298
- Mullaney et al. (2011) Mullaney, J. R., Alexander, D. M., Goulding, A. D., & Hickox, R. C. 2011, MNRAS, 414, 1082
- Mushotzky et al. (1993) Mushotzky, R. F., Done, C., & Pounds, K. A. 1993, ARA&A, 31, 717
- Nenkova et al. (2002) Nenkova, M., Ivezić, Ž., & Elitzur, M. 2002, ApJL, 570, L9
- Nenkova et al. (2008a) Nenkova, M., Sirocky, M. M., Ivezić, Ž., & Elitzur, M. 2008a, ApJ, 685, 147
- Nenkova et al. (2008b) Nenkova, M., Sirocky, M. M., Nikutta, R., Ivezić, Ž., & Elitzur, M. 2008b, ApJ, 685, 160
- Nikutta et al. (2009) Nikutta, R., Elitzur, M., & Lacy, M. 2009, ApJ, 707, 1550
- Packham et al. (2005) Packham, C., Radomski, J. T., Roche, P. F., et al. 2005, ApJL, 618, L17
- Pounds & Page (2005) Pounds, K. A., & Page, K. L. 2005, MNRAS, 360, 1123
- Pier & Krolik (1992) Pier, E. A., & Krolik, J. H. 1992, ApJ, 401, 99
- Radomski et al. (2002) Radomski, J. T., Piña, R. K., Packham, C., Telesco, C. M., & Tadhunter, C. N. 2002, ApJ, 566, 675
- Radomski et al. (2003) Radomski, J. T., Piña, R. K., Packham, C., et al. 2003, ApJ, 587, 117
- Ramos Almeida et al. (2011) Ramos Almeida, C., Levenson, N. A., Alonso-Herrero, A., et al. 2011, ApJ, 731, 92
- Reunanen et al. (2010) Reunanen, J., Prieto, M. A., & Siebenmorgen, R. 2010, MNRAS, 402, 879
- Riffel et al. (2006) Riffel, R., Rodríguez-Ardila, A., & Pastoriza, M. G. 2006, A&A, 457, 61
- Riffel et al. (2009) Riffel, R., Pastoriza, M. G., Rodríguez-Ardila, A., & Bonatto, C. 2009, MNRAS, 400, 273
- Rodríguez-Ardila & Mazzalay (2006) Rodríguez-Ardila, A., & Mazzalay, X. 2006, MNRAS, 367, L57
- Rowan-Robinson (1995) Rowan-Robinson, M. 1995, MNRAS, 272, 737
- Ruiz et al. (2001) Ruiz, J. R., Crenshaw, D. M., Kraemer, S. B., et al. 2001, AJ, 122, 2961
- Ruschel-Dutra et al. (2014) Ruschel-Dutra, D., Pastoriza, M., Riffel, R., Sales, D. A., & Winge, C. 2014, MNRAS, 108
- Sales et al. (2010) Sales, Dinalva A., Pastoriza, M. G., & Riffel, R. 2010, ApJ, 725, 605
- Sales et al. (2011) Sales, D. A., Pastoriza, M. G., Riffel, R., et al. 2011, ApJ, 738, 109
- Sales et al. (2012) Sales, D. A., Pastoriza, M. G., Riffel, R., Winge, C. 2012, MNRAS, submitted
- Sako et al. (2000) Sako, M., Kahn, S. M., Paerels, F., & Liedahl, D. A. 2000, ApJ, 543, L115
- Schartmann et al. (2005) Schartmann, M., Meisenheimer, K., Camenzind, M., Wolf, S., & Henning, T. 2005, A&A, 437, 861
- Schartmann et al. (2008) Schartmann, M., Meisenheimer, K., Camenzind, M., et al. 2008, A&A, 482, 67
- Schmitt et al. (2003a) Schmitt, H. R., Ulvestad, J. S., Antonucci, R. R. J., & Kinney, A. L. 2003a, ApJS, 132, 199
- Schmitt et al. (2003b) Schmitt, H. R., Donley, J. L., Antonucci, R. R. J., Hutchings, J. B. & Kinney, A. L. 2003b, ApJS, 148, 327
- Sirocky et al. (2008) Sirocky, M. M., Levenson, N. A., Elitzur, M., Spoon, H. W. W., & Armus, L. 2008, ApJ, 678, 729
- Serlemitsos et al. (2007) Serlemitsos, P. J., Soong, Y., Chan, K.-W., et al. 2007, PASJ, 59, 9
- Siebenmorgen et al. (2004) Siebenmorgen, R., Krügel, E., & Spoon, H. W. W. 2004, A&A, 414, 123
- Siebenmorgen et al. (2005) Siebenmorgen, R., Haas, M., Krügel, E., & Schulz, B. 2005, A&A, 436, L5
- Smith et al. (2007) Smith, J. D. T., Draine B. T., Dale D. A., et al. 2007, ApJ, 656, 770
- Spoon et al. (2007) Spoon, H. W. W., Marshall, J. A., Houck, J. R., Elitzur, M., Hao, L., Armus, L., Brandl, B. R., & Charmandaris, V. 2007, ApJ, 654, 49
- Shi et al. (2006) Shi, Y., Rieke, G. H., Hines, D. C., et al. 2006, ApJ, 653, 127
- Stalevski et al. (2012) Stalevski, M., Fritz, J., Baes, M., Nakos, T., & Popović, L. Č. 2012, MNRAS, 420, 2756
- Thompson et al. (2009) Thompson, G. D., Levenson, N. A., Uddin, S. A., & Sirocky, M. M. 2009, ApJ, 697, 182
- Tran (1995) Tran, H. D. 1995, ApJ, 440, 565
- Turner et al. (1997) Turner, T. J., George, I. M., Nandra, K., & Mushotzky, R. F. 1997, ApJS, 113, 23
- Urry & Padovani (1995) Urry, C. M., & Padovani, P. 1995, PASP, 107, 803
- van Diedenhoven et al. (2004) van Diedenhoven, B., Peeters, E., Van Kerckhoven, C., et al. 2004, ApJ, 611, 928
- Vignali & Comastri (2002) Vignali, C., & Comastri, A. 2002, A&A, 381, 834
- Weedman et al. (2005) Weedman, D. W., Hao, Lei, Higdon, S. J. U., et al. 2005, ApJ, 633, 706
- Whittet (2003) Whittet, D. C. B. 2003, Dust in the galactic environment, 2nd ed. by D.C.B. Whittet. Bristol: Institute of Physics (IOP) Publishing, 2003 Series in Astronomy and Astrophysics, ISBN 0750306246
- Winter et al. (2009) Winter, L. M., Mushotzky, R. F., Reynolds, C. S., & Tueller, J. 2009, ApJ, 690, 1322
- Wu et al. (2009) Wu, Y., Charmandaris, V., Huang, J., Spinoglio, L., & Tommasin, S. 2009, ApJ, 701, 658