Spatial and Kinematic Distributions of Transition Populations in Intermediate Redshift Galaxy Clusters11affiliation: Based in part on data obtained at the W. M. Keck Observatory, which is operated as a scientific partnership among the California Institute of Technology, the University of California and the National Aeronautics and Space Administration. The Observatory was made possible by the generous financial support of the W. M. Keck Foundation.
Abstract
We analyze the spatial and velocity distributions of confirmed members in five massive clusters of galaxies at intermediate redshift () to investigate the physical processes driving galaxy evolution. Based on spectral classifications derived from broad- and narrow-band photometry, we define four distinct galaxy populations representing different evolutionary stages: red sequence (RS) galaxies, blue cloud (BC) galaxies, green valley (GV) galaxies, and luminous compact blue galaxies (LCBGs). For each galaxy class, we derive the projected spatial and velocity distribution and characterize the degree of subclustering. We find that RS, BC, and GV galaxies in these clusters have similar velocity distributions, but that BC and GV galaxies tend to avoid the core of the two clusters. GV galaxies exhibit subclustering properties similar to RS galaxies, but their radial velocity distribution is significantly platykurtic compared to the RS galaxies. The absence of GV galaxies in the cluster cores may explain their somewhat prolonged star-formation history. The LCBGs appear to have recently fallen into the cluster based on their larger velocity dispersion, absence from the cores of the clusters, and different radial velocity distribution than the RS galaxies. Both LCBG and BC galaxies show a high degree of subclustering on the smallest scales, leading us to conclude that star formation is likely triggered by galaxy-galaxy interactions during infall into the cluster.
1 Introduction
A substantial body of astronomical research conducted over the last several decades has established that environment strongly modulates galaxy properties such as star formation rate (Gómez et al., 2003) and gives rise to the so-called morphology-density relationship (Dressler, 1980) seen in the nearby Universe. These studies paint a picture in which dense cluster environments transforms blue, star-forming galaxies into red, queiscent galaxies at much faster rates than in the low-density field. However, the responsible mechanisms and timescales for these transformations in clusters remain a matter of debate (Boselli & Gavazzi, 2006).
An important factor affecting the evolution of individual cluster galaxies is thought to be the nature of their orbits within the cluster: highly-radial orbits are far more susceptible to effects such as ram-pressure stripping that quench star formation (Solanes et al., 2001; Iannuzzi & Dolag, 2012). Certain studies of low-redshift clusters find that star-forming galaxies are more likely than passive galaxies to occupy radial orbits (Biviano et al., 1997; Mahdavi et al., 1999; Biviano & Katgert, 2004), suggesting that recent infall accounts for today’s star-forming cluster galaxies. Other studies report contradictory results for nearby clusters (Ramírez & de Souza, 1998; Hwang & Lee, 2008) and possible evolution with redshift for the quiescent population (Ramírez et al., 2000; Biviano & Poggianti, 2009).
Motivated by a desire to clarify this picture, we seek to quantify how location and kinematics affect the evolution of cluster galaxies. To do so, we examine the available phase-space properties (i.e., the projected spatial and velocity distributions) of different optically-identified populations in galaxy clusters at intermediate redshift. By identifying galaxies undergoing rapid evolution and studying their phase-space properties, we hope to gain insight into how galaxies in clusters evolve from the actively star-forming phase into passively evolving systems. Well-known examples of these transitional galaxy types include post-starburst (“E+A”) galaxies (Dressler & Gunn, 1983) and ultra-luminous infrared galaxies (ULIRGs, Soifer et al., 1984).
The present study focuses on two other evolving galaxy populations that we can readily identify on the basis of their photometric properties alone: “green valley” galaxies and luminous compact blue galaxies. Green valley galaxies (GV, Wyder et al., 2007) occupy a region in optical color-magnitude space straddling the dividing line between the well-defined red sequence and the blue cloud (Wyder et al., 2007). Luminous compact blue galaxies (LCBG) are an extreme class of star-forming galaxies first identified in optical multi-color QSO surveys (Koo & Kron, 1988). The LCBG class is characterized by small physical sizes ( kpc based on HST imaging; Koo et al., 1994) and narrow line widths ( km s-1 based on Keck spectroscopy; Guzman et al., 1997).
In all such transitional populations, major changes in their properties — including morphology, luminosity, and color — are believed to occur quickly relative to the age of the Universe; consequently, galaxies transiting between active and quiescent phases are relatively rare. Their remarkably low space densities in the field make it difficult to gather samples sufficiently large to enable meaningful analysis; however, the higher space density of galaxies in clusters permits the study of statistically-significant sample sizes providing snapshots of galaxy evolution at specific cosmic epochs.
The GV galaxies are believed to represent a transitory population between the GC and RS phases (Coil et al., 2008; Salim et al., 2009). As with the colors of the galaxies, the morphology (in terms of concentration and asymmetry) of GVs are intermediate between these two classes (Mendez et al., 2011). The GV class has not been well studied to date as a distinct cluster population, although spectroscopically-identified post-startburst galaxies (e.g., “E+A” galaxies) have received much attention in the literature (e.g., Barger et al., 1996; Tran et al., 2003; Muzzin et al., 2012).
Our interest in LCBGs stems from the suggestion that in the field these galaxies rapidly evolve from intermediate redshifts to form dwarf ellipticals in present day clusters. In this scenario, given the relative abundance of dwarf ellipticals in clusters, a surfeit of LCBGs might be expected in intermediate redshift clusters. Crawford et al. (2006, 2011) found that the number density of LCBGs was enhanced in cluster environments by a factor of at , but the cause of this increased density of relatively rare objects is not understood.
In a series of papers (Crawford et al., 2006, 2009, 2011) we have explored the red (quiescent) and blue (star-forming) populations in a half-dozen rich clusters over the redshift range . Our aim has been to understand how these general populations evolve differentially with respect to the field. In this work, we compare and contrast the phase-space distribution of various galaxy populations to obtain insight into the morphology-density relationship, star-formation quenching, and population transformation in clusters. We isolate the LCBG and GV transitional classes from the global red and blue cluster populations based on their colors and radial profiles. Our work builds upon a deep optical imaging survey from the WIYN 3.5 m telescope111The WIYN Observatory is a joint facility of the University of Wisconsin-Madison, Indiana University, Yale University, and the National Optical Astronomy Observatories. and spectroscopic follow-up from the DEIMOS spectrograph (Faber et al., 2003) on the Keck II Telescope of the W. M. Keck Observatory. The parameters of each of our clusters is listed in Table 1. Details of the observations appear in Crawford et al. (2009) and Crawford et al. (2011).
| Field | WLTV ID | ||||||
|---|---|---|---|---|---|---|---|
| (J2000) | (J2000) | (km s-1) | (Mpc) | () | |||
| (1) | (2) | (3) | (4) | (5) | (6) | (7) | (8) |
| MS 0451-03 | w05 | 04:54:10.8 | 03:00:51 | ||||
| Cl 0016+16 | w01 | 00:18:33.6 | 16:26:16 | ||||
| Cl J1324+3011 | w08 | 13:24:48.8 | 30:11:39 | ||||
| MS 1054-03 | w07 | 10:56:60.0 | 03:37:36 | ||||
| Cl J1604+4304 | w10 | 16:04:24.0 | 43:04:39 |
Note. — (1) Standard cluster field name; (2) internal designation for each of the clusters; (3) and (4) celestial coordinates of the adopted cluster center defined by Brightest Cluster Galaxy; (5) measured cluster redshift; (6) measured cluster projected velocity dispersion based on the biweight estimator of scale; (7) cluster virial radius derived from for our adopted cosmology; (8) cluster virial radius in angular units.
Our paper is organized as follows: In §2, we describe our photometric classification scheme for different populations; in §3 we describe our method for culling a reliable cluster sample for objects with spectroscopic redshifts; in §4, we analyze different projections of the accessible phase-space distribution; in §5, we consider the subclustering of the different populations; we discuss our results in §6 and summarize our findings in §7. Throughout this paper, we employ the following acronyms to refer to different classes of galaxies defined in §2: red sequence (RS), blue cloud (BC), green valley (GV), and luminous compact blue galaxies (LCBGs).
2 Photometric Classification
We separate the galaxies in each field into distinct samples regardless of cluster membership based purely on their rest-frame photometric properties: color, luminosity, and surface brightness. Building on the work of Crawford et al. (2011), we define four galaxy samples:
-
•
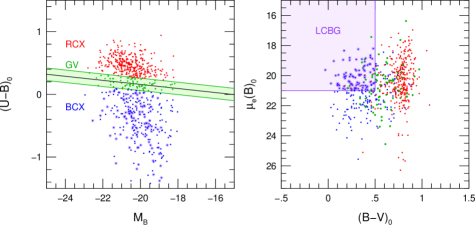
Red sequence (RS) galaxies are defined as objects redder than dividing line between blue and red objects, which we define as following Willmer et al. (2006).222This definition is based on a mag shift in the zeropoint of the color-magnitude relationship at intermediate redshifts.
-
•
Blue cloud (BC) galaxies are taken to be bluer than this same dividing line.
-
•
Green valley (GV) galaxies occupy an 0.2-mag-wide strip in color centered on the line between RS and BC galaxies cited above; the adopted definition is comparable to others found in the literature (e.g., Coil et al., 2008).
- •
A shortcoming of the above definitions is that the GV class overlaps the BC and RS classes in color-magnitude space, making the classification of GV galaxies ambiguous. In order to enable statistical comparisons between independent samples of galaxies, we choose to redefine the RS and BC classes to exclude the GV galaxies; thus, in our ensuing analysis we define “exclusive-RS” (RCX) and “exclusive-BC” (BCX) subsamples to be the RS and BC subsamples excluding the intermediate-color GV sample. Table 2 summarizes our adopted galaxy types. An example of the selection for different sources is shown in Figure 1.
| Sample | Color | Surface Brightness | Luminosity |
|---|---|---|---|
| RSX | |||
| GV | |||
| BCX | |||
| LCBG |
3 Cluster Membership
Since our ultimate goal is to compare and contrast the properties of various galaxy types within clusters, we must define which galaxies are bona fide members of their respective clusters. To avoid biasing the samples either for or against any type of galaxy, we require a method which is blind to the intrinsic properties of the galaxy (e.g., color, morphology, or spectral type). We adopt the customary strategy of applying a test called the “shifting gapper,” which analyzes the velocity distribution of galaxies in each field to determine which targets belong to the cluster (e.g., Fadda et al., 1996; Lopes et al., 2009). We also apply a radial cutoff to exclude galaxies lying more than a certain distance from the cluster center in projected space. Due to the interdependence in the determinations of the velocity dispersion and the radial cutoff, we developed an iterative approach to solve the problem, as described next.
3.1 Velocity Cut Algorithm
To determine which galaxies were members of a given cluster, we began by employing the “shifting gapper” method to define the cutoff in radial velocity, but modified the algorithm in two important ways:
-
•
The velocity gap size used to distinguish members from interlopers is based on considering the nearest neighbors in clustocentric radius, rather than by constructing bins of size 0.4 Mpc in clustocentric distance or having at least members. Our approach eliminates the discontinuities inherent in a binning-based analysis and ensures that the same number of galaxies is used in each computation of the gap size.
-
•
We employed the absolute value of the peculiar velocity in the analysis, rather than the raw value, since clusters are approximately symmetrical in radial velocity space.
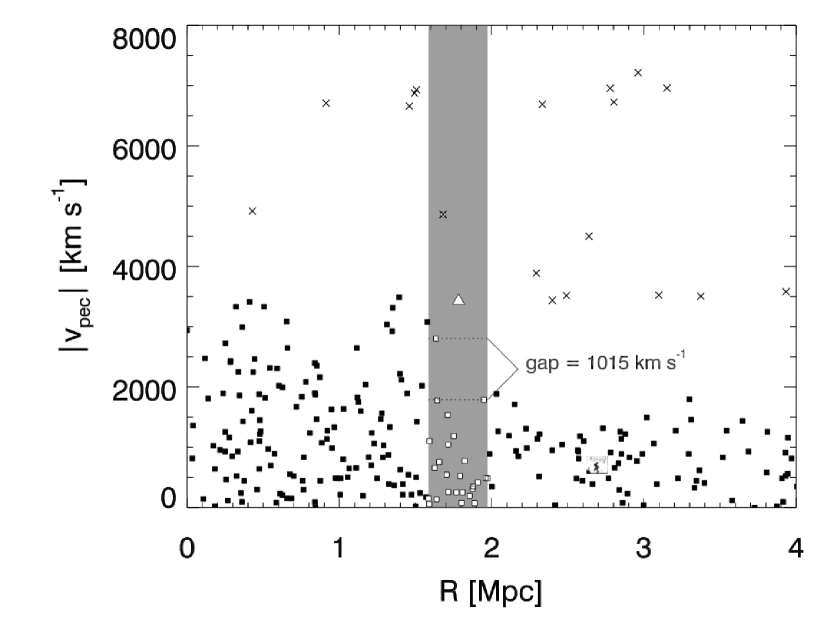
Given the distribution of galaxy clustocentric radii, , and the corresponding peculiar velocities, , any given galaxy is classified as either a cluster member or non-member as follows:
-
1.
Locate the galaxies whose radii from the cluster center are closest to . We take to be 30.
-
2.
Within this sample of targets, identify the subset of those targets which have and measure , the biggest gap in the distribution of absolute peculiar velocity within this sample.
-
3.
If the gap size is less than a selected maximum value , then this object is accepted as a member; otherwise, it is classified as a non-member.
The procedure is depicted graphically in Figure 2.
3.2 Radial Cut Algorithm
In addition to the velocity cut, it is necessary to define an outer limit in projected radius for cluster members. To exclude galaxies which are not bound to the cluster, we required targets to lie within the virial radius of the cluster, estimated via
| (1) |
where is the radius at which the density of the cluster is the critical density of the Universe. This follows directly for a singular isothermal sphere (), where is the projected velocity dispersion of the cluster and is the value of the Hubble parameter at the cluster epoch333We adopt , , and throughout..
3.3 Iterative Estimation of Cluster Parameters
The velocity and radial criteria described above are interdependent. The value of (from which is derived) depends on which galaxies are included in the sample; thus, to measure we should exclude those (presumably unbound) targets lying outside . However, the formula for requires a measured value of ; hence, the process is circular. We thus adopted an iterative approach to reject interlopers while simultaneously deriving values for the cluster redshift , terminal radius , and projected velocity dispersion .
Given a first estimate of the cluster redshift, which is derived by finding a peak in the redshift distribution, the method proceeds as follows:
-
1.
We compute the peculiar velocities of all galaxies (measured in the cluster rest frame) relative to the nominal cluster redshift, then exclude all galaxies with peculiar velocities exceeding 10,000 km s-1 in absolute value.
-
2.
We employ our modified “shifting gapper” method (§3) to exclude interloping galaxies based on peculiar velocity.
-
3.
Using the subset of galaxies which pass the interloper rejection test, we recompute the cluster redshift and projected velocity dispersion using robust, biweight-based estimates of location and scale (Beers et al., 1990).
-
4.
Given the measured value of , we compute via eq. 1, then convert this physical value to an angular measurement based on the cluster redshift and assumed cosmological parameters.
-
5.
We repeat the previous 3 steps, now excluding targets which lie outside of as well as those which fail the “shifting gapper” test.
We continue this iterative procedure until the value of and the number of cluster members stabilize within 1% or until a maximum 25 iterations are completed. In practice, convergence generally occurs within five iterations.
3.4 Parameter Values
We now consider whether our results are sensitive to the particular values we chose for the three key parameters in our process:
-
1.
The initial peculiar velocity window size used to reject obvious outliers, taken to be km s-1 (in the cluster rest frame).
-
2.
The number of neighbors employed in the “shifting gapper” algorithm to compute the gap size, taken to be 30.
-
3.
The maximum permitted gap size employed in the “shifting gapper,” , taken to be 1000 km s-1.
We explored this by using the Cl 0016+16 field dataset as a testbed to investigate the dependency of the derived cluster redshift, cluster velocity dispersion, and the number of cluster members on the values of these parameters.

Figure 3 shows the results of experiments in which we varied these parameters to gauge their impact on our measurements of three key cluster properties: the derived number of cluster members; the central redshift as characterized by the biweight estimate of central location; the derived line-of-sight velocity dispersion , as estimated via the biweight estimator of scale. Panels (a)–(c) consider the effect of changing the initial peculiar velocity window size. Here, galaxies with an absolute peculiar velocity greater than the specified value were excluded from the subsequent calculation of the cluster properties. We repeated our analysis in the Cl 0016+16 field using values of the window size ranging from 1000 km s-1 to 20,000 km s-1. Results indicate that the number of derived cluster members, the cluster redshift, and the cluster velocity dispersion are completely insensitive to changes in the window size parameter over the range 4,000–19,000 km s-1. We conclude that 10,000 km s-1 is a reasonable value for the window size.
Similarly, panels (d)–(f) show the effect on derived cluster properties of varying the number of neighbor galaxies considered in computing the gap size for our implementation of the “shifting gapper” algorithm. The plots indicate that values in the range yield similar results for Cl 0016+16. We select to preserve locality.
Finally, panels (g)–(i) illustrate the effect on derived cluster parameters of varying the maximum permitted velocity gap size ( km s-1) in the “shifting gapper” algorithm. These plots indicate that values in the range 800–1700 km s-1 yield similar results. We follow Fadda et al. (1996) and select km s-1.
4 Phase-space Distribution of Cluster Populations
For clues into what processes drive galaxy evolution in these clusters, we investigated whether the star-forming and non-star-forming populations have different spatial and/or velocity distributions. Position-velocity and position-position diagrams for all galaxies with measured spectroscopic redshfts in each of the cluster fields appear in Figures 5 through 8. They identify which objects we consider bona fide cluster members based on the protocol defined in §3. For these bona fide members, the figures also distinguish objects by photometric type within or to the limits of the areal coverage of our WIYN multi-band photometry (Crawford et al., 2011), whichever is smaller. The figures show that the two lower-redshift clusters in our sample are rich and well-defined, whereas the higher-redshift clusters are less well sampled due to a combination of being intrinsically poorer and having apparently fainter galaxies (Lubin et al., 1998; Postman et al., 2001).
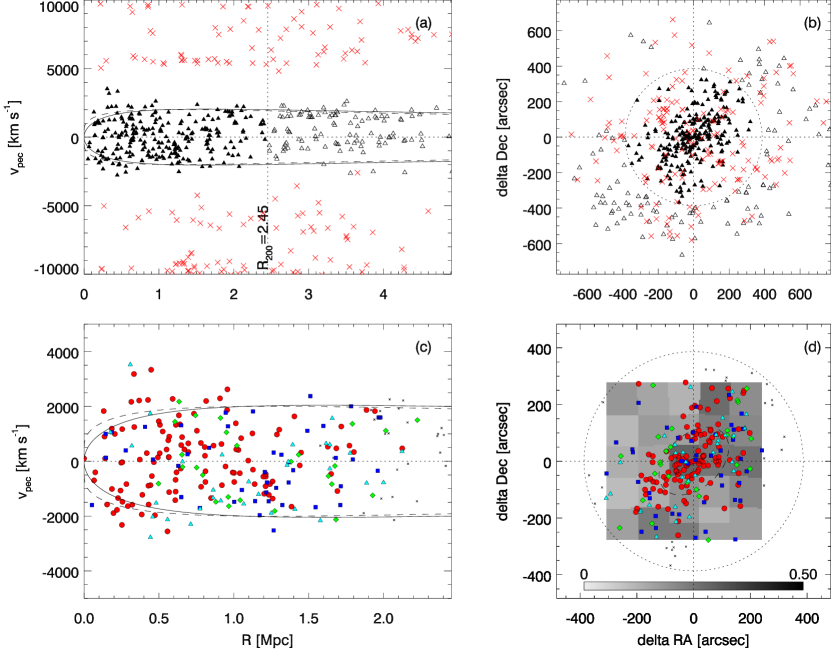
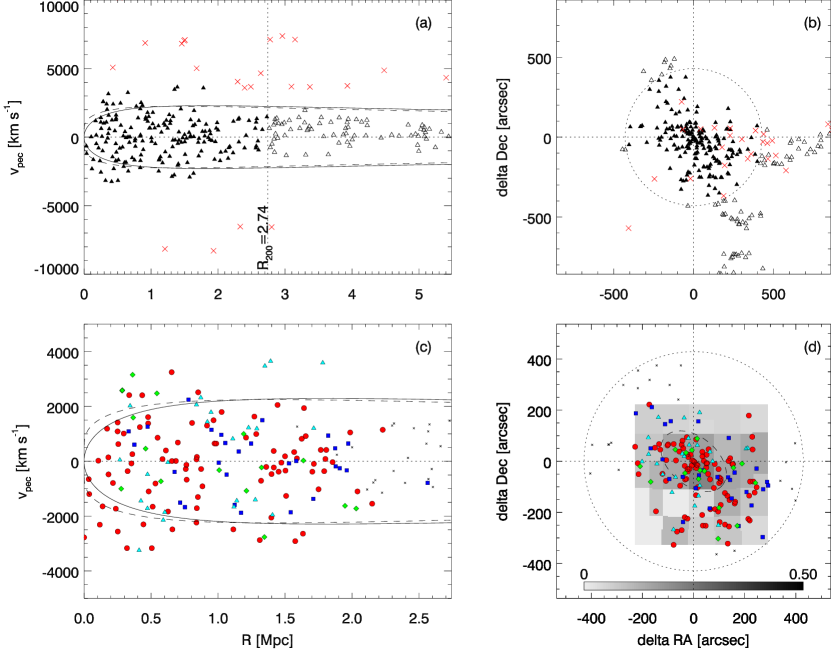
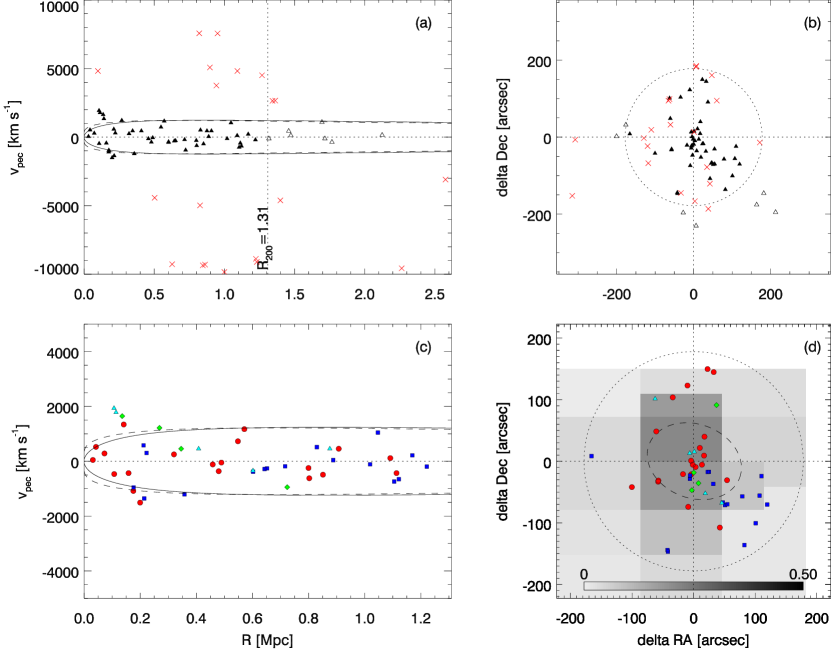
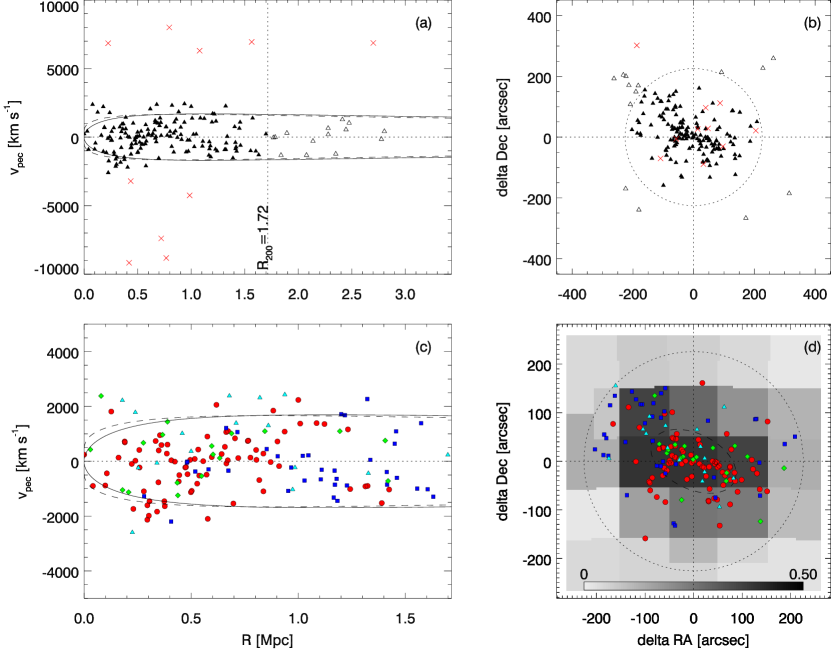
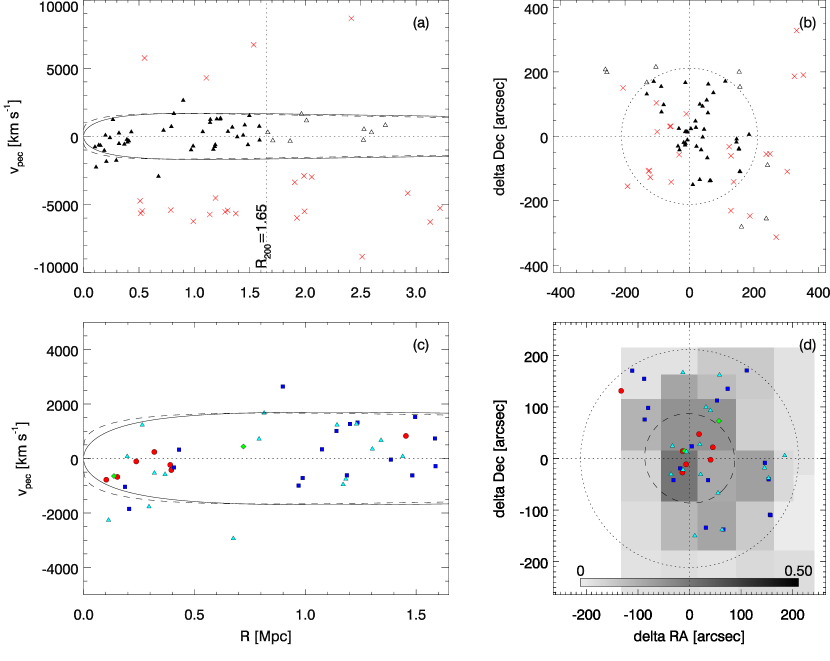
As a consistency check on our member/non-member division in velocity space, we have estimated the cluster escape velocity as a function of projected clustocentric radius and displayed the corresponding loci as lines in panels (a) and (c) of Figures 4 through 8. The estimates assume isotropic orbits and a Hernquist (1990) density profile given by
| (2) |
where is the total cluster mass and is the core radius, normalized, respectively to and from Table 4.1 here and in Crawford et al. (2011). Carlberg et al. (1997) found that the relation yielded the best fit to the galaxy surface density ensemble for 16 clusters in the redshift range , including two of our clusters (Cl 0016+16 and MS 0451–03); we adopt their radial size scaling. However, their estimate of for Cl 0016+16 is smaller than ours by about . We attribute this to two factors: (1) rather than attempting to distinguish individual cluster members from fore- and background galaxies, Carlberg et al. employed a statistical correction which is subject to error; (2) we have the benefit of a substantially larger, representative sample of spectroscopic redshifts within . If we re-derive an estimate of using only the Carlberg et al. sample, we find results consistent with theirs. The higher value of we obtain is consistent with recent theoretical work (Old et al., 2013; Wu et al., 2013) indicating that a large sample of galaxies randomly selected over a range of magnitude and radius is needed to accurately measure the velocity dispersion of a cluster.
A comparison of our measured velocity dispersions with those from other studies shows good general agreement. Our measured value of the velocity dispersion of MS 0451–03 is in excellent agreement with Borgani et al. (1999), who measure a value of km s-1. Jørgensen & Chiboucas (2013) measure a slightly higher value of km s-1 based on only 47 sources. Our value for MS 1054–03 is lower, but still in agreement, with the velocity dispersion of km s-1 from Tran et al. (2007). The results for Cl J1324+3011 and Cl J1604+4304 are both smaller than the previous measuments by Lubin et al. (2004) of km s-1 and km s-1, respectively. Our result for Cl J1324+3011 is significantly smaller than the previous measurements, whereas the difference for Cl J1604+4304 is not.
A range of line-of-sight escape velocities exists at any given projected radius. Within the uncertainties of the adopted values of and these projection effects, the identified cluster galaxies do indeed lie within a region of phase space consistent with being bona fide cluster members. Detailed mass modeling of, and galaxy orbits within, the cluster is beyond the scope of this work. Here, our primary aim is to derive the characteristic values of the average line-of-sight velocity distribution and spatial projection of cluster galaxies to determine whether they differ by type.
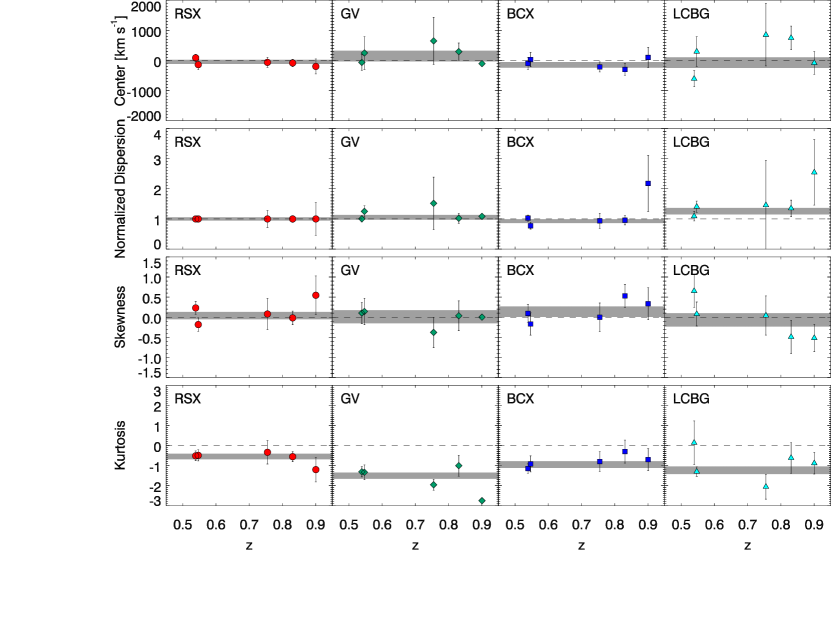
4.1 Projected Velocity Distribution
To determine quantitatively whether the radial velocity distributions for the various subpopulations differ, we computed the first four moments of the differential velocity distribution (offset, dispersion, skewness, and kurtosis); results appear in Table 4.1 and Figure 9.
Note. — (1) Cluster name; (2) galaxy class as described in text; (3) number of galaxies in subset; (4) velocity offset of this subset from the full sample; (5) velocity scale of the subset; (6) skewness of the subset; (7) kurtosis of the subset
Our analysis reveals no compelling evidence that the first and third moments (barycenter and velocity skew) differ consistently between the cluster subpopulations. However, we do detect certain differences in the even moments between various subsamples. Specifically, we find that the velocity distribution is generally platykurtic (i.e., displaying negative kurtosis; boxier than Gaussian). This effect appears to be most pronounced for the GV subsample and somewhat larger for the bluer, star-forming populations relative to the red population overall.
In terms of dispersion (the second moment), it is easiest to compare the populations if we normalize the dispersions within a given cluster to the dispersion for that cluster’s dominant RSX population, as shown in Fig. 9 and Table 4.1. Here, we observe that the LCBG population has a velocity dispersion which exceeds that of the RCX sample by a factor of , possibly increasing with redshift. A comparison between the radial velocity distributions for the LCBGs and red cluster members via the Komolgorov-Smirnov (K-S) statistical test indicates that we can reject with confidence the hypothesis that LCBGs are drawn from the same parent population as the RSX galaxies. For the GV and BCX classes, the evidence is mixed. Interpretation of the larger LCBG velocity dispersion depends on their relative spatial distribution, but certainly one plausible explanation is that this population is not yet virialized. The expected ratio between the velocity dispersion of a virialized population and an infalling population is (Colless & Dunn, 1996; Biviano et al., 1997), which is consistent with the value found for the LCGGs here. In short, the GV and LCBG classes appear to stand out in their velocity distributions as being, respectively, boxier and broader. We return to the implications of these findings in §6.
4.2 Projected Spatial Distribution
The spatial distributions of the different cluster populations are presented in Figures 5–8. For each cluster and galaxy class, we also calculate the center, major axis length (i.e., the second moment of the galaxy spatial distribution), ellipticity , position angle , skewness, and kurtosis of the distribution. To compensate for incompleteness in our sample, we applied a correction derived by estimating the completeness of the spectroscopy as a function of projected position and spectral type; each object is then weighted by the likelihood of having a measured spectroscopic redshift. The weight is calculated both based on spectroscopic sampling and color of the object. The grayscale background in Figures 4–8(d) represent the overall completeness as a function of spatial position for each of our fields. We present the spatial distribution statistics in Figure 10 and Table 4.2.
Note. — (1) Cluster name; (2) Galaxy class as described in text; (3) RA center of subset; (4) Declination of subset; (5) Major axis of subset; (6) Kurtosis along major axis of subset; (7) Kurtosis along major axis of subset; (8) Ellipticity of distribution; (9) Position angle of subset on sky.
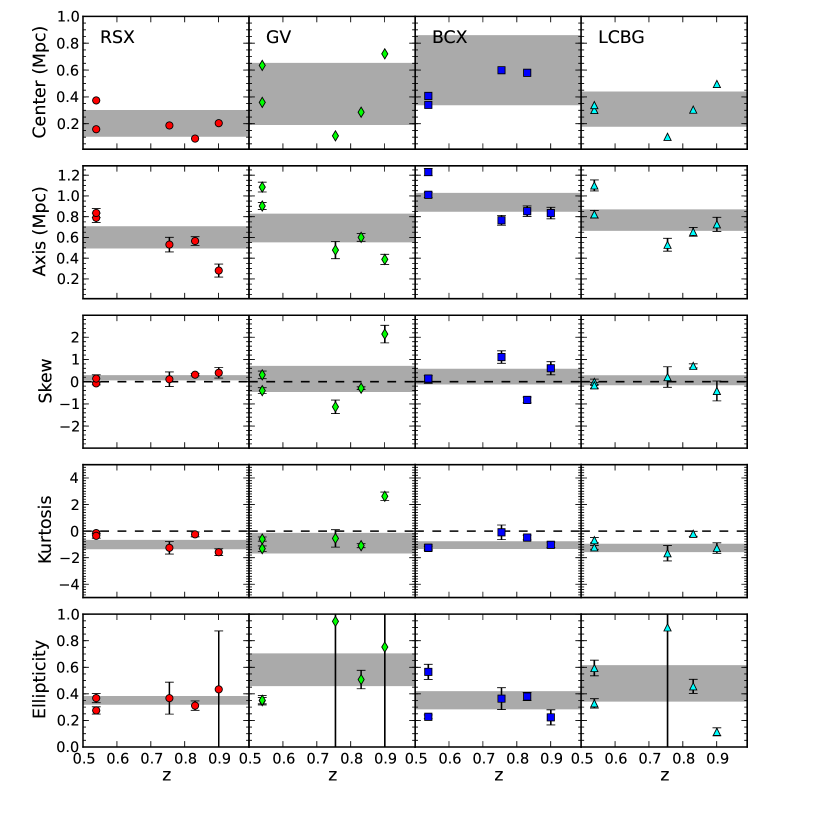
The analyis reveals similar spatial-distribution characteristics (ellipticity, skew, kurtosis) between subpopulations in a given cluster and between clusters as a whole. There is little skew, mild, negative kurtosis (), and a mean cluster ellipticity of 0.4. The greatest distinction between subpopulations is exhibited in the size distribution and de-center relative to the BCG. The BCX population has the largest spatial distribution and the largest offset on average, while the RCX values are the smallest. The BCX decenter values are three times more than that for the RCX galaxies, but still well below the cluster core radius. RCX size distribution is roughly 60% that for the BCX population, or roughly 20% of the volume. The GV and LCBG values are intermediate between the BCX and RCX population values in the mean, but exhibit more scatter from cluster to cluster.
4.2.1 Projected Radial Distribution
We also computed the projected radial surface density distributions for each of the different populations and present the results in Figure 11. To account for spectroscopic incompleteness in our survey, we applied a correction in computing these distributions following Crawford et al. (2011). The first step was to calculate the photometric galaxy classification assuming every object in the field was at the redshift of the cluster. We then summed the number of galaxies in a given classification within each of our radial bins. Next, we computed the ratio of spectroscopically-confirmed cluster members of a given class to the total number of objects with spectroscopy that had the same photometric galaxy classification. This ratio was calculated within each of the radial bins that we used and then applied to that radial bin. Finally, the corrected number density of galaxies was divided by the area of the radial bin to produce the surface density of galaxies. We only measured the surface density profiles out to the terminal radius of our WIYN survey.
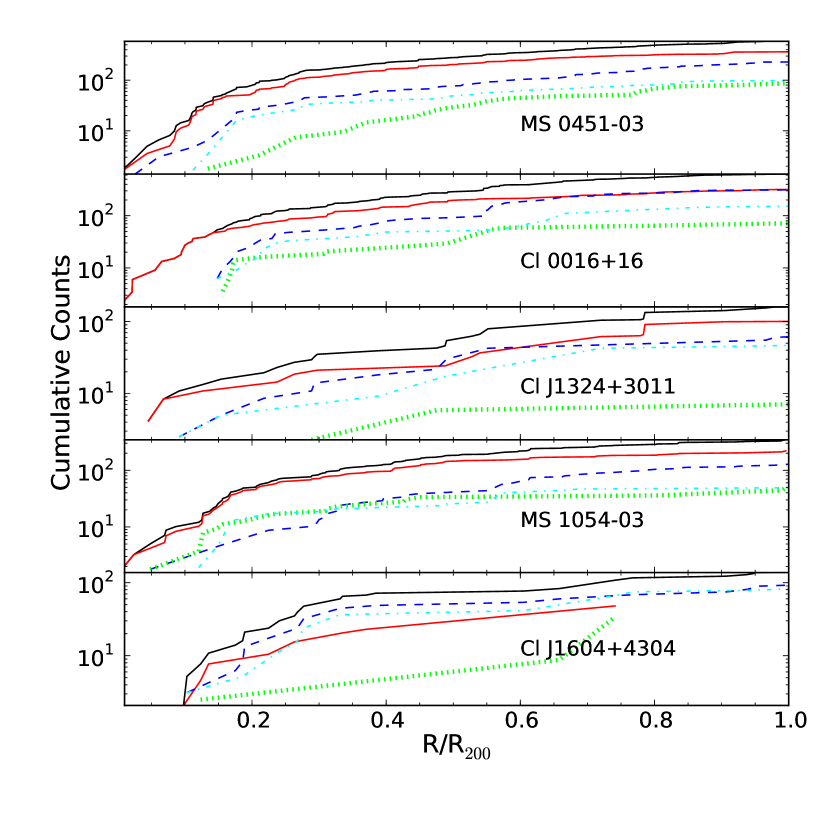
4.2.2 Trends and characteristics
All of these clusters exhibit a strong red sequence that peaks in the central region and falls off with radius, while the other classes of galaxies tend to show “cored” profiles (i.e., profiles with a deficit of galaxies in the central region). This contrast can be seen in Fig. 11 as a paucity of all but RCX galaxies within , particularly in the three most massive clusters. For BC, LCBG and GV types, the number of galaxies with is significantly less than the number of galaxies that would be expected if they had the same profile as red sequence galaxies. This relative lack of star-forming galaxies observed in the cluster core appears consistent with previous studies of rich clusters (Thompson, 1986; Ellingson et al., 2001; Crawford et al., 2006; Mahajan et al., 2010).
Within the three higher-redshift clusters, the spatial distribution of member galaxies appears more irregular. The most massive of the three, MS 0451–03, shows similar behavior to the two lower-redshift clusters, but with a much higher density of GV and BC objects within its core. The two slightly-lower-mass clusters show a much more irregular distribution of member galaxies. This pair of clusters shows far more blue galaxies within their central regions. This diminution of the morphology-density relationship has also been reported previously (e.g., Cooper et al., 2008; Tran et al., 2010; Hilton et al., 2010; Hayashi et al., 2010).
Visual inspection of the clusters reveals distinct patterns in the spatial distribution of the galaxies of different spectral type, which we characterize here:
- MS 0451–03
-
(Fig. 4) appears as a concentrated, massive cluster with the central region dominated by RS galaxies. Its shape is an elongated ellipse with higher galaxy density along the major axis, an effect previously reported by Moran et al. (2007). Most of the red galaxies lie along this axis, whereas blue galaxies are primarily located on the periphery. Moran et al. posited that MS 0451–03 had two large filaments feeding it, which explains the spatial and velocity distribution seen for the cluster. A very high fraction of blue galaxies (56%) on the interior of the cluster are LCBGs, while only 9% of galaxies within the core of the cluster () are GV galaxies.
- Cl 0016+16
-
(Fig. 5) is a massive galaxy cluster dominated by a very strong and extended distribution of RS galaxies. These galaxies form a highly elliptical distribution with evidence of strong filamentary structure beyond . Similar to MS 0451–03, 43% of blue galaxies are LCBGs, but such galaxies are nearly absent in the cluster core. GV galaxies are distributed throughout the cluster, but still comprise only 12% of the population within .
- Cl J1324+3011
-
(Fig. 6) is a very diffuse cluster with a small population of RS galaxies. Blue galaxies are the dominant subclass within the cluster, although RS galaxies form a small core which is offset from the overall distribution. The ratio of LCBGs to blue galaxies is relatively high at 50%, whereas GV galaxies comprise 13% of the total population.
- MS 1054–03
-
(Fig. 7) is a higher-redshift analogue to MS 0451–03 and Cl 0016+16, with a compact core of RS galaxies, an overall elliptical galaxy distribution, and blue galaxies dominating the periphery. It has a high fraction of blue galaxies (56%) within the cluster core. GV galaxies are spread throughout the cluster and have a similar distribution to the blue galaxies, comprising 18% of the population.
- Cl J1604+4304
-
(Fig. 8) is also a very diffuse cluster with an extended distribution of blue galaxies around a loose core of RS glaxies. The ratio of LCBGs to blue galaxies is extreme at 66%, but the cluster is nearly devoid of GV galaxies (6% of all sources).
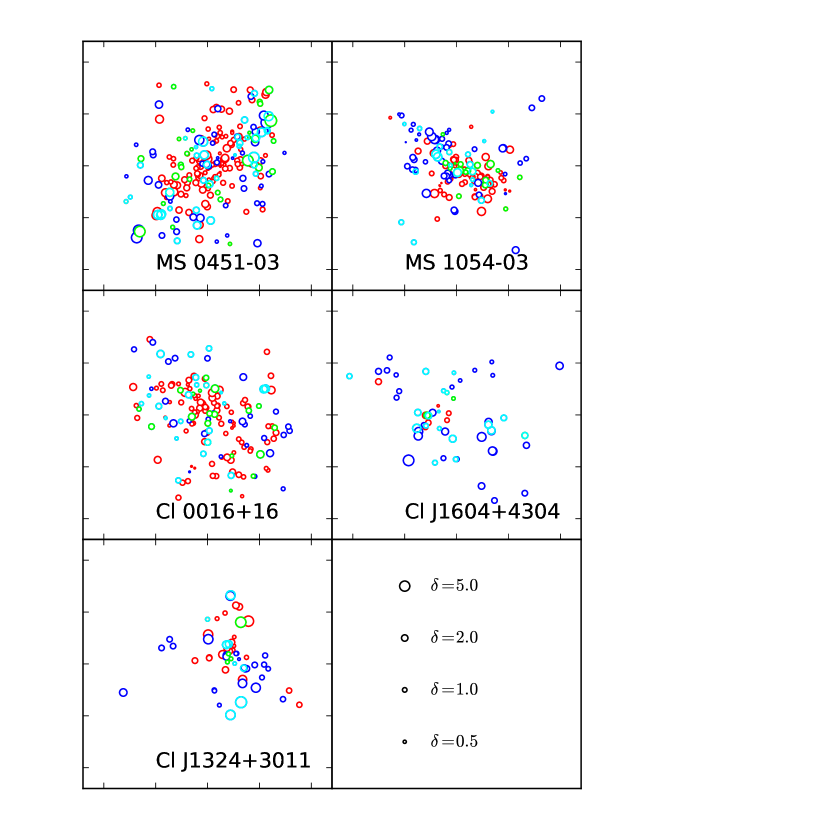
5 Subclustering
5.1 Dressler-Shectman Test
We applied the Dressler-Shectman (DS) statistical test to determine whether significant substructure exists in our clusters (Dressler & Shectman, 1988). The classical DS statistic is calculated by computing a local velocity mean () and velocity dispersion () for each galaxy and comparing these to the global values for the cluster. It is calculated via the relation
| (3) |
where , the number of nearest neighbors considered in the computation, is traditionally taken to be 10. As such, the statistic measures substructure in bulk flow and velocity dispersion on a density-dependent spatial scale. For each cluster, we also compute , a quantity which charcterizes the overall substructuring in a cluster. The significance of the substructure can be determined by comparing to the results of a Monte Carlo simulation, where the velocities of the sources have been randomized. Each simulation was run 1000 times to compute the probability that . We have computed for the overall galaxy population, but also for each of our subclasses. For each of the tests, we only measured for galaxies that lie within the WIYN field of view so that we could compare the different subclasses.
The results for each of our clusters appear in Fig. 12. Individual clusters are described in detail below:
- MS 0451–03
-
shows signs for some substructure as compared to the simulations with only 7% of the simulations having as high as that observed for the entire cluster population. The elongated structure has been reported previously (Donahue et al., 2003; Moran et al., 2007), and a triaxial distribution to the gas has been postulated as the most consistent fit to the observations of the gas distribution (Donahue et al., 2003). In this cluster, the blue populations show more signal for subclustering than the red populations with the LCBG class having the highest indication of subclustering.
- Cl 0016+16
-
shows no signs for substructure, with a very smooth, uniform distribution of galaxies. The cluster does exhibit a slightly elongated structure and is embedded in a much larger superstructure (Tanaka et al., 2007). None of the subpopulations show any significant differences in subclustering.
- Cl J1324+3011
-
shows no signs for substructure. However, the small population of LCBGs in this cluster does show a higher degree of clumping than the other populations and there is a fairly high degree of clustering within each of the populations.
- MS 1054–03
-
does show significant evidence for substructure with only 5% of the simulations showing the same degree of substructure. There is also an elongated structure to the cluster as well. However, none of the subpopulations show significantly more substructure than the others.
- Cl J1604+4304
-
does not show any significant substructure. The distribution of objects in the cluster is very diffuse. The blue galaxies and the LCBGs do show evidence for being more clustered into substructures than the other populations.
On the whole, the clusters present no coherent picture of the association of blue galaxies with substructure on the scale of 10 nearest neighbors. For the three most massive clusters, only a small fraction of the RS galaxies were associated with substructure, and only in MS 0451–03 was a large number of blue galaxies associated with substructure.
5.2 Subclustering on different scales
For each subclass of galaxy, we investigated how the galaxies were distributed on different (density-dependent spatial) scales by varying the number of nearest neighbors to seek trends in subclustering. We made repeated measurements of the DS statistic with values of ranging from 2 to 30, following Colless & Dunn (1996). Our results, averaged over all clusters but segregated by spectral type, are shown in Fig. 13. The average DS values at different for each type are shown as offsets from the DS values averaged over all galaxy types.
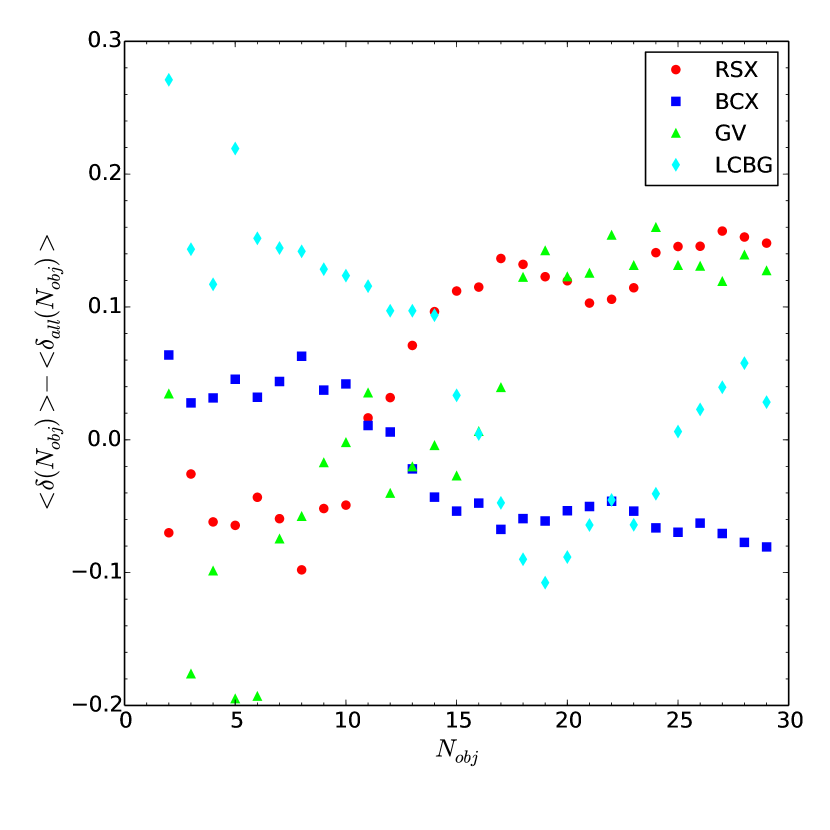
This analysis indicates that the LCBGs show a stronger signal for subclustering at the smallest scales as compared to the other galaxy types. We interpret this as indicating that LCBGs are preferentially found either in an interacting pair or a small group. Likewise, the blue galaxies, of which the LCBGs comprise a significant number, show a positive signal for subclustering at small scales. In contrast, the red galaxies show no sign of subclustering at small scales and the GV galaxies are actually strongly anti-clustered at the smallest scales () compared to the overall cluster population. At larger scales (), the red and GV galaxies show stronger indications of being a part of cluster substructure (i.e., the clusters themselves), whereas the blue galaxies exhibit a more uniform distribution.
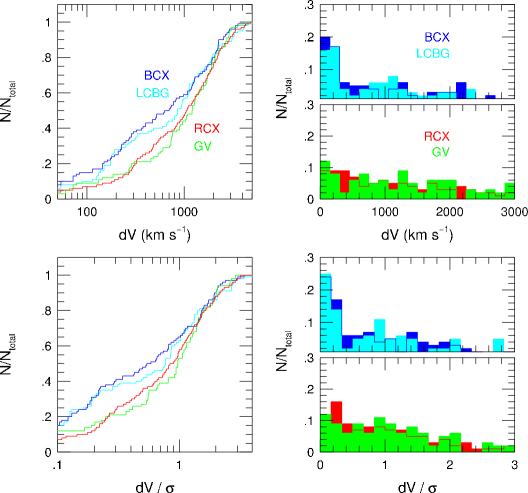
To further explore the small scale clustering of LCBGs, we considered the relationship between a given galaxy’s radial velocity and that of its nearest neighbor (viewed in projection on the sky). Figure 14 depicts the normalized distribution of the velocity difference between each galaxy and its nearest neighbor. In this plot, many more galaxies in the LCBG and BCX classes show small velocity differences with their closest neighbor, indicating that these galaxies are more likely to have radial velocities correlated with those of their nearest neighbor. The K-S test rejects the hypothesis that the distribution in nearest-neighbor velocities for LCBGs is drawn from the same distribution as RS galaxies. The pairwise velocity differences for the GV and RSX galaxies are comparable to the cluster velocity dispersion, while the same quantity for the LCBG and BCX types is substantially lower. In particular, the LCBG and BCX samples have a significant enhancement of galaxies at low dV, namely at of the cluster or roughly 300 km s-1, comparable to the characteristic binding energy of a typical galaxy. This enhancement is a factor of two relative to GV and RSX, and of the total fraction for each LCBG and BCX subpopulation.
The results of our clustering analysis might depend on where we draw the photometric boundaries between different populations because these boundaries are intended to delineate galaxies with distinct stellar populations. However, the differences should not be apparent when boundary shifts are made on scales comparable to the photometric errors (0.05 mag or less). We can test this with the green value (GV) sample that straddles the region in color-magnitude space (here rest-frame and ) between the red sequence and the blue cloud. Specifically, GV galaxies are defined to lie in a 0.2 mag wide band in that changes linearly with absolute magnitude (§3). Since the GV clustering statistics are similar to the RS clustering statistics, we expect that shifting the color-band to the red will not change the cluster statistics. Shifting the color-band sufficiently to the blue (0.2 mag) should change the GV clustering statistics to more closely resemble those of the BC. The rapidity of this change will depend on the uniformity of the clustering statistics within the BC sample, which subtends a broader color range than the GV sample. The relative similarity between BC and LCBG clustering statistics suggests the clusering statistics within the BC sample are rather uniform.
Accordingly, we’ve repeated the substructure measurements for the GV sample with 5%, 10% and 20% changes to their selection criteria, i.e., 0.05, 0.10 and 0.2 mag shifts to the red and the blue of the color-band in that defines the GV class. All of the shifts of the color-band to the red yield clustering statistics consistent with that of the nominal definition, as we expect. For shifts of the color-band to the blue, shifts of 0.05 mag yield no change; shifts of 0.10 mag yield clustering statistics intermediate between GV and BC samples; while 0.2 mag shifts yield clustering statistics comparable to the BC sample. We conclude, then, that the transition in the clustering properties between BC and RS/GV samples is rather rapid in color (0.10–0.15 mag), and robust to photometric errors.
6 Discussion
In this work, we have presented the spatial and kinematic distributions of several different galaxy populations in massive, intermediate-redshift clusters. As expected, the majority of cluster galaxies belong to the red sequence (RS) class. These have a compact distribution and show velocity and spatial distributions similar to low-redshift, massive clusters. The clusters also have a large fraction of blue (BC) galaxies as compared to lower redshift clusters. This blue population tends to be more extended and less centered than any of the other populations, but has a significant amount of subclustering, and velocity distribution boxier than the RS.
We focus our attention here on the two transitional classes of galaxies, LCBGs and GV galaxies, which have spatial extents intermediate between the BC and RS populations, but velocity distributions that are boxier than the BC population. The LCBGs and GV galaxies have different subclustering amplitudes comparable to the BC and RS populations, respectively. In addition, the LCBGs are distinguished by a slightly enhanced velocity dispersion.
6.1 The Distribution of LCBGs
The number density of LCBGs is enhanced in clusters, indicating that the cluster environment plays some role in triggering the starburst (Crawford et al., 2006, 2011); this effect has also been observed for sources around clusters at intermediate redshift (Marcillac et al., 2007; Fadda et al., 2008; Geach et al., 2011; Noble et al., 2013) and for optically-identified star-forming galaxies in low- and intermediate-redshift clusters (Balogh et al., 2004; Moss, 2006; Porter & Raychaudhury, 2007; Reverte et al., 2007; Porter et al., 2008; Oemler et al., 2009; Mahajan et al., 2012). A key aspect in understanding the evolution of cluster LCBGs and star-bursting galaxies is determining what triggers this phase of star formation.
We have presented several pieces of evidence to indicate that the LCBGs represent a distinct cluster population:
-
1.
LCBGs exhibit a radial velocity distribution which differs from that of RS galaxies, showing greater kurtosis.
-
2.
LCBGs in these clusters have, on average, a higher velocity dispersion than the other populations.
-
3.
The spatial distribution of LCBGs differs from the RS galaxies, since the latter are found in the cluster core while the former are not.
-
4.
LCBGs are more likely to occur in pairs or small groups as indicated by our subclustering analysis.
-
5.
LCBGs are more likely to have a velocity similar to their nearest neighbors in projected distribution on the sky.
The differences in velocity and spatial distribution indicate a population of galaxies that has not yet achieved equilibrium within the cluster. This distribution suggests that the LCBG class constitutes an infalling population and does not show the centrally-peaked velocity distribution expected for a backsplash population (i.e., a population that has passed through the central region of the cluster at least once; Gill et al., 2005).
For an infalling population, several possible triggers for star formation have been postulated: interaction with the ICM (Fujita & Nagashima, 1999), tidal forces within the cluster (Bekki, 1999), mergers of large subsubstructure (Bekki et al., 2010), and tidal interactions with other galaxies (Gnedin, 2003). In all likelihood, starbursts in clusters result from a diversity of causes, with each of the different methods contributing to the burst seen in the galaxy. We can examine the likelihood and evidence for the contribution of each of these different methods to the triggering of the LCBG phase.
Fujita & Nagashima (1999) suggested, based on hydrodynamic simulations, that star formation initially increases as a galaxy approaches the cluster due to compression from the ICM and then drops due to stripping from the ICM within 1 Mpc. Likewise, Kronberger et al. (2008) used simulations to find that ram pressure stripping can also increase star formation rates in galaxies by up to a factor of 3 and also create “stripped baryonic dwarf galaxies.” The pressure at which these processes becomes effective is much less than that required to strip the galaxy (Bekki & Couch, 2003), and so they can affect the star formation out to much larger radii. In Cl J1604+4304, we find evidence for “walls” of LCBGs which may be associated with shock fronts in the cluster ICM as proposed by Bekki et al. (2010). However, further investigation of the ICM properties in this cluster are necessary to confirm these findings.
Clusters are expected to gain up to 40% of their stellar mass via mergers with groups that have masses greater than (McGee et al., 2009). Simulations indicate that starbursts could be induced via tidal forces during the merger process in member galaxies of the group (Bekki, 1999) as well as interactions with shocks in the ICM causing synchronized bursts of star formation (Bekki et al., 2010). However, in only one of our clusters (MS 0451–03) do we find evidence that LCBGs are associated with large scale () substructure. On the other hand, within that substructure we do observe a very large fraction of LCBGs. In simulations, Cohn (2012) showed that only half of the simulated clusters experienced mergers with large groups, although those subgroups did tend to survive for long periods of time (4 Gyr for 50% disruption, albeit the DS test was unable to reproduce the substructure the majority of the time). From our small sample of clusters, it is difficult to establish a correlation between LCBGs and substructure.
Gnedin (2003) has shown that tidal heating, especially from close galaxy encounters, can substantially contribute to the heating of galaxies in a cluster. Furthermore, Tonnesen & Cen (2012) found in their simulations that bound pairs in high density regions had higher fractions of star-forming galaxies and that pair-bound galaxies also had a higher specific star-formation rate than the galaxy population as a whole. The pronounced subclustering of LCBGs at the smallest scales could be evidence that this is the dominant phase for triggering the starbursts. Of 89 LCBGs in our sample, 16 LCBGs have a confirmed nearby neighbor (within 100 kpc and 150 km s-1) with an additional 37 having a potential nearby neighbor (any source within 25 kpc). In their sample of low redshift LCBGs, Pérez-Gallego et al. (2011) find 45% of their sample to have a nearby companion within 25 kpc, which is similar to our fraction of potential neighbors.
6.2 Green Valley Galaxies
Our observations show that the phase-space distribution of GV galaxies is both similar to and different from the phase-space distribution of RS galaxies. GV galaxies have a similar mean velocity and velocity dispersion as the RS galaxies, but the distribution is boxier (i.e., having lower kurtosis) than the RS distribution. The subclustering of the two populations has the same behavior over different scales, yet, unlike the RS galaxies, GV galaxies appear to be completely absent from the cores of the clusters.
If we consider a simple model in which GV galaxies evolve from quenched BC galaxies that fall in along radial orbits, this constrains the timescale for the GV phase to a maximum of Gyr (Boselli & Gavazzi, 2006). This also corresponds to the typical time for galaxies to move from the blue cloud to the red sequence (Martin et al., 2007). Thus, the quenching of the galaxies has to begin near or beyond the virial radius, which would closely correspond to the onset of ram-pressure stripping in these clusters (Moran et al., 2007). The GV phase transition, expected to last only 100–200 Myr (Martin et al., 2007), would occur prior to the galaxy reaching the central cluster core.
However, this model is probably overly simplistic. In our massive clusters, the ratio of GV to BC galaxies is 0.3, which in this simple model would indicate either that the GV phase lasts closer to 300 Myr or that the infall rate was higher in the past. Other than the cored profile, the GV galaxies share many similarities in the spatial and velocity distribution as the RS galaxies, particularly in terms of subclustering. This indicates that the GV galaxies have been in the clusters for a longer time period than the BC population and have made multiple cluster crossings (assuming radial orbits). Wetzel et al. (2013) find that satellite galaxies are in clusters for 2-4 Gyrs prior to a rapid quenching period, which would be consistent with our results here.
Furthermore, the GV galaxies do not necessarily show signs of being a backsplash population (Gill et al., 2005), but our observations do not reach beyond the virial radius where differences in line of sight velocity may further distinguish between virial, infall, and backsplash populations (Mahajan et al., 2011). The GV do show an extended spatial distribution with many appearing on the outer edges of the cluster, suggesting that the quenching process may have started much earlier or been far more effective at transforming BC galaxies to GV galaxies. A picture consistent with our observations is one where GV galaxies have long been cluster members, but are preferentially on larger and more circular orbits which enable them to retain and convert more of their gas into stars over a longer time than their RS counterparts.
In the field at low redshift, GV galaxies constitute approximately 10% of the population (Chen et al., 2010). Of these, up to of the GV population show signs of AGN activity (Martin et al., 2007), with many of those only being X-ray detected AGN (Hickox et al., 2009). Further multi-wavelength studies will be required to assess whether or not cluster GV populations share a similar quenching mechanism with the field population.
7 Conclusions
We have explored the projected phase-space distributions of different classes of spectroscopically-confirmed members in five massive, intermediate-redshift clusters. The subclasses are defined by multi-band photometry and correspond to reproducible definitions comparable to those found in the literature for red sequence (RS), blue cloud (BC), green valley (GV), and luminous blue compact galaxies (LCBG). The GV class straddles the locus separating the BC and RS subclasses, and the LCBG class is a subset of the BC sample with high surface brightness and small size. We have further defined BCX and RSX subclasses identical to BC and RS, respectively, except for the exclusion of GV and LCBG galaxies.
We have employed a technique (a modification of the “shifting gapper”) which allows us to identify cluster members objectively and with minimum ambiguity. In accordance with previous studies, we find these distant clusters to harbor a larger fraction of BC galaxies compared to lower-redshift counterparts of comparable mass (). In these massive, compact clusters, the fraction of galaxies in each subclass corrected for incompleteness down to a fixed -band absolute magnitude of mag over the redshift range of our clusters is: % (RSX), % (GV), % (BCX), and % (LCBG).
Based on these spectroscopically-confirmed cluster members, we have measured the projected spatial and velocity distribution of all galaxy types in each cluster, including updated measurements of the velocity dispersion for each of the clusters. We have also measured the clustering properties of each galaxy subclass (based on Dressler & Shectman (1988)) over a wide range of clustering scales (following Colless & Dunn (1996)). The clustering properties and projected phase-space distribution of each galaxy subclass relative to the cluster barycenters show distinct patterns. This correlation of photometric, spatial, kinematic, and clustering properties hints at a causal connection between the star-formation history of cluster populations, their infall, and possibly their orbital structure.
Our spectroscopic observations and cluster-membership analysis confirm previous findings based solely on photometric data (Crawford et al., 2006) that, in contrast to the RS galaxies, BC and LCBG populations avoid the cluster core. The analysis here extends the finding of core-avoidance to the GV population. With these facts alone, it is tempting to link the LCBG and GV populations to subsets of the BC population that are in different phases of structural and dynamical transition from an infalling, starbursting population to an equilibrium, quiescent RS population. Specifically, we find all three classes (BCX, LCBG, and GV) have greater velocity kurtosis, spatial offset, and radial extent than RSX, with GV and LCBG being matchingly extreme in velocity kurtosis and spatial ellipticity. However, this simple interpretation is contradicted by clustering analysis which clearly links the LCBG galaxies to the BCX subclass by virtue of their close association with their nearest neighbor and small-scale structure. In distinction, the GV population has subclustering properties similar to the RSX population dominating the cluster cores.
These findings lead us to conclude the following regarding the transitional populations in these clusters:
-
•
GV galaxies are long-lived cluster members that may be on preferentially circular and larger-radius orbits than their RSX counterparts. Such orbits would help GV galaxies retain more of their gas and perpetuate star-formation relative to RSX galaxies. While this interpretation is not unique, added support comes from the fact that a simple infall model is not sufficient to fully explain the properties of the GV galaxies.
-
•
LCBGs are extreme in their blue color, high surface-brightness and small-scale clustering amplitude even within the BC population. These characteristics, combined with their systematically larger velocity dispersion compared to other cluster subclasses, depict LCBGs as a radially-infalling population with star formation enhanced by group interaction and impact with the intracluster medium.
In future work, we will probe the spectroscopic properties of these objects with the goal of obtaining definitive answers about the star-formation timescales and dynamical masses of the transition populations within these massive clusters.
References
- Anderson et al. (2009) Anderson, M. E., Bregman, J. N., Butler, S. C., & Mullis, C. R. 2009, ApJ, 698, 317
- Balogh et al. (2004) Balogh, M., Eke, V., Miller, C., et al. 2004, MNRAS, 348, 1355
- Barger et al. (1996) Barger, A. J., Aragon-Salamanca, A., Ellis, R. S., et al. 1996, MNRAS, 279, 1
- Beers et al. (1990) Beers, T. C., Flynn, K., & Gebhardt, K. 1990, AJ, 100, 32
- Bekki & Couch (2003) Bekki, K., & Couch, W. J. 2003, ApJ, 596, L13
- Bekki et al. (2010) Bekki, K., Owers, M. S., & Couch, W. J. 2010, ApJ, 718, L27
- Bekki (1999) Bekki, K. 1999, ApJ, 510, L15
- Biviano & Katgert (2004) Biviano, A., & Katgert, P. 2004, A&A, 424, 779
- Biviano & Poggianti (2009) Biviano, A., & Poggianti, B. M. 2009, A&A, 501, 419
- Biviano et al. (1997) Biviano, A., Katgert, P., Mazure, A., et al. 1997, A&A, 321, 84
- Borgani et al. (1999) Borgani, S., Girardi, M., Carlberg, R. G., Yee, H. K. C., & Ellingson, E. 1999, ApJ, 527, 561
- Boselli & Gavazzi (2006) Boselli, A., & Gavazzi, G. 2006, PASP, 118, 517
- Carlberg et al. (1997) Carlberg, R. G., Yee, H. K. C., & Ellingson, E. 1997, ApJ, 478, 462
- Chen et al. (2010) Chen, Y., Lowenthal, J. D., & Yun, M. S. 2010, ApJ, 712, 1385
- Cohn (2012) Cohn, J. D. 2012, MNRAS, 419, 1017
- Coil et al. (2008) Coil, A. L., Newman, J. A., Croton, D., et al. 2008, ApJ, 672, 153
- Colless & Dunn (1996) Colless, M., & Dunn, A. M. 1996, ApJ, 458, 435
- Cooper et al. (2008) Cooper, M. C., et al. 2008, MNRAS, 383, 1058
- Crawford et al. (2006) Crawford, S. M., Bershady, M. A., Glenn, A. D., & Hoessel, J. G. 2006, ApJ, 636, L13
- Crawford et al. (2009) Crawford, S. M., Bershady, M. A., & Hoessel, J. G. 2009, ApJ, 690, 1158
- Crawford et al. (2011) Crawford, S. M., Wirth, G. D., Bershady, M. A., & Hon, K. 2011, ApJ, 741, 98
- Donahue et al. (2003) Donahue, M., Gaskin, J. A., Patel, S. K., Joy, M., Clowe, D., & Hughes, J. P. 2003, ApJ, 598, 190
- Dressler & Gunn (1983) Dressler, A., & Gunn, J. E. 1983, ApJ, 270, 7
- Dressler & Shectman (1988) Dressler, A., & Shectman, S. A. 1988, AJ, 95, 985
- Dressler (1980) Dressler, A. 1980, ApJ, 236, 351
- Ellingson et al. (2001) Ellingson, E., Lin, H., Yee, H. K. C., & Carlberg, R. G. 2001, ApJ, 547, 609
- Faber et al. (2003) Faber, S. M., Phillips, A. C., Kibrick, R. I., et al. 2003, Proc. SPIE, 4841, 1657
- Fadda et al. (1996) Fadda, D., Girardi, M., Giuricin, G., Mardirossian, F., & Mezzetti, M. 1996, ApJ, 473, 670
- Fadda et al. (2008) Fadda, D., Biviano, A., Marleau, F. R., Storrie-Lombardi, L. J., & Durret, F. 2008, ApJ, 672, L9
- Fujita & Nagashima (1999) Fujita, Y., & Nagashima, M. 1999, ApJ, 516, 619
- Garland et al. (2004) Garland, C. A., Pisano, D. J., Williams, J. P., Guzmán, R.
- Geach et al. (2011) Geach, J. E., Ellis, R. S., Smail, I., Rawle, T. D., & Moran, S. M. 2011, MNRAS, 413, 177
- Gill et al. (2005) Gill, S. P. D., Knebe, A., & Gibson, B. K. 2005, MNRAS, 356, 1327
- Gnedin (2003) Gnedin, O. Y. 2003, ApJ, 589, 752
- Guzman et al. (1996) Guzman, R., Koo, D. C., Faber, S. M., et al. 1996, ApJ, 460, L5
- Guzman et al. (1997) Guzman, R., Gallego, J., Koo, D. C., et al. 1997, ApJ, 489, 559
- Gómez et al. (2003) Gómez, P. L., et al. 2003, ApJ, 584, 210
- Hayashi et al. (2010) Hayashi, M., Kodama, T., Koyama, Y., et al. 2010, MNRAS, 402, 1980
- Hernquist (1990) Hernquist, L. 1990, ApJ, 356, 359
- Hickox et al. (2009) Hickox, R. C., Jones, C., Forman, W. R., et al. 2009, ApJ, 696, 891
- Hilton et al. (2010) Hilton, M., Lloyd-Davies, E., Stanford, S. A., et al. 2010, ApJ, 718, 133
- Hwang & Lee (2008) Hwang, H. S., & Lee, M. G. 2008, ApJ, 676, 218
- Iannuzzi & Dolag (2012) Iannuzzi, F., & Dolag, K. 2012, MNRAS, 427, 1024
- Jørgensen & Chiboucas (2013) Jørgensen, I., & Chiboucas, K. 2013, AJ, 145, 77
- Kocevski et al. (2009) Kocevski, D. D., Lubin, L. M., Gal, R., Lemaux, B. C., Fassnacht, C. D., & Squires, G. K. 2009, ApJ, 690, 295
- Koo & Kron (1988) Koo, D. C., & Kron, R. G. 1988, ApJ, 325, 92
- Koo et al. (1994) Koo, D. C., Bershady, M. A., Wirth, G. D., Stanford, S. A., & Majewski, S. R. 1994, ApJ, 427, L9
- Kronberger et al. (2008) Kronberger, T., Kapferer, W., Ferrari, C., Unterguggenberger, S., & Schindler, S. 2008, A&A, 481, 337
- Kurtz & Mink (1998) Kurtz, M. J., & Mink, D. J. 1998, PASP, 110, 934
- Lopes et al. (2009) Lopes, P. A. A., de Carvalho, R. R., Kohl-Moreira, J. L., & Jones, C. 2009, MNRAS, 392, 135
- Lubin et al. (1998) Lubin, L. M., Postman, M., Oke, J. B., et al. 1998, AJ, 116, 584
- Lubin et al. (2004) Lubin, L. M., Mulchaey, J. S., & Postman, M. 2004, ApJ, 601, L9
- Mahajan et al. (2010) Mahajan, S., Haines, C. P., & Raychaudhury, S. 2010, MNRAS, 404, 1745
- Mahajan et al. (2011) Mahajan, S., Mamon, G. A., & Raychaudhury, S. 2011, MNRAS, 416, 2882
- Mahajan et al. (2012) Mahajan, S., Raychaudhury, S., & Pimbblet, K. A. 2012, MNRAS, 427, 1252
- Mahdavi et al. (1999) Mahdavi, A., Geller, M. J., Böhringer, H., Kurtz, M. J., & Ramella, M. 1999, ApJ, 518, 69
- Marcillac et al. (2007) Marcillac, D., Rigby, J. R., Rieke, G. H., & Kelly, D. M. 2007, ApJ, 654, 825
- Martin et al. (2007) Martin, D. C., Wyder, T. K., Schiminovich, D., et al. 2007, ApJS, 173, 342
- Maughan et al. (2008) Maughan, B. J., Jones, C., Forman, W., & Van Speybroeck, L. 2008, ApJS, 174, 117
- McGee et al. (2009) McGee, S. L., Balogh, M. L., Bower, R. G., Font, A. S., & McCarthy, I. G. 2009, MNRAS, 400, 937
- Mendez et al. (2011) Mendez, A. J., Coil, A. L., Lotz, J., et al. 2011, ApJ, 736, 110
- Moran et al. (2007) Moran, S. M., Ellis, R. S., Treu, T., Smith, G. P., Rich, R. M., & Smail, I. 2007, ApJ, 671, 1503
- Moss (2006) Moss, C. 2006, MNRAS, 373, 167
- Muzzin et al. (2012) Muzzin, A., Wilson, G., Yee, H. K. C., et al. 2012, ApJ, 746, 188
- Neumann & Arnaud (2000) Neumann, D. M., & Arnaud, M. 2000, ApJ, 542, 35
- Neumann & Bohringer (1997) Neumann, D. M., & Bohringer, H. 1997, MNRAS, 289, 123
- Newman (2010) Newman, J. A. 2010, in preparation
- Noble et al. (2013) Noble, A. G., Webb, T. M. A., Muzzin, A., et al. 2013, ApJ, 768, 118
- Oemler et al. (2009) Oemler, A., Jr., Dressler, A., Kelson, D., et al. 2009, ApJ, 693, 152
- Old et al. (2013) Old, L., Gray, M. E., & Pearce, F. R. 2013, arXiv:1306.6496
- Pérez-Gallego et al. (2011) Pérez-Gallego, J., Guzmán, R., Castillo-Morales, A., et al. 2011, MNRAS, 418, 2350
- Porter & Raychaudhury (2007) Porter, S. C., & Raychaudhury, S. 2007, MNRAS, 375, 1409
- Porter et al. (2008) Porter, S. C., Raychaudhury, S., Pimbblet, K. A., & Drinkwater, M. J. 2008, MNRAS, 388, 1152
- Postman et al. (2001) Postman, M., Lubin, L. M., & Oke, J. B. 2001, AJ, 122, 1125
- Ramírez & de Souza (1998) Ramirez, A. C., & de Souza, R. E. 1998, ApJ, 496, 693
- Ramírez et al. (2000) Ramírez, A. C., de Souza, R. E., & Schade, D. 2000, ApJ, 533, 62
- Reverte et al. (2007) Reverte, D., Vílchez, J. M., Hernández-Fernández, J. D., & Iglesias-Páramo, J. 2007, AJ, 133, 705
- Salim et al. (2009) Salim, S., Dickinson, M., Michael Rich, R., et al. 2009, ApJ, 700, 161
- Soifer et al. (1984) Soifer, B. T., Neugebauer, G., Helou, G., et al. 1984, ApJ, 283, L1
- Solanes et al. (2001) Solanes, J. M., Manrique, A., García-Gómez, C., et al. 2001, ApJ, 548, 97
- Tanaka et al. (2007) Tanaka, M., Hoshi, T., Kodama, T., & Kashikawa, N. 2007, MNRAS, 379, 1546
- Thompson (1986) Thompson, L. A. 1986, ApJ, 306, 384
- Tonnesen & Cen (2012) Tonnesen, S., & Cen, R. 2012, MNRAS, 425, 2313
- Tran et al. (2003) Tran, K.-V. H., Franx, M., Illingworth, G., Kelson, D. D., & van Dokkum, P. 2003, ApJ, 599, 865
- Tran et al. (2007) Tran, K.-V. H., Franx, M., Illingworth, G. D., et al. 2007, ApJ, 661, 750
- Tran et al. (2010) Tran, K.-V. H., Papovich, C., Saintonge, A., et al. 2010, ApJ, 719, L126
- Wetzel et al. (2013) Wetzel, A. R., Tinker, J. L., Conroy, C., & van den Bosch, F. C. 2013, MNRAS, 432, 336
- Willmer et al. (2006) Willmer, C. N. A., et al. 2006, ApJ, 647, 853
- Wirth et al. (2004) Wirth, G. D., et al. 2004, AJ, 127, 3121
- Wu et al. (2013) Wu, H.-Y., Hahn, O., Evrard, A. E., Wechsler, R. H., & Dolag, K. 2013, arXiv:1307.0011
- Wyder et al. (2007) Wyder, T. K., Martin, D. C., Schiminovich, D., et al. 2007, ApJS, 173, 293