Tuning the size and configuration of nanocarbon microcapsules:
aqueous method using optical tweezers
Abstract
To date, optical manipulation techniques for aqueous dispersions have been developed that deposit and/or transport nanoparticles not only for fundamental studies of colloidal dynamics, but also for either creating photonic devices or allowing accurate control of liquids on micron scales. Here, we report that optical tweezers (OT) system is able to direct three-dimensional assembly of graphene, graphite, and carbon nanotubes (CNT) into microcapsules of hollow spheres. The OT technique facilitates both to visualize the elasticity of a CNT microcapsule and to arrange a triplet of identical graphene microcapsules in aqueous media. Furthermore, the similarity of swelling courses has been found over a range of experimental parameters such as nanocarbon species, the power of the incident light, and the suspension density. Thanks to the universality in evolutions of rescaled capsule size, we can precisely control the size of various nanocarbon microcapsules by adjusting the duration time of laser emission.
Carbon atoms arranged in a honeycomb-like lattice constitute the common building blocks of not only graphite but also other carbon nanomaterials including fullerene, carbon nanotubes (CNTs), and graphene assembly-book ; graphene . The individual particles of these nanocarbons possess unique mechanical, electronic, and optical properties, and there is a variety of assembly techniques for displaying these properties macroscopically or mesoscopically assembly-review1 ; capsule-review ; hybrid . Correspondingly, the hollow-caged superstructure of the graphene or CNT assembly has been fabricated in several ways capsule-review ; capsule-graphene1 ; capausle-graphene2 ; capsule-graphene3 ; capsule-shinkai ; capsule-emulsion1 ; capsule-shi ; opt-capsule ; capsule-lumi ; capsule-IR ; capsule-sensing . The majority of methods developed for these capsular organizations are classified as layer-by-layer (LbL) assembly techniques capsule-review ; capsule-graphene1 ; capausle-graphene2 ; capsule-graphene3 ; capsule-shinkai ; capsule-emulsion1 ; capsule-shi ; capsule-IR ; capsule-sensing . The LbL method includes the step of depositing charged nanocarbon particles on spherical templates, such as polymer colloids and water droplets in oil, and necessarily involves a final step to remove the template cores capsule-review ; capsule-graphene1 ; capausle-graphene2 ; capsule-graphene3 ; capsule-shinkai ; capsule-emulsion1 ; capsule-shi ; capsule-IR ; capsule-sensing . There is also a recent report that CNT assembly is optically directed to form spheres on the ends of optical fibers without the addition of core materials opt-capsule .
Our concern relates to the last finding of optically directed three-dimensional (3D) assembly opt-capsule , which is further traced back to the optical deposition of CNTs or graphene on the end of an optical fiber deposition-1 ; deposition-monitor ; deposition-2 ; graphene-deposition ; graphene-device1 ; graphene-device4 ; graphene-deposition2 . It has been demonstrated that these aggregates themselves can form photonic devices with fascinating properties such as an ultrafast recovery time, ultrafast saturable absorbance, and optical nonlinearity deposition-1 ; deposition-monitor ; deposition-2 ; graphene-deposition ; graphene-device1 ; graphene-device4 ; graphene-deposition2 ; graphene-cnt-device ; therefore, capsular structures may have potential applications in electrochemical or photonic devices, as well as in drug delivery and biosensors capsule-lumi ; capsule-IR ; capsule-sensing . Although the simplicity of the optical process is expected to facilitate practical applications, there remain both technical and fundamental issues as follows: (i) The optical fiber system used previously opt-capsule ; deposition-1 ; deposition-monitor ; deposition-2 ; graphene-deposition ; graphene-device1 ; graphene-device4 ; graphene-deposition2 has difficulty in both fabrication and manipulation, such that the CNT sphere adheres to the end of the fiber during the 3D assembly and must be removed to repeat the optical fabrication using the same fiber opt-capsule . The existing optical techniques opt-capsule ; deposition-1 ; deposition-monitor ; deposition-2 ; graphene-deposition ; graphene-device1 ; graphene-device4 ; graphene-deposition2 are thus unsuitable for both the sequential processing and the position adjustment. (ii) Furthermore, the growth processes need to be clarified so that we may manage the optical swelling; it seems difficult to precisely control the capsule size, if it is the microbubble generation by local heating opt-capsule ; gold ; metallic ; gold2 ; vapor-1 ; vapor-plasma ; vapor-2 ; vapor-3 that plays an essential role in forming the 3D assembly.
Here we settle these problems together using optical tweezers (OT) ot-grier ; ot-review ; ot-sort ; ot-book ; trap-grier ; trap-1 ; trap-2 ; trap-3 ; trap-4 ; gtrap1 ; gtrap2 . Optical tweezing is not only among the most established and popular methods for optical trapping and manipulation of micro-and nano-objects including CNTs and graphene flakes trap-grier ; trap-1 ; trap-2 ; trap-3 ; trap-4 ; gtrap1 ; gtrap2 , but also provides emerging applications for analysis or transportation including weak force measurements, particle sorting, and optofluidics combined with the microfluidic toolkit ot-review ; ot-sort ; ot-book . In contrast to the fiber system, the OT technique is free of any restrictions on the controllability of the distance between the focal point and the surrounding objects, such as the cover slip and a microneedle inserted for manipulations. Taking full advantage of the versatility of this technique, the technical limitations associated with the fiber systems could be overcome.
In what follows, we aim to demonstrate that the OT method is capable of tuning the size and configuration of nanocarbon capsules; for instance, a desired configuration of microcapsule arrays is created in aqueous media. Furthermore, the controllability of capsule size is validated from investigating a variety of swelling kinetics in dispersed nanocarbons such as CNTs, graphenes and graphites. In addition to the nanocarbon species, we have changed the experimental parameters including the solvent temperature , the incident laser power , and the density of nanocarbon dispersoids.
Results
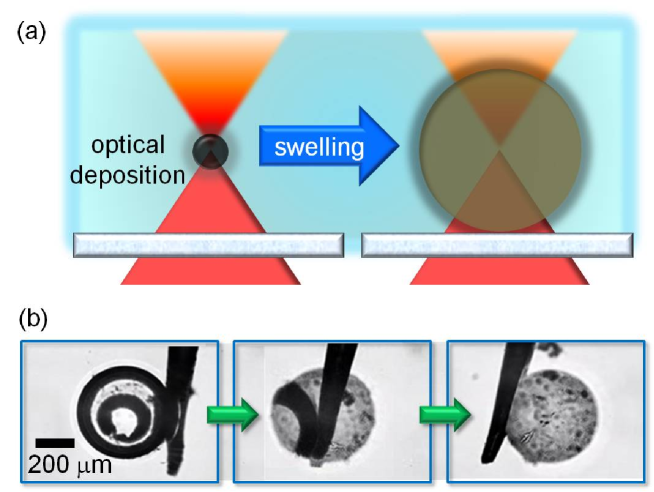
Manipulating nanocarbon microcapsules. The technical point, which we have discovered, is to place the laser focus of OT system above an ordinary cover slip on which a drop of nanocarbon suspension is mounted, so that one could find that a spherical nanocarbon assembly, whose center is located at the focal point, is swelling larger as the duration time of laser emission is longer (see Fig.1(a) as a schematic of the growth process). We have adhered a swollen CNT sphere to a tungsten microneedle by the position adjustment of both the microcapsule and microneedle using the OT system and micromanipulator, respectively, which enables one not only to lift the attached object from the substrate by positional control of the microneedle, but also to rotate the CNT sphere together with the attached microneedle (see Fig. 1(b) and Supplementary Movie 1). Thanks to the in situ observations, the 3D structure of spherical shape has been clarified.
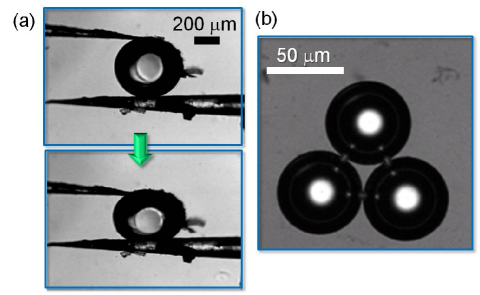
In Fig. 2(a) and Supplementary Movie 2, we see that capsule deformation is induced by exerting mechanical stress on a sandwiched CNT microcapsule via a pair of microneedles. The relaxation to the initial isotropic state, observed in Movie 2, exhibits that the elasticity is imparted by the void space. It has also been found from long-term observation that confined 3-m colloids continue to undergo Brownian motion without permeating the carbon shell (see Supplementary Movie 3), which suggests no holes of several microns on the spherical surface.
The OT system is also able to create a triangular array of graphene microcapsules (Fig. 2(b)) which are detachable from each other, by adjusting the focal position independently of that of the cover slip. These microcapsules have an almost equal diameter, because they are fabricated by changing the focal position from one point to another at regular intervals with the laser path shuttered while maintaining the solvent temperature at .
A universal behavior of growth processes. For systematically accomplishing the size-control, various growth processes need to be quantified; therefore, we have measured the diameter of a swelling microcapsule at a time specified by , which is almost equal to the duration of the laser emission. Strictly speaking, the initial time, , was operationally defined by the instant when the CCD camera used for the long-term observations began to detect an optically deposited nucleate.
As a minimal model to reproduce the swelling kinetics of nanocarbon microcapsules, we consider a typical equation of relaxational phenomena:
| (1) |
whose solution is given by
| (2) | |||||
| (3) |
Here and correspond to the relaxation time and the DC component of the swelling velocity, respectively, denotes the maximum diameter at saturation, and the emergence time defined mathematically: . Equation (1) describes the competition between the DC component of driving velocity for swelling and the declining rate against expansion. Correspondingly, the maximum diameter is given by the ratio of to (see eq. (3)).
As found from eq. (2), the time evolution of rescaled size defined by depends only on time parameters of , , and an arbitrary reference time :
| (4) |
which implies that a universal curve of is delineated by collecting various growth processes with similar times of both emergence and relaxation.
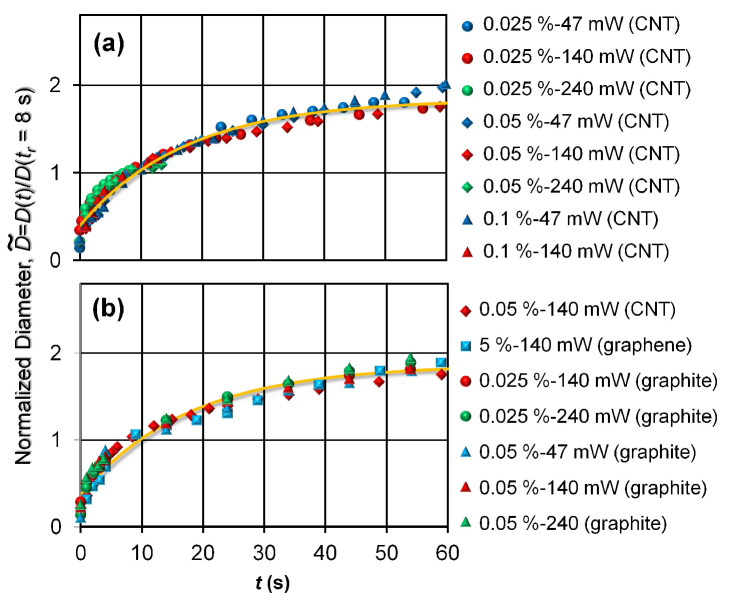
The dynamic universality, predicted by eq. (4), has been corroborated by gathering various swelling processes at in Fig. 3 where the normalized size is plotted consistently using an identical reference time . We set that sec. because growing CNT microcapsules at the maximal power of 240 mW became unstable beyond the present duration time and showed a sudden drop in diameter prior to saturation (see Fig. 4 and Supplementary Movie 4).
It is remarkable that Fig. 3 exhibits the generic kinetics at , which is common to the incident laser power, suspension density and nanocarbon species. We can describe the universal behavior by applying eq. (4) to the rescaled length as before, and both fitting curves of Figs. 3(a) and 3(b) obtain sec. and . In Supplementary Tables S1 and S2, we have fitting results for a variety of without rescaling, which are in the range of and when incident laser powers, suspension densities and nanocarbon species are varied. These variances of and underlie the universality depicted in Fig. 3. In other words, the rescaled plot of facilitates to discriminate the variance in and/or .
The duration of the laser emission at was also determined, using a fast CMOS camera, which was approximately two seconds consistently with the fitting result of ; incidentally, the fast CMOS camera detected the emergence of carbon nucleates after a mean laser duration of about one second irrespectively of experimental conditions.
Swelling mechanism. Both the symmetric shape and the hollow space of more than 100 m in diameter reveal that the OT system is exerting an isotropic pressure over a long-ranged scale around the focal point, which suggests the existence of an optofluidic flow other than the inherent anisotropic force due to the optical gradient or scattering ot-sort . We investigate the details of without use of the rescaled plot so that it may be explored what are determining factors of inducing the optofluidic flow.
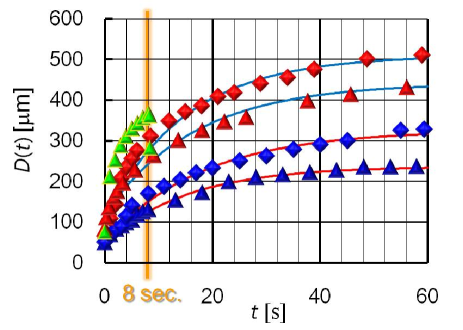
Figure 4 shows the change of when the incident laser power at the focal point or the suspension density varies, from which we extrapolate that the capsule diameter at saturation is larger with increase of and/or . Supplementary Tables S1 and S2, the fitting results using eq. (2), actually verify that is increased by raising and is slightly larger for a higher density of CNTs, whereas is enhanced by increasing but is weakly dependent on ; at the maximal power of mW, we have found it difficult to appropriately fit eq. (2) to the corresponding data, due to the capsule breaking at an intermediate stage (see Supplementary Movie 4 as well as Fig. 4).
The -dependencies on and can be explained by the change of temperature difference between the focal temperature and the solvent temperature maintained at . It has been found that the amount of absorbed light increases with increase of before reaching the saturation limit cnt-limiting ; graphene-limiting , as well as nanocarbon density of the focal deposition which is not necessarily proportional to the bulk concentration . It follows that the focal temperature becomes higher while the solvent temperature remains , thereby creating a larger thermal gradient due to the increase of . Accordingly, the aforementioned increment of is ascribable to the steepening of thermal gradient gold ; metallic ; gold2 ; thermo-piazza ; thermo-gold ; thermo-review which is caused by elevating and is induced to some extent by increasing ; it is to be noted that the marginal -contribution arises not only from the nonlinear relation between the bulk and deposited densities, but also from the enhancement of depositing flow with increase of , which is in the opposite direction of .
We also changed the solvent temperature , as well as . Figure 5 compares the time dependencies of in CNT suspensions at and with the other parameters equally set to mW and . The optical micrograph in Fig. 5 represents an initial state at where the duration of the laser emission, determined using a fast CMOS camera, was approximately two seconds as mentioned before, which displays that the capsule interior is filled with microbubbles in the initial stage. This microscopy image in Fig. 5 also exhibits not only a minimal size of generated microcapsules, but also a shell thickness of approximately 20 m. The apparent generation of microbubbles has revealed that the CNT dispersoids actually absorb light and raise the focal temperature in the present experimental conditions, as reported so far opt-capsule ; vapor-plasma ; vapor-2 ; cnt-limiting . In contrast, the optical microscopy of CNT microcapsules at is unable to distinguish microbubbles even at the maximal laser power (see Supplementary Movie 4). Despite the clear difference in observations, these growth processes have a common feature that the increasing rate of is explosively large at the initial stage, and subsequently slows down toward the saturated state.
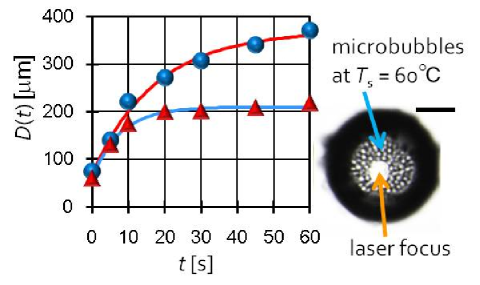
Despite the clear difference in observations, these growth processes have a common feature that the increasing rate of is explosively large at the initial stage, and subsequently slows down toward the saturated state. Comparing the long-time behaviors of at different solvent temperatures in Fig. 5, one finds that is smaller in a higher-temperature solvent (). According to the fitting results in Supplementary Table S3, is scarcely varied, whereas is reduced larger in correspondence with the decrease of solvent viscosity due to the increase of : we have , with the subscripts denoting the solvent temperatures. This means that the reduction of the maximum diameter is mainly caused by the viscosity diminishment associated with the -change. We thus find that the increase of makes a little change in the temperature difference , and that the existence of microbubbles is not essential in enhancing the capsule growth beyond the viscosity reduction due to the increase of , which is consistent with the previous observations of microbubbles as scavengers of dispersed CNTs opt-capsule ; vapor-plasma ; vapor-2 .
Discussion
To summarize, the OT system has been found to be a fascinating tool for tuning the size and configuration of nanocarbon microcapsules in aqueous media, which is ensured by a universal behavior of swelling courses that applies to a range of incident light power , nanocarbon density , and nanocarbon species as displayed by Fig. 3. Our finding of the generic kinetics enables one to efficiently control the capsule size by interpolating the appropriate duration time of laser emission even in an intermediate condition of and/or .
For addressing the swelling mechanism in more detail, one should note the fitting results in Fig. 5 (see also Supplementary Table S3). This indicates that the reduction of the maximum diameter is mainly caused by the viscosity diminishment associated with the -change. In other words, the increase of makes a little change in the temperature difference , and that the existence of microbubbles is not essential in enhancing the capsule growth beyond the viscosity reduction due to the increase of , which is consistent with the previous observations of microbubbles as scavengers of CNTs, instead of the dispersers opt-capsule ; vapor-plasma ; vapor-2 .
Combining the -dependence with the kinetic variations due to the change of and (see Figs. 4 and 5), we conclude that the optical swelling of deposited nanocarbons does not necessarily require the existence of microbubbles, and that a key candidate of swelling factors is optofluidic migration, such as thermophoresis of nanocarbons, induced by the thermal gradient thermo-piazza ; thermo-gold ; thermo-review ; thermo-sano ; thermo-maeda ; however, an elaborate theory remains to be developed based on the recent advances in the theoretical treatments of thermal dynamics for colloids thermo-piazza ; thermo-gold ; thermo-review ; thermo-opt ; thermo-wurger2 ; thermo-wurger3 , aiming to validate the phenomenological equation (1), and to elucidate why the relaxation times are close as shown in Fig. 3. In addition, it is an open problem whether microbubbles, which optical microscopy at had difficulty in detecting, are indispensable for the nucleation of hollow microcapsule (or the optical deposition of CNTs opt-capsule ; deposition-1 ; deposition-monitor ; deposition-2 ; graphene-deposition ; graphene-device1 ; graphene-device4 ; graphene-deposition2 ) that emerges from the homogeneous dispersion.
Finally, we note a technical advantage of the OT method. Figures 1 and 2, as well as Supplementary Movies 1 and 2, have demonstrated that the OT method is able not only to fabricate nanocarbon microcapsule arrays of required configuration, but also to manipulate and deform a single microcapsule. The use of programmed OT system would be helpful for fabricating more complicated configurations than the triangular arrays of microcapsules (see Fig. 2(b)), though any polymerization in the shells is further required in order to prevent the dried microcapsules from collapsing. Furthermore, the OT system is capable of accomplishing an alternative LbL assembly: a CNT microcapsule can be easily covered with a graphene shell by simply exchanging the surrounding suspension. We envisage the use of the OT method for creating various arrays of hybrid nanocarbon microcapsules that meet engineering demands hybrid .
Methods
Materials. We used the aqueous suspensions of carboxylated multi-walled CNTs (3 wt%, Cluster Instruments), which was diluted to densities of 0.05 wt% and 0.025 wt%. By contrast, to prepare aqueous 0.025 wt% dispersions of graphite, we wrapped the carbon dispersoids with DNA via the following procedure, the same steps in preparing aqueous solution from unmodified CNT soot: The graphite powder (2 m in average size, Ito Graphite) was suspended by sonication in an aqueous solution with 0.025-wt% salmon DNA (Wako) that was denatured by heating for ten minutes at . Subsequently, the suspensions were centrifuged at 650g for ten minutes to extract the carefully decanted supernatants. We also used a graphene suspension (Nanointegris) with a density of 5 wt%. For all of the experiments, a 100-l drop of the suspension was mounted on an ordinary cover slip (NEO, Matsunami). No seals were used for eliminating a boundary effect on the swelling processes, so that microcapsules could be manipulated using microneedles; incidentally, we verified that the open densification of the drops due to optical heating for five minutes yielded a maximal change in the density of the suspension of less than 10 %. The spherical colloids used are carboxylate-modified polystyrene particles (3 m in diameter, Dainichi Seika), which were included with the nanocarbon microcapsules to track Brownian motions of the confined particles.
Experimental setup. The OT system (MMS, Sigma Koki) is composed of an inverted optical microscope (TE2000-U, Nikon) with an objective lens (Plan Fluor ELWD , Nikon), a cw Nd:YAG laser (), and other optical devices including a CCD camera (Retiga Exi, Q-Imaging) and a fast CMOS camera (PL-A741, Pixelink). The microscope stage was heated with a silicone rubber electric heating sheet and was maintained at either or using a temperature controller (DB1000, CHINO). The light intensity at the focal point ranged from 5 mW to 300 mW, and the longest laser emission duration was 250 seconds. To manipulate the hollow microcapsules, we used a tungsten microneedle with a tip diameter of 500 nm under the control of a patch clamp micromanipulator (NMN-21, Narishige).
References
References
- (1) Jorio, A., Dresselhaus, M. S. & Dresselhaus, G. Carbon nanotubes: advanced topics in the synthesis, structure, properties and applications. (Springer, New York, 2008).
- (2) Geim, A. K. Graphene: Status and Prospects. Science 324, 1530-1534 (2009).
- (3) Lee, S. H., et al. Tailored assembly of carbon nanotubes and graphene. Adv. Funct. Mater. 21, 1338-1354 (2011).
- (4) Hong, J. et al. Carbon-based layer-by-layer nanostructures: from films to hollow capsules. Nanoscale 3, 4515-4531 (2011).
- (5) Yu, D. & Dai, L. Self-assembled graphene/carbon nanotube hybrid films for supercapacitors. J. Phys. Chem. Lett. 1, 467-470 (2010).
- (6) Hong, J., Char, K. & Kim, B. S. Hollow capsules of reduced graphene oxide nanosheets assembled on a sacrificial colloidal particle. J. Phys. Chem. Lett. 1, 3442-3445 (2010).
- (7) Guo, P., Song, H. & Chen, X. Hollow graphene oxide spheres self-assembled by W/O emulsion. J. Mater. Chem. 20, 4867-4874 (2010).
- (8) Sohn, K. et al. Oil absorbing graphene capsules by capillary molding. Chem. Commun. 48, 5968-5970 (2012).
- (9) Sano, M. et al. Noncovalent self-assembly of carbon nanotubes for construction of “cages.” Nano Lett. 2, 531-533 (2002).
- (10) Yi, H. X., Song, H. H. & Chen, X. H. Carbon nanotube capsules self-assembled by W/O emulsion technique. Langmuir 23, 3199-3204 (2007).
- (11) Shi, J. et al. Multiwalled carbon nanotube microspheres from layer-by-layer assembly and calcination. J. Phys. Chem. C 112, 11617-11622 (2008).
- (12) Kashiwagi, K., Yamashita, S., & Set, S. Y. Optically formed carbon nanotube sphere. Opt. Express 16, 2528-2532 (2008).
- (13) Chen, Q. et al. Enhanced hot-carrier luminescence in multilayer reduced graphene oxide nanospheres. Sci. Rep. 3, 2315 (2013).
- (14) Kurapati, R. & Raichur, A. M. Near-infrared light-responsive graphene oxide composite multilayer capsules: a novel route for remote controlled drug delivery. Chem. Commun. 49, 734-736 (2013).
- (15) Ma, J. et al. The layer-by-layer assembly of polyelectrolyte functionalized graphene sheets: a potential tool for biosensing. Colloids and Surfaces A 426, 6-11 (2013).
- (16) Nicholson, J. W., Windeler, R. S. & DiGiovanni, D. J. Optically driven deposition of single-walled carbon-nanotube saturable absorbers on optical fFiber end-faces. Opt. Express 15, 9176-9183 (2007).
- (17) Kashiwagi, K., Yamashita, S., & Set, S. Y. In-situ monitoring of optical deposition of carbon nanotubes onto fiber end. Opt. Express 17, 5711-5715 (2009).
- (18) Martinez, A. et al. Optical deposition of graphene and carbon nanotubes in a fiber ferrule for passive mode-locked lasing. Opt. Express 18, 23054-23061 (2010).
- (19) Luo, Z. et al. Graphene-based passively Q-switched dual-wavelength erbium-doped fiber laser. Opt. Lett. 35, 3709-3711 (2010).
- (20) Popa, D. et al. Graphene Q-switched, tunable fiber laser. Appl. Phys. Lett. 98, 073106 (2011).
- (21) Kim, H. et al. Deformation-immunized optical deposition of graphene for ultrafast pulsed lasers. Appl. Phys. Lett. 98, 021104 (2011).
- (22) Ismail, M. A. et al. A Q-switched erbium-doped fiber laser with a graphene saturable absorber. Laser Phys. Lett. 10, 025102 (2013).
- (23) Wang, J. et al. Carbon nanotubes and nanotube composites for nonlinear optical devices. J. Mater. Chem. 19, 7425-7443 (2009).
- (24) Seol, Y. et al. Gold nanoparticles: enhanced optical trapping and sensitivity coupled with significant heating. Opt. Lett. 31, 2429-2431 (2006).
- (25) Coronado, E. A. et al. Optical properties of metallic nanoparticles: manipulating light, heat and forces at the nanoscale. Nanoscale 3, 4042-4059 (2011).
- (26) Ma, H., et al. Large-scale orientation dependent heating from a single irradiated gold nanorod. Nano Lett. 12, 3954-3960 (2012).
- (27) Taylor, R. A. et al. Vapor generation in a nanoparticle liquid suspension using a focused, continuous laser. Appl. Phys. Lett. 95, 161907 (2009).
- (28) Ramachandran, H. et al. Optical-tweezer-induced microbubbles as scavengers of carbon nanotubes. Nanotechnology 21, 245102 (2010).
- (29) Liu, Z. et al. Optical manipulation of plasmonic nanoparticles, bubbles formation and pattering of SERS aggregates. Nanotechnology 21, 105304-105308 (2010).
- (30) Dharmadhikari, . K. et al. Dynamics of photothermally created vaporous, gaseous, and mixed microbubbles. J. Phys. Chem. C 115, 6611-6617 (2011).
- (31) Grier, D. G. A revolution in optical manipulation. Nature 424, 810-816 (2003).
- (32) Psaltis, D. Quake, S. R. & Changhuei, Y. Developing optofluidic technology through the fusion of microfluidics and optics. Nature 442, 381-386 (2006).
- (33) Jona, A. & Zemanek, P. Light at work: the use of optical forces for particle manipulation, sorting, and analysis. Electrophoresis 29, 4813-4851 (2008).
- (34) Chakraborty, S. ed., Microfluidics and Microfabrication (Springer, New York, 2010).
- (35) Plewa, J. et al. Processing carbon nanotubes with holographic optical tweezers. Opt. Express 12, 1978-1981 (2004).
- (36) Tan, S. et al. Optical trapping of single-walled carbon nanotubes. Nano Lett. 4, 1415-1419 (2004).
- (37) Rodgers, T. et al. Selective aggregation of single-walled carbon nanotubes using the large optical field gradient of a focused laser beam. Phys. Rev. Lett. 101, 127402 (2008).
- (38) Zhang, J. et al. Multidimensional manipulation of carbon nanotube bundles with optical tweezers. Appl. Phys. Lett. 88, 053123 (2006).
- (39) Marago, O. M. et al. Optical trapping of carbon nanotubes. Physica E 40, 2347-2351 (2008).
- (40) Marago, O. M. et al. Brownian motion of graphene. ACS Nano 4, 7515-7523 (2010).
- (41) Twombly, C. W. et al. Optical manipulation of self-aligned graphene flakes in liquid crystals. Opt. Express 21, 1324-1334 (2013).
- (42) Riggs, J. E. et al. Optical limiting properties of suspended and solubilized carbon Nanotubes. J. Phys. Chem. B 104, 7071-7076 (2000).
- (43) Bonaccorso, F. et al. Graphene photonics and optoelectronics. Nat. Photonics 4, 611 - 622 (2010).
- (44) Piazza, R. Thermophoresis: moving particles with thermal gradients. Soft Matter 4, 1740-1744 (2008).
- (45) Rasuli, S. R. & Golestanian, R. Soret motion of a charged spherical colloid. Phys. Rev. Lett. 101, 108301 (2008).
- (46) Wurger, A. Thermal non-equilibrium transport in colloids. Rep. Prog. Phys. 73, 126601 (2010).
- (47) Jiang, H. R. et al. Manipulation of colloids by a nonequilibrium depletion force in a temperature gradient. Phys. Rev. Lett. 102, 208301 (2009).
- (48) Maeda, Y. T., Buguin, A. & Libchaber, A. Thermal separation: interplay between the Soret effect and entropic force gradient. Phys. Rev. Lett. 107, 038301 (2011).
- (49) Schermer, R. T. et al. Laser-induced thermophoresis of individual particles in a viscous liquid. Opt. Express 19, 10571-10586 (2011).
- (50) Majee, A. & Wurger, A. Charging of heated colloidal particles using the electrolyte seebeck effect. Phys. Rev. Lett. 108, 118301 (2012).
- (51) Majee, A. & Wurger, A. Thermocharge of a hot spot in an electrolyte solution. Soft Matter 9, 2145-2153 (2013).
| [mW], [wt%] | [s] | [s] | [m/s] | [ m] |
|---|---|---|---|---|
| 47,0.025 | 0.2 | 15 | 16 | 2.4 |
| 47,0.05 | 0.2 | 18 | 18 | 3.3 |
| 47,0.1 | 0.2 | 20 | 17 | 3.3 |
| 140,0.025 | 0.3 | 17 | 26 | 4.4 |
| 140,0.05 | 0.2 | 15 | 34 | 5.1 |
| [mW], [wt%] | solutes | [s] | [s] | [m/s] | [ m] |
|---|---|---|---|---|---|
| 140,5 | graphene | 0.2 | 20 | 12 | 2.4 |
| 47,0.05 | graphite | 0.3 | 21 | 7.0 | 1.6 |
| 140,0.05 | graphite | 0.3 | 20 | 16 | 3.2 |
| 240,0.05 | graphite | 0.3 | 21 | 20 | 4.9 |
| 240,0.025 | graphite | 0.2 | 18 | 20 | 3.6 |
| [mPas] | [s] | [s] | [m/s] | [ m] | |
|---|---|---|---|---|---|
| 25 | 0.894 | 0.2 | 17 | 21 | 3.7 |
| 60 | 0.467 | 0.3 | 8 | 24 | 2.0 |