REEVALUATING OF THE FEASIBILITY OF GROUND-BASED EARTH-MASS MICROLENSING PLANET DETECTIONS
Abstract
One important strength of the microlensing method in detecting extrasolar planets is its high sensitivity to low-mass planets. However, it is often believed that microlensing detections of Earth-mass planets from ground-based observation would be difficult due to the limit set by finite-source effects. This view comes from the previous estimation of the planet detection probability based on the fractional deviation of planetary signals, but proper probability estimation requires to additionally consider the source brightness, which is directly related to the photometric precision. In this paper, we reevaluate the feasibility of low-mass planet detections considering photometric precision for different populations of source stars. From this, it is found that contribution of the improved photometric precision to the planetary signal of a giant-source event is big enough to compensate the decrease of the magnification excess caused by finite-source effects. As a result, we find that giant-source events are suitable targets for Earth-mass planet detections with significantly higher detection probability than events involved with source stars of smaller radii and predict that Earth-mass planets would be detected by prospective high-cadence surveys.
Subject headings:
gravitational lensing: micro – planetary systems1. Introduction
Searches for extrasolar planets by using the microlensing method is being conducted toward the Galactic bulge field (OGLE: Udalski (2003), MOA: Bond et al. (2001), Sumi et al. (2003), Wise: Shvartzvald & Maoz (2012)). Due to the high sensitivity to planets that are difficult to be detected by other methods, the method is important for the comprehensive understanding of the formation and evolution of planets in various types of stars (Mao & Paczyński, 1991; Gould & Loeb, 1992; Gaudi, 2012).
One of the important strength of the microlensing method is that it is sensitive to low-mass planets. This is because the amplitude of a microlensing planetary signal does not depend on the planet mass for a point source, although the duration of the signal becomes shorter with the decrease of the planet mass. In practice, the low mass limit of a microlensing planet is set by finite-source effects which wash out planetary signals. For giant source stars, the size of the caustic induced by an Earth-mass planet is equivalent to the angular size of the source star and thus the planetary signal is significantly weakened due to severe finite-source effects. For events associated with a main-sequence (MS) star, on the other hand, the attenuation of the planetary signal is mild but poor photometric precision caused by the source faintness limits secure detections from ground-based observation. As a result, it is often believed that detecting Earth-mass planets from ground-based observation would be difficult.
The difficulty of detecting Earth-mass planets from ground-based microlensing observation was first pointed out by Bennett & Rhie (1996). The basis of their result lies on their estimation of the planet detection probability based on the simulation of planetary lensing events involved with various types of source stars. In their simulation, they computed the fractional deviation of the lensing magnification, , and estimated the detection probability by imposing a threshold deviation. Here and represent the lensing magnifications with and without the presence of the planet, respectively. With this criterion, the planet detectability is mostly decided by the severeness of finite-source effects and thus they reached a conclusion that the detection probability of giant-source events would be significantly lower than the probability of events associated with faint source stars with smaller radii. Based on this result, Bennett & Rhie (2002) proposed a space-based microlensing experiment in search for Earth-mass planets by resolving faint MS stars.
However, proper estimation of the planet detection probability requires to additionally consider the source brightness. This is because the strength of a planetary signal depends not only on the amplitude of the planetary deviation, , but also on the photometric uncertainty, , which is directly related to the source brightness. Here and represent the observed source fluxes with and without the planet, respectively. In addition to the direct decrease of photon noise with the increased photon count, photometric precision further depends on the source brightness because bright source events are likely to be less affected by blending.
In this paper, we reevaluate the feasibility of ground-based detections of Earth-mass planets by additionally considering the dependence of photometric precision and blending on the source type. In Section 2, we describe the simulation of planetary lensing events conducted for the estimation of the probability. In Section 3, we present results from the analysis. We summarize the result and conclude in Section 4.
2. Simulation
In order to evaluate the feasibility of ground-based Earth-mass planet detections, we conduct simulations of Galactic microlensing events. The simulation is based on representative lensing events following current and/or prospective Galactic microlensing surveys.
For the lens, we assume that the mass of the primary lens is by adopting that of the most common lens population of low-mass stars (Han & Gould, 1995). Then, the mass ratio of an Earth-mass planet to the lens is . We adopt an Einstein time scale of days and assume that events are observed with a 10 minute cadence following the observational strategy of the prospective ground-based survey of the Korean Microlensing Telescope Network (KMTNet: Kim et al., 2010). Following the OGLE lensing survey, we assume that images are taken in band.
| source | ||||
|---|---|---|---|---|
| main-sequence | 19.5 | 4.00 | 0.001 | 0.40 |
| subgiant | 18.0 | 1.00 | 0.003 | 0.45 |
| giant | 16.5 | 0.25 | 0.010 | 0.48 |
Note. — : unlensed, unblended source brightness, : blend to source flux ratio, : source radius normalized by the Einstein radius, : linear limb-darkening coefficient
For the source, we test three representative stellar populations of Galactic bulge stars including MS, subgiant, and giant stars. For the source radii normalized by the Einstein radius , we adopt , , and for the individual source stars, which roughly correspond to the physical source radii of the , , and , respectively. Considering the stellar types and distance to the Galactic bulge, and adopting an average extinction (Nataf et al., 2013), we assume that the unlensed, unblended, apparent -band magnitudes of the individual source stars are , , and , respectively. In Table 1, we summarize the characteristics of the individual source stars.
For realistic simulations of lensing light curves, photometric errors are estimated by using the relation between the photometric uncertainty and the source brightness that is obtained based on actual events observed by the OGLE survey. For this, we choose multiple number of events with wide spans of lensing magnification and take an average value as a representative uncertainty for a given source brightness. We note that systematics of photometry is taken into consideration because the adopted magnitude-error relation is estimated based not on theoretical assumptions of systematics but on actual data resulting from systematics. Figure 1 shows the magnitude-uncertainty relation. At faint magnitudes, photometry is limited by photon count, resulting in rapid decrease of error as a star becomes brighter. At very bright magnitudes, on the other hand, photometry is mostly dominated by non-photon noise, e.g. read-out noise, dark current, etc, and thus photometry does not improve for . In the region , it is found that the uncertainty decreases very rapidly as the source becomes brighter. For example, sub-milli magnitude level photometry is possible for a giant star, while the uncertainty for a MS star is mag. We assume that photometry follows Gaussian distribution.

Photometric precision in lensing observation depends not only on the source brightness but also on the blended light from unlensed neighboring stars. Considering that faint stars are more affected by blending, we adopt blend to source flux ratios of , , and for the individual source populations. With these ratios, the source brightness of a lensing event varies as
| (1) |
where is the blended baseline source brightness, is the apparent brightening of the source, and is the apparent lensing magnification (Han, 1999).
To produce light curves affected by finite-source effects, we use the ray-shooting method (Kayser et al., 1986; Schneider & Weiss, 1987). In this method, one shoots uniform rays from the observer to the lens plane, calculates the angle of deflection due to the individual lens components, and collects rays in the source plane. The deflection angle is computed by the lens equation
| (2) |
where is the mass fraction of each lens component, , , and represent the complex notations of the source, lens, and image positions, respectively, and denotes the complex conjugate of (Witt, 1990). Then, finite-source magnifications are computed as the ratio of the number density of rays on the surface of the source star to the density on the observer plane. In computing finite-source magnifications, we additionally consider the variation of the source surface brightness caused by limb-darkening effects. For this, we model the surface brightness profile as
| (3) |
where is the linear limb-darkening coefficient and is the angle between the line of sight toward the source star and the normal to the source surface (Albrow et al., 2001). The adopted values of the limb-darkening coefficients are listed in Table 1.
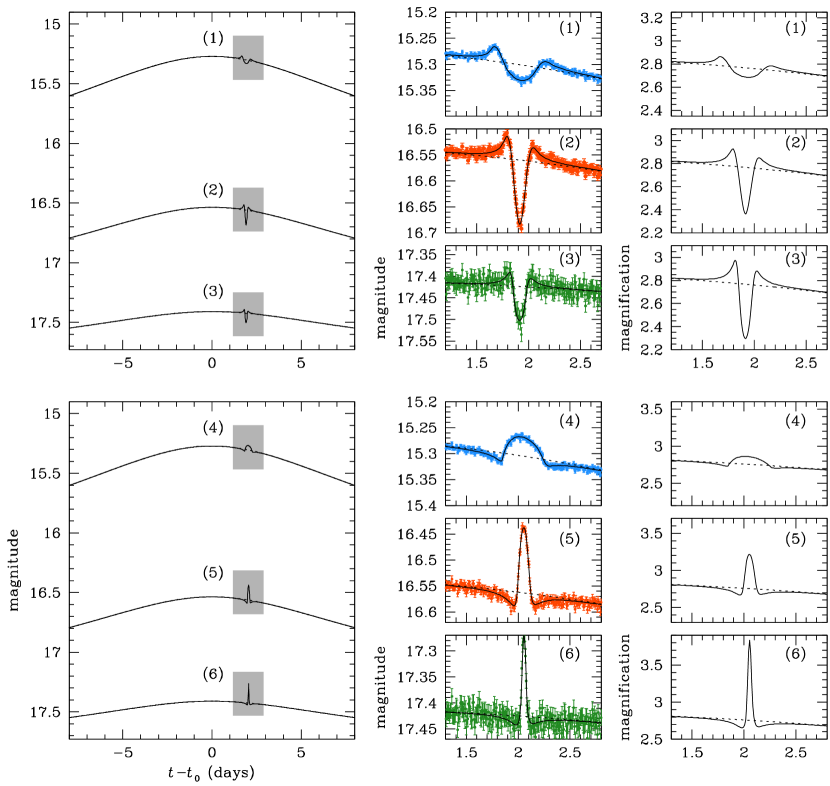
In Figure 2, we present example lensing light curves produced by simulation. The upper and lower sets of panels show the two typical cases of planetary perturbations produced by close (upper panels) and wide (lower panels) planets, respectively. Here the terms “close” and “wide” denote the cases where the projected planet-star separation is smaller and bigger than the Einstein radius, respectively. For each set of panels, we present three light curves associated with giant (top), subgiant (middle), and MS (bottom) source stars. We note that the lensing magnifications of the individual light curves are identical but the light curves appear different due to the differences in the source brightness and the blend to source flux ratio. The three small middle panels show the enlarged view of the perturbation regions (shaded region in the left panel) presented in “magnitude”. Also presented in the right panels are the light curves of the perturbations in terms of the lensing “magnification”.
3. Detection Probability
With light curves produced from simulation, we then estimate the planet detection probability. The probability is estimated as the fraction of events with noticeable planetary signals among all tested events under the assumption that source trajectories with respect to the star-planet axis are randomly oriented.
Estimating the detection probability requires to produce a large number of finite-source light curves which demand heavy computation. For efficient estimation of the probability, we use the map-making method (Dong et al., 2006). In this method, a pixel map of rays covering a large area on the source plane is stored in the buffer memory of a computer and light curves are produced from rays in the pixels of the map located along the source trajectory. This method is useful in producing many light curves resulting from different source trajectories without additionally shooting rays for each light curve.
In our estimation of the probability, we consider events with impact parameters (normalized by ) of the lens-source approach , i.e. events produced by the source approach within the Einstein ring of the primary lens. Microlensing planets can be detected for events with where the planetary signal stands on the weak or even no base lensing magnification of the primary (Han et al., 2005; Sumi et al., 2011; Bennett et al., 2012), but we do not consider these cases in this work.
We estimate the probability by setting a threshold value as a criterion for the detectability of planetary signals. Gould et al. (2010) extensively discussed about the choice of and pointed out that should be high enough in order to avoid false-positive signals arising from systematics in data. We therefore adopt a conservative value of . We note that the trends of the probability dependence on the source type and the planetary separation for different values of are consistent regardless of the choice of threshold values within .
It is known that intrinsic source variability, especially for giant stars, can induce short-term variation in lensing light curves (Gould et al., 2013). However, resulting deviations, in general, have different forms from those induced by planets and thus they can be easily distinguished from follow up photometric and spectroscopic observation. We, therefore, do not consider contamination of planetary lensing signals by source variability.
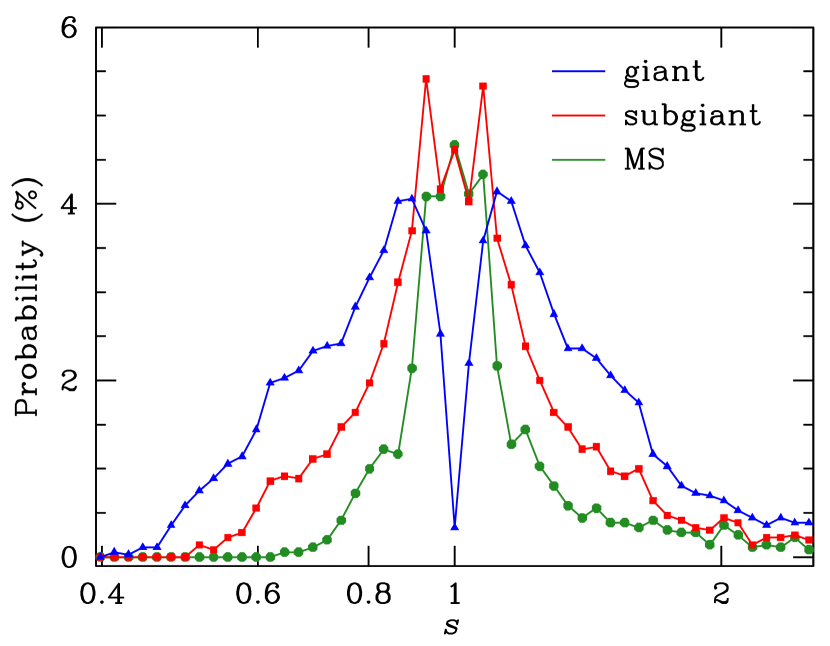
In Figure 3, we present the estimated detection probability as a function of the projected planet separation normalized by the Einstein radius, , for three different populations of source stars. From the distributions, it is found that the probability is substantially higher for giant-source events than those of events involved with source stars of smaller radii throughout the planetary separations except for a narrow region around .111 The dip in the probability distribution for planets with is due to the weak magnification excess of the caustic region relative to a single lens (Gaudi, 2011). As a result, planetary signals are more vulnerable to finite-source effects, causing lower detection probability for giant-source events than events with smaller source radii. The result is contrary to that of Bennett & Rhie (1996) where they found a smaller probability for a larger source size.
The cause of the opposite results between our and Bennett & Rhie’s analyses is found from the comparison of the planetary perturbations presented in the brightness (magnitude) and magnification, which are shown in the middle and right panels of Figure 2. As pointed out by Bennett & Rhie (1996), magnification excess of a planetary deviation decreases with the increase of the source size due to finite-source effects. However, a source star becomes brighter as its size increases and the contribution of the improved photometric precision to the planetary signal is big enough to compensate the decrease of the magnification excess and to result in stronger planetary signals. For example, we find that the planetary signal of the giant-source event marked by (1) is much stronger than the signal of the MS-source event marked by (3) despite that the former event suffers from much more severe finite-source effects.
4. Summary and Discussion
In order to check the previous result indicating the difficulty in detecting Earth-mass planets from ground-based observation, we reevaluated the detection feasibility by additional considering the dependence of photometric precision on source populations. From the analysis based on realistic simulation of lensing events, we found that giant-source events were suitable targets for Earth-mass planet detections with substantially higher detection probability than events involved with source stars of smaller radii. We found the reason for the opposite result to the previous one is that the contribution of the improved photometric precision to the planetary signal of a giant-source event is big enough to compensate the decrease of the magnification excess caused by finite-source effects.
Although no Earth-mass planet has been detected yet, the competing effects of extended source and source brightness are well illustrated by microlensing planets detected through the channel of high-magnification events. A good example is the planetary event MOA-2007-BLG-400 (Dong et al., 2009). Although the mass of the planet discovered in the event is much heavier than the Earth, the event is similar to a giant-source Earth-mass planetary event in the sense that the caustic was substantially smaller than the source and the planetary deviation occurred when the source was bright. Despite that the planetary deviation was greatly attenuated by severe finite-source effects, the signal was detected with the large significance of and the planetary deviation was unambiguously ascertained. Considering that the detection was possible mostly thanks to the high photometric precision of the bright source, giant-source events would be suitable targets for the detection of low-mass planets. Therefore, we predict that Earth-mass planets would be detected from future ground-based high-cadence lensing surveys.
References
- Albrow et al. (2001) Albrow, M. D., An, J., Beaulieu, J.-P., et al. 2001, ApJ, 549, 759
- Bennett & Rhie (1996) Bennett, D. P., & Rhie, S. H. 1996, ApJ, 472, 660
- Bennett & Rhie (2002) Bennett, D. P., & Rhie, S. H. 2002, ApJ, 574, 985
- Bennett et al. (2012) Bennett, D. P., Sumi, T., Bond, I. A., et al. 2012, ApJ, 757, 119
- Bond et al. (2001) Bond, I. A., Abe, F., Dodd, R. J., et al. 2001, MNRAS, 327, 868
- Dong et al. (2006) Dong, S., Depoy, D. L., Gaudi, B. S., et al. 2006, ApJ, 642, 842
- Dong et al. (2009) Dong, S., Bond, I. A., Gould, A., et al. 2009, ApJ, 698, 1826
- Gaudi (2011) Gaudi, B. S. 2011, Exoplanets, ed. S. Seager (Tucson, AZ: Univ. Arizona Press), 79
- Gaudi (2012) Gaudi, B. S. 2012, ARA&A, 50, 411
- Gould & Loeb (1992) Gould. A., & Loeb, A. 1992, ApJ, 396, 104
- Gould et al. (2010) Gould. A., Subo, D., Gaudi, B. S., et al. 2010, ApJ, 720, 1073
- Gould et al. (2013) Gould, A., Yee, J. C., Bond, I. A., et al. 2013, ApJ, 763, 141
- Han (1999) Han, C. 1999 MNRAS, 309, 373
- Han & Gould (1995) Han, C., & Gould, A. 1995, ApJ, 447, 53
- Han et al. (2005) Han, C., Gaudi, B. S., An. J. H., & Gould, A. 2005, ApJ, 618, 962
- Kayser et al. (1986) Kayser, R., Refsdal S., & Stabell, R. 1986, A&A, 166, 36
- Kim et al. (2010) Kim, S.-L., Park, B.-G., Lee, C.-U., et al. 2010, Proc. SPIE, 7733, 77333F
- Mao & Paczyński (1991) Mao, S., & Paczyński, B. 1991, ApJ, 374, L37
- Nataf et al. (2013) Nataf, D. M., Gould, A., Fouque, P., et al. 2013, ApJ, 769, 88
- Rhie et al. (2000) Rhie, S. H., Bennett, D. P., Becker, A. C., et al. 2000, ApJ, 533, 378
- Schneider & Weiss (1987) Schneider, P., & Weiss, A. 1987, A&A, 171, 49
- Shvartzvald & Maoz (2012) Shvartzvald, Y. & Maoz, D. 2012, MNRAS, 419, 3631
- Sumi et al. (2003) Sumi, T., Abe, F., Bond, I. A., et al. 2003, ApJ, 591, 204
- Sumi et al. (2011) Sumi, T., Kamiya, K., Bennett, D. P., et al. 2011, Nature, 473, 349
- Udalski (2003) Udalski, A. 2003, Acta Astron., 53, 291
- Witt (1990) Witt, H. J. 1990, A&A, 236, 311