Near-IR studies of recurrent nova V745 Scorpii during its 2014 outburst
Abstract
The recurrent nova (RN) V745 Scorpii underwent its third known outburst on 2014 February 6. Infrared monitoring of the eruption on an almost daily basis, starting from 1.3d after discovery, shows the emergence of a powerful blast wave generated by the high velocity nova ejecta exceeding 4000 kms-1 plowing into its surrounding environment. The temperature of the shocked gas is raised to a high value exceeding 108K immediately after outburst commencement. The energetics of the outburst clearly surpass those of similar symbiotic systems like RS Oph and V407 Cyg which have giant secondaries. The shock does not show a free-expansion stage but rather shows a decelerative Sedov-Taylor phase from the beginning. Such strong shockfronts are known to be sites for ray generation. V745 Sco is the latest nova, apart from five other known novae, to show ray emission. It may be an important testbed to resolve the crucial question whether all novae are generically ray emitters by virtue of having a circumbinary reservoir of material that is shocked by the ejecta rather than ray generation being restricted to only symbiotic systems with a shocked red giant (RG) wind. The lack of a free-expansion stage favors V745 Sco to have a density enhancement around the white dwarf (WD), above that contributed by a RG wind. Our analysis also suggests that the WD in V745 Sco is very massive and a potential progenitor for a future SN Ia explosion.
1 Introduction
The symbiotic recurrent nova V745 Scorpii experienced its third known outburst recently on 2014 February 6.694 UT (Stubbings 2006) with two earlier eruptions being recorded in 1937 and 1989. It is a relatively less well studied nova amongst the 10 currently known RNe (viz., T Pyx, IM Nor, CI Aql, V2487 Oph, U Sco, V394 CrA, T CrB, RS Oph and V3890 Sgr) and belongs to the sub-class of RNe which have giant secondaries (viz., RS Oph, T CrB and V3890 Sgr). The secondary has been classified to be a giant of spectral type M6 III 2 sub classes (Harrison et al. 1993; Anupama Mikolajewska 1999; Duerbeck et al. 1989; Sekiguchi et al. 1990; Williams et al. 1991) with an orbital period of 510 20 days (Schaefer 2009). V745 Sco is a very fast nova with and of 6.2 and 9 days respectively which is estimated to lie at a distance of 7.8 1.8 kpc in the middle of the galactic bulge (Schaefer 2010). Optical studies of the 1989 eruption are documented in Sekuguchi et al. (1990) and Duerbeck et al. (1989). The latter work shows the early spectroscopic evolution through a montage of 8 spectra covering the period between 10 to 40d after outburst. Other spectroscopic studies include those by Williams (2003) and Wagner (1989). In the infrared, Sekiguchi et al. (1990) recorded the lightcurves in the bands while a near-IR spectrum at 70d after outburst was recorded by Harrison, Johnson Spyromilio (1993). The observational coverage of this RN is sparse and there are notably no early time IR spectra which record its evolution in the infrared. This work, and another in preparation, should contribute to filling this gap.
We have been obtaining multi-epoch, photometric and spectroscopic NIR observations in the 0.85 to 2.4 m region starting from 1.3d after discovery. During the course of analysis it was noticed that the emission lines were rapidly narrowing with time. This phenomenon is rarely seen and is indicative of decelarating matter associated with a shock which in turn can be associated with ray generation (see below). The other similar instances where such a phenomenon was witnessed earlier was in RS Oph (Das et al. 2006) and V407 Cyg (Munari et al. 2010). Since the development of a strong shock in V745 Sco is a rare and significant phenomenon, we use part of our data covering only the I and J bands to analyse and study the implications of the event. In a follow-up paper, we will present a more detailed analysis using our complete spectroscopy and photometry as in RS Oph (Banerjee et al. 2010).
The present 2014 outburst is being observed at all wavelengths from radio to the ray regime (Rupen et al. 2014, Banerjee et al. 2014, Anupama et al. 2014, Page et al. 2014, Mukai et al. 2014, Luna et al. 2014, Rana et al. 2014, Cheung et al. 2014). Among the notable early results is the reported detection of rays from the object (Cheung et al. 2014). This has important ramifications for the present study. ray detections from nova are recent and few in number and V745 Sco is only the sixth nova to be detected in rays after V407 Cyg, Nova Sco 2012, Nova Mon 2012, Nova Del 2013 and Nova Cen 2013. All detections have been made by the Fermi LAT starting with the first detection in V407 Cyg in 2010 (Abdo et al. 2010). As per present understanding, rays from novae are generated by a diffusive acceleration mechanism as particles rebound back and forth across a shockfront created by the nova’s ejecta plowing into a pre-existing dense surrounding medium. Generically it is the same principle that leads to creation of high energy cosmic rays. A shock is thus an essential prerequisite for ray generation and it is hence very necessary to establish its presence unambiguously. V407 Cyg was the first -ray nova where the decelerating shock front was clearly detected (Munari et al. 2010). Unfortunately during the 2006 RS Oph outburst no -ray observing facility, with comparable sensitivity as the Fermi telescope, was available. The generation mechanism of the ray emission in novae is also under debate. For the shock to develop it is necessary to have a dense ambient medium into which the nova ejecta propagates and decelerates. In the case of V407 Cyg and RS oph the pre-existing dense ambient medium is provided by the high mass-loss from the secondary late-type giant star (the companion in V407 Cyg is a Mira variable). In contrast, for instance in the case of Nova Mon 2012 - another ray nova - it is fairly certain that the companion is not a late-type giant (Munari et al. 2013) and hence cannot provide the dense ambient medium through copious mass loss. Thus there is uncertainty as to how rays are indeed generated in novae systems. In this context, recent calculations show that a late-type giant’s wind, solely by itself, may not be enough to create the requisite density enhancements necessary to explain the observed behavior of the ray light curve. Additional sources of density enhancement in the form of a reservoir of circum-binary material around the WD is perhaps needed (Martin Dubus 2013). This is a new point of departure from earlier thinking and interestingly enough, similar arguments for pre-existing circum-binary material were already proposed by Williams (2013) from totally different considerations. In such a context, the eruption of V745 Sco is thus an important testbed for understanding unexplained aspects of ray generation in novae.
2 Observations1
11footnotetext: This paper includes data gathered with the 6.5 meter Magellan Telescopes located at Las Campanas Observatory, Chile.Near-IR spectroscopy in the 0.85 to 2.4 m region at R 1000 was carried out with the 1.2m telescope of the Mount Abu Infrared Observatory (Banerjee & Ashok 2012) using the Near-Infrared Camera/Spectrograph (NICS) equipped with a 1024x1024 HgCdTe Hawaii array. Spectra were recorded with the star dithered to two positions along the slit with one or more spectra being recorded in both of these positions. The coadded spectra in the respective dithered positions were subtracted from each other to remove sky and dark contributions. The spectra from these sky-subtracted images were extracted using IRAF tasks and wavelength calibrated using a combination of OH sky lines and telluric lines that register with the stellar spectra. To remove telluric lines from the target’s spectra, it was ratioed with the spectra of a standard star from whose spectra the Hydrogen Paschen and Brackett absorption lines had been removed. The spectra were finally multiplied by a blackbody at the effective temperature of the standard stars SAO 186061 & SAO 209303. The log of the observations is given in Table 1.

| UT | Days after | Airmass | Telluric | Airmass |
| outburst | V745 Sco | Standard | Standard | |
| 2014 Feb 08.0 | 1.3 | 2.58 | SAO186061 | 2.05 |
| 2014 Feb 09.0 | 2.3 | 3.29 | SAO186061 | 2.51 |
| 2014 Feb 10.0 | 3.3 | 2.97 | SAO186061 | 2.03 |
| 2014 Feb 11.0 | 4.3 | 3.12 | SAO186061 | 2.16 |
| 2014 Feb 12.0 | 5.3 | 2.91 | SAO186061 | 2.08 |
| 2014 Feb 13.0 | 6.3 | 2.73 | SAO186061 | 2.01 |
| 2014 Feb 15.46a | 8.7 | 1.33 | HD163084 | 1.33 |
| 2014 Feb 16.0 | 9.3 | 3.06 | SAO209303 | 3.13 |
| 2014 Feb 17.0 | 10.3 | 3.06 | SAO209303 | 3.13 |
| 2014 Feb 18.0 | 11.3 | 2.54 | SAO209303 | 2.53 |
| 2014 Feb 19.0 | 12.3 | 3.05 | SAO209303 | 3.12 |
| 2014 Feb 20.0 | 13.3 | 2.50 | SAO209303 | 2.54 |
| 2014 Feb 22.0 | 15.3 | 2.33 | SAO209303 | 2.14 |
| aafootnotetext: Observation from Magellan South. Remaining observations are from Mt. Abu. The outburst date is taken to be the discovery date viz. 2014 Feb 6.7 |
NIR spectra (, m) were obtained using the FoldedPort Infrared Echellette (FIRE) spectrograph on the 6.5m Magellan Baade Telescope (Simco et al. 2008). FIRE data are reduced using a custom IDL package (Simco et al. 2008) and additional procedures described by Hsiao et al. 2013.
3 Results and Discussion
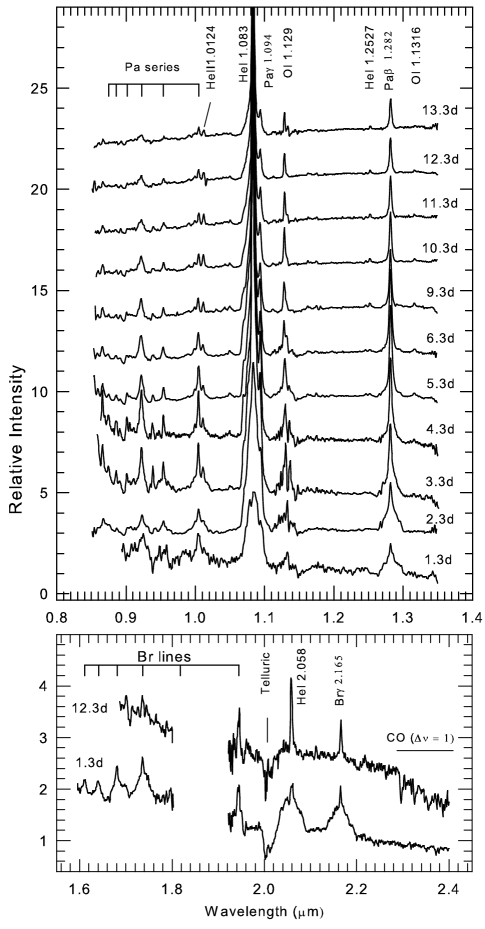
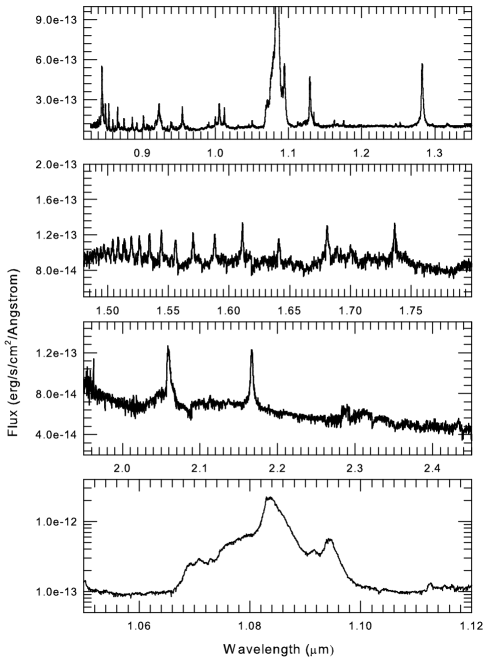
We present in Figure 1 the complete set of spectra in the band between 0.85 to 1.35 ms obtained from Mount Abu. The major lines are marked and it may be seen that most of the lines are of H and He with HeI 1.0830 m overwhelming all other lines in strength. The NIR spectra are typical of the He/N class of novae (Banerjee & Ashok 2012) and are fairly similar to those observed in RS Oph except that the strength of Lyman beta fluoresced OI 1.1287 m line develops relatively much slower in V745 Sco. Unlike Duerbeck et al. (1989), who detected coronal lines 10d after outburst, we do not see any coronal lines during the span of our observations. The highest excitation lines seen here are due to HeII. The spectrum obtained from FIRE is showed in Figure 2. All the emission lines of Figure 1 are clearly seen here too but at higher resolution. The sequence of Brackett lines in the H band between Br 10 at 1.7362 m to Br 25 at 1.4967 m is rather striking. A magnified view shows that mild first overtone CO emission at 2.29 m and beyond, arising from the secondary, had already begun to appear in the FIRE spectrum. The CO features became more pronounced with time as emission from the secondary becomes dominant. This is demonstrated in the bottom panel of Figure 1 which shows two band spectra; one on 1.3d and the other 12.3d after outburst– in the latter the CO bands are clearly seen.
Figure 3 well illustrates the evolution of the profile of the Pa 1.2818 m line which was chosen since it is both a strong line and also unblended with other lines. Profile width measurements are therefore reliable. The observed profiles are composed of a broad component which is attributed to the nova ejecta on which is superposed a sharp and narrow component. The profiles are very similar to those seen in V407 Cyg in which the sharp component was attributed to the sudden ionization of a large fraction of the secondary’s wind by the flash of energetic radiation produced by the thermonuclear event (Munari et al. 2010). A similar origin is proposed here too. What is striking is the rapid narrowing of the profiles with time. We decomposed each profile into two gaussians representing the broad and narrow components respectively and measured the evolution of their FWHM (full width at half-maximum) values. A representative two gaussian fit to one of the profiles is shown in Figure 3 with the variation of the FWHM’s with time is shown in the bottom panel. The right panel shows a similar evolution for the 2010 outburst of V407 Cyg from unpublished material not included in Munari et al (2010). The shape and evolution of the profiles of both objects share a good similarity. For V745 Sco, the narrow component from the Mira wind does not show much variation. During the early stages it is kinematically perturbed to some extent but its FWHM gradually tends to evolve towards its value observed at quiescence. We consider the FWHM of the H lines in quiescence to be adequately represented by the FWHM of the H line whose intrinsic width (corrected for instrumental broadening) is 450 15 kms-1 (Munari, private communication) as presented in the high-resolution atlas of symbiotic stars by Munari & Zwitter (2002). We discuss the evolution of the broad component in V745 Sco below.
The behavior of the shockwave as it propagates into the dense ambient medium surrounding the WD is usually divided into the following stages (e.g. Bode & Kahn 1985). First is a free expansion or ejecta-dominated stage, where the ejecta expands freely and the shock moves at a constant speed without being impeded by the surrounding medium. This phase generally extends to the time it takes for the swept-up mass to equal the ejecta mass. The second phase is a Sedov-Taylor stage, where the majority of the ejecta kinetic energy has been transferred to the swept-up ambient gas. This is an adiabatic phase since the shocked material is so hot that there is negligible cooling by radiation losses. During this phase a deceleration is seen in the shock whose velocity v versus time t is expected to behave as v , assuming a dependence for the decrease in density of the wind. In phase 3, the shocked material has cooled by radiation, and here the expected dependence of the shock velocity is v . One may mention that the strong X-ray blast wave, seen during the 2006 outburst of RS Oph, largely conformed to the above behavior (Sokolski et al. 2006; Bode et al. 2006).
The free expansion stage was not seen in V745 Sco whose implications need to be understood. The intrinsic colors of the late M type giant in V745 Sco are estimated to be 0 0.95 and 0 0.41 using 2MASS magnitudes of = 10.04, 8.85 8.3 respectively as quiescent values and correcting them using an adopted reddening value of = 0.70 (Schlafly & Finkbeiner 2011). A value of 0.6, for the estimated distance of 7.8 kpc to V745 Sco, is also supported from modelling of the galactic interstellar extinction by Marshall et al. (2006). On an IR color-color diagram (see Figs 6 & 4 of Whitelock & Munari, 1992) this places it among galactic bulge giants, a conclusion that was also reached by Sekiguchi et al. (1990). A comparison by Whitelock & Munari (1992) of the IR characteristics of neighborhood M giants, bulge M giants and the M giants of S type symbiotic systems shows that the M giant secondaries in symbiotic systems are very similar to those in the bulge and are thus low mass ( 1 M⊙) objects. We adopt this as an upper limit for the mass of the secondary in V745 Sco. It is also likely that a significant fraction of all the symbiotic M stars are actually asymptotic giant branch (AGB) stars rather than giant branch stars (Kniazev et al. 2009). This suggestion that symbiotics have AGB stars as mass donors would support the view that additional mass could be transferred through the stellar winds, above that transferred via Roche lobe overflow, since the winds from AGB stars are stronger than from normal giants. We thus adopt a mass loss rate of around 10-7 M⊙yr-1. This is a reasonable value for an AGB star and also in line with that chosen for V407 Cyg (Martin Dubus; 2013).
Assuming a high-mass for the WD (in the range 1.2 to 1.4 M⊙), Msec 1M⊙ and orbital period of 520d, the separation between the binary components in V745 Sco is tightly constrained in the range 1.4 to 1.5 AU. In the elapsed time of 1.3d between onset of outburst and our first observation, the blast wave traveling at at over 4000 kms-1 will sweep up material within a radius of 3 AU from the WD. The mass of this material is estimated to be Mswept = 0.710-7M⊙ assuming (d/dt)secondary = 10-7 M⊙yr-1, a geometric 1/r2 dilution in the density profile of the RG wind and a velocity of the RG wind of 10 km/s. Increasing the wind velocity will reduce Mswept while increasing (dM/dt)secondary will linearly increase it. But for a reasonable physical choice of parameters Mswept appears constrained between 10-7 to 10-6 M⊙. Mswept is estimated assuming the material between WD and secondary has no additional enhancements beyond that due to spherically symmetric wind from the secondary (see Figure 1 of Martin Dubus, 2013). The free expansion stage, if it ever occurred, had commenced and completed before our first observation made 1.3d after discovery. The small value of matter swept out during these 1.3d indicates one of two possibilities. First, the mass of the ejected matter Mej in the outburst is small and of the order of Mswept. The small value of Mej in turn would imply that the central WD is massive since the critical mass of the accreted envelope required to trigger a thermonuclear runaway is inversely proportional to the mass of the WD
( where =1020 dyne cm-2 for = 1.4 ; Truran Livio 1986). The second conclusion that can be drawn from a free expansion stage that is either very short-lived (¡ 1.3 d) or absent is that the ejecta was very quickly impeded by additional material apart from the giant’s wind. That is, the Martin & Dubus (2013) hypothesis positing additional material enhancement, as applicable to V407 Cyg, is valid here too. Preliminary results from the ray detection by Fermi-LAT data indicates the detections with largest observed significances were on 2014 February 6 and 7 with no significant emission (within stipulated detection limits given) was detected in the subsequent days through the end of 2014 February 10. The fact that the rays peaked early, coincident with the optical outburst, strongly points at a dense circumbinary reservoir around the WD. The greatest difficulty that Martin & Dubus (2013) faced while reproducing the ray lightcurve of of V407 Cyg was in simulating the early peaking of the ray emission using just a RG wind. To overcome this they were forced to invoke the presence of dense additional matter close to the WD. It may be noted that the above argument does not rule out the possibility of a small ejecta mass (or equivalently a massive WD). Independent support for a high mass WD is found in the extremely early turn-on of the super-soft X-ray phase at 3d after discovery (Page et al. 2014). This, coupled with the very high ejecta velocities observed, imply the presence of very low mass ejecta and thereby a massive WD (Figure 6 of Schwarz et al., 2011). V745 Sco thus could be a potential progenitor candidate for a SN Ia explosion by virtue of having a high mass WD whose mass additionally, as in other similar symbiotic systems like RS Oph, T CrB and V3890 Sgr, is suggested to be increasing after each outburst (Hachisu Kato 2001; Hachisu, Kato Luna 2007).
The adiabatic (decelerative) phase in Figure 2 deviates significantly from the dependency indicating that the shock is propagating into a wind which is not spherically symmetric. The reasons for this are two fold. The nova shell is expected to be slowed down more effectively in the parts moving in the direction of the RG due to the increasing density in that direction. In addition, as discussed above, there is additional material, most likely distributed over the equatorial plane. The combined effect of these is to make matter distribution around the WD’s position anisotropic and the shockfront should thus rapidly becomes aspherical. Good support for this is offered by the detailed radio monitoring and modeling of the V407 Cyg outburst by Chomiuk et al. (2012; refer their Figure 6). V745 Sco was observed 10d after the optical discovery on February 16 with NuSTAR showing a luminous hard X-ray source whose spectrum could be modeled by a plasma in collisional ionization equilibrium at kT = 2.6 keV or equivalently 3.02107K (Rana et al. 2014). This is consistent with what we observe. For a strong shock, the post-shock temperature is given by where k is the Boltzmann constant and g is the mean particle mass including electrons (Bode et al. 2006). On day 10.3 we measure = 1930 kms-1 equivalent to a temperature of 5.05107K which agrees satisfactorily with the X ray result. Extending the calculations, the gas must have been heated to extremely high temperatures exceeding 1108K at 1.3d when the FWHM was 4825 kms-1. In comparison, in RS Oph whose evolution was very well documented, a Pa FWHM of 3066 kms-1 on 1.16d was measured (Das et al. 2006) and for the same line in V407 Cyg we obtained a value 1862 kms-1 on 2010 March 13 (3.2d after outburst; Munari et al. 2010 measured a FWHM of 2760 kms-1 on day +2.3 from the H profile). Clearly the outburst of V745 Sco is extremely powerful, an aspect that needs to be emphasized and which was not established from its earlier outbursts. Its energetics overshadow even those of RS Oph and V407 Cyg.
Research at PRL is supported by the Department of Space, Government of India. GHM thanks D. Osip, P. Palunas, Y. Beletsky and the engineering group at the Las Campanas Observatory for their support of observations. The CfA Supernova Program is supported by NSF grant AST-1211196 to the Harvard College Observatory. We thank the reviewer Prof Ulisse Munari for helpful comments.
References
- (1) Abdo, A. A., Ackermann, M., Ajello, M., et al. 2010, Science, 329, 817
- (2) Anupama, G. C., Mikolajewska, J. 1999, AA, 344, 177
- (3) Anupama, G. C., Selvakumar, G., Moorthy, V., Velu, C., Dinakaran, N. 2014, Astronomer’s Telegram , 5871, 1
- (4) Banerjee, D. P. K., Das, R. K., Ashok, N. M. 2009, MNRAS, 399, 357
- (5) Banerjee, D. P. K., Ashok, N. M. 2012, BASI, 40, 243
- (6) Banerjee, D. P. K., Venkataraman, V., Joshi, V., Ashok, N. M. 2014, Astronomer’s Telegram, 5865, 1
- (7) Bode, M. F., O’Brien, T. J., Osborne, J. P., et al 2006, ApJ, 652, 629
- (8) Bode, M. F., Kahn, F., 1985, MNRAS, 217, 205
- (9) Cheung, C. C., Jean, P., Shore, S. N. 2014, Astronomer’s Telegram, 5879, 1
- (10) Das, R. K., Banerjee, D. P. K., Ashok, N. M. 2006, ApJ, 653, L141
- (11) Chomiuk, L., Krauss, M.I., Rupen, M. P., et al. 2012, Apj, 761, 173
- (12) Duerbeck, H.W. 1989, ESO Messenger, 58, 34
- (13) Hachisu, I. Kato, M. 2001, ApJ, 558, 323
- (14) Hachisu, I., Kato, M. Luna, G. J. M. 2007, ApJ, 659, L153
- (15) Harrison, T. E., Johnson, J. J., Spyromlio, J. 1993, AJ, 105, 320
- (16) Hsiao, E. Y., Marion, G. H., Phillips, M. M., et al. 2013, ApJ, 766, 72
- (17) Kniazev, A.Y., Vaisanen, P., Whitelock, P.A. et al. 2009, MNRAS, 395, 1121
- (18) Luna, G. J. M., Pillitteri, I., Mukai, K. Sokoloski, J. L. 2014, Astronomer’s Telegram, 5881, 1
- (19) Marshall, D. J., Robin, A. C., Reyle C. et al. 2006, AA, 453, 635
- (20) Martin, P. Dubus, G. 2013, AA, 551,37
- (21) Munari, U. Zwitter, T. 2002, AA, 383, 188
- (22) Munari, U., Joshi, V., Ashok, N. M., et al 2011, MNRAS, L52
- (23) Munari, U., Dallaporta, S., Castellani, F., Valisa, P. et al. 2012, MNRAS, 435, 771
- (24) Rana, V., Orio, M., Sokoloski, J., Harrison, F. 2014, Astronomer’s Telegram, 5913, 1
- (25) Mukai, K., Page, K. L., Osborne, J. P., Nelson, T. 2014, Astronomer’s Telegram, 5811, 1
- (26) Page, K. L., Osborne, J. P., Beardmore, A. P. T. Mukai, K. 2014, Astronomer’s Telegram, 5870, 1
- (27) Rupen, M. P., Mioduszewski, A.J., Chomiuk, L., Sokoloski, J., Nelson, T. Mukai, K. 2014, Astronomer’s Telegram, 5874, 1
- (28) Schaefer, B. E. 2009, ApJ, 697, 721
- (29) Schaefer, B. E. 2010, ApJS, 187, 275
- (30) Schlafly, E., Finkbeiner, D.P. 2011, ApJ, 737, 103
- (31) Schwarz et al. 2011, ApJS, 197, 31
- (32) Sekiguchi, K., Whitelock, P. A., Feast, M. W., et al. 1990, MNRAS, 246, 78
- (33) Simcoe, R. A., Burgasser, A. J., Bernstein, R. A., et al. 2008, SPIE Conference Series, Vol. 7014
- (34) Sokoloski, L. J., Luna, G. J. M., Mukai, K., et al. 2006, Nature, 442, 276
- (35) Stubbings, R. 2014, CBET, 3803,1
- (36) Truran, J. W., Livio, M. 1986, ApJ, 308, 721
- (37) Wagner, R. M., Bertram, R., Starrfield, S., Shore, S. 1989, IAU Circular, 4822, 1
- (38) Whitelock, P.A., Munari, U. 1992, AA, 255, 171
- (39) Williams, R. E., Hamuy, M., Phillips, M. M., et al. 1991, ApJ, 376, 721
- (40) Williams, R. E., Hamuy, M., Phillips, M. M., Heathcote, S. R., et al 2003, JAD, 9, 3
- (41) Williams, R. E. 2013, AJ, 146, 55