The spectroscopic signature of Kondo screening on single adatoms in Na(Fe0.96Co0.03Mn0.01)As
Abstract
The electronic states of surface adatoms in Na(Fe0.96Co0.03Mn0.01)As have been studied by low temperature scanning tunneling spectroscopy. The spectra recorded on the adatoms display both superconducting coherence peaks and an asymmetric resonance in a larger energy scale. The Fano-type line shape of the spectra points towards a possible Kondo effect at play. The apparent energy position of the resonance peak shifts about meV to the Fermi level when measured across the critical temperature, supporting that the Bogoliubov quasiparticle is responsible for the Kondo screening in the superconducting state. The tunneling spectra do not show the subgap bound states, which is explained as the weak pair breaking effect given by the weak and broad scattering potential after the Kondo screening.
pacs:
74.55.+v, 68.37.Ef, 72.10.Fk, 74.70.XaAccording to the Bardeen-Cooper-Schrieffer theory, metals become superconducting when Cooper pairs are formed via electron-phonon interaction and condense below the critical temperature (). The Cooper pairs with the -wave symmetry can survive in the presence of non-magnetic impurities, while magnetic impurities are expected to suppress superconductivity and induce bound states within the superconducting gapAnderson ; BalatskyRevModPhys . The energy of the in-gap state is dominated by the interaction strength between the magnetic impurities and the Cooper pairsFlattePRL . On the other hand, in normal metals containing magnetic impurities, the magnetic coupling between the local impurity spin and the itinerant electrons can lead to another singlet formation, namely to form a Kondo screening cloud, at temperature below the characteristic Kondo temperature () of the systemKondo ; Hewson . The competition between the Kondo screening and the opening of superconducting gap can be described by the ratio of to SatoriJPSJ , where is the Boltzmann constant and the order parameter governs the superconducting pairing strength.
Low temperature scanning tunneling microscopy (STM) and spectroscopy (STS) provide a direct method to study the local density of states (LDOS) near the impurities. The in-gap states induced by magnetic impurities (Mn, Gd) adsorbed on the surface of Nb single crystal have been provedYazdaniScience , in consistent with the pioneer calculation of Yu-Shiba-RusinovYu ; Shiba ; Rusinov . In the high temperature superconductors, besides magnetic impurities, non-magnetic Zn substitution in Bi2Sr2CaCu2O8+x and Cu substitution in the optimally doped Na(Fe1-xCox)As also showed clear in-gap resonant states, providing strong evidence of the sign-reversal order parameters in those materialsPanZnImpurity ; HyangNC . Meanwhile, STM experiments have probed various kinds of magnetic atoms absorbed on metallic surfaces, and the Kondo resonance-like structures have also been observed in the differential conductance near the Fermi energyMadhanvanScience ; JamnealaPRB . The asymmetric line shapes resemble that of a Fano resonanceFano . Moreover, in a system with variable localized magnetic coupling strengths, a balance between Kondo screening and superconducting pair-breaking interaction has been revealedFrankeScience . The result showed that the energy of the bound state is located close to the superconducting gap edge for and deeply in the gap for . In iron pnictides, the superconductivity is widely believed to have a magnetic originChubukov . Therefore it deserves further investigation to identify the interplay of superconducting pairing and the Kondo screening when a magnetic impurity is presented in those compounds.
High quality Na(Fe0.96Co0.03Mn0.01)As single crystals (K) were synthesized by the flux methodQDengsample . All STM and STS tunneling measurements were carried out with an ultrahigh-vacuum low-temperature scanning probe microscope USM-1300 (Unisoku). The samples were cleaved in an ultra-high vacuum with a base pressure about Torr, then immediately inserted into the microscopy head, which was kept at a low temperature. In all measurements, Pt/Ir tips were used. The tunneling spectra were acquired using the lock-in technique with ac modulation of mV at Hz.
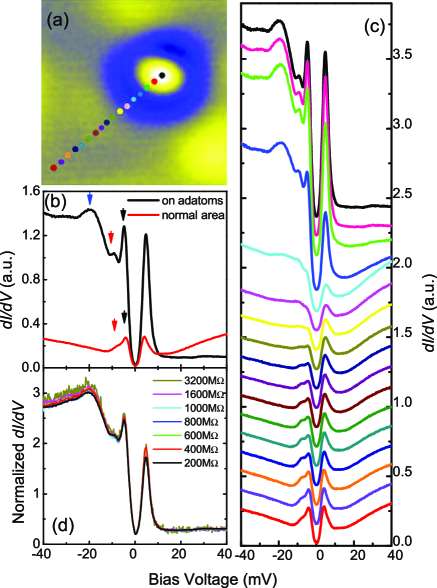
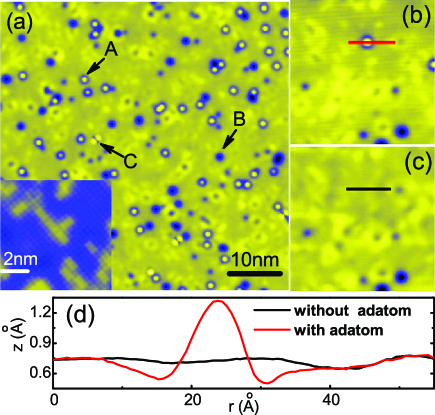
Fig. 1(a) depicts a constant current topographic image with three types of defects on the cleaved surface of Na(Fe0.96Co0.03Mn0.01)As: round protrusions (labeled A), vacancy-like depressions (labeled B) and orthogonal dumbbell-like features (labeled C). The inset shows an atomic-resolution image we achieved far away from those defects, with atomic spacing Å. The weakest bond in this crystal sits between the two adjacent Na layers, therefore the topmost layer after cleaving is the one with Na atoms. Beside the observed square lattice, one can see some rectangular blocks, which have already been identified as the Co dopants on the Fe-layerYangPRB . For the Mn substitutions, it can only be identified with lower bias voltage during the scanning. The type B defects, which may correspond to the missing atoms, were widely distributed on the ever-scanned surface, and no significant spectroscopic differences were detected spatially. For the type C defects, the electronic behavior needs further study due to the very low coverage. The coverage of type A defects varied dramatically in different places. In most area, the type A defects were absent. Intriguingly, this kind of defects can be removed by bringing the STM tip close enough to the surface. For example, Fig. 1(b) and (c) present images of the same area before and after making such action. We therefore argue that type A defects are adatoms sitting on the surface. Fig. 1(d) displays line profiles, in terms of height variation, obtained along the red line marked in Fig. 1(b) and the black line in Fig. 1(c), respectively. The apparent height of the adatom is about Å, measured as the distance between peak and the average surrounding background level. We focus the rest of this paper on the electronic properties near these adatoms.
In Fig. 2(b) the tunneling spectra recorded at 1.7 K on and off a single adatom are reported. The red solid curve shows spectrum measured with the tip held over defect-free surface. The spectrum exhibits two clear peaks at an energy level of about meV (marked with black arrow in the negative bias side), which are associated with the superconducting gap. An additional conductance feature appears at higher energy (marked with red arrow), reminiscent of the bosonic mode observed in the Na(Fe0.975Co0.025)As single crystalWangNP . In the sample we studied here, the mode energy of meV , closely agrees with our previous work. The black solid curve displays spectrum recorded with the tip held over the center of an adatom. The superconducting coherence peaks and the bosonic mode structures are clearly visible, or even get enhanced. Additionally, the spectrum shows a pronounced background peak well outside the superconducting gap (marked with blue arrow), and the LDOS of the unoccupied side is strongly suppressed. These features were observed on hundreds of adatoms at different locations, and the peak position varies with location, ranging from to meV. This kind of adatoms has also been detected on the surface of Na(Fe0.975Co0.025)As with similar electronic behavior. In Fig. 2(c), we display a set of tunneling spectra with tip held at varying distance from the center of an adatom indicated in Fig. 2(a). The resonance-like background feature both decreases in amplitude and changes shape as measured outward. At the position of about Å from the center of the adatom, the feature is mostly gone. We also measured a series of spectra at various tunneling current set-points, i.e., with junction resistances ranging from to M. Fig. 2(d) shows the spectra which have been normalized to the conductance value at meV. No significant change was observed over this resistance range, which can rule out some tip induced effectsTIBB .
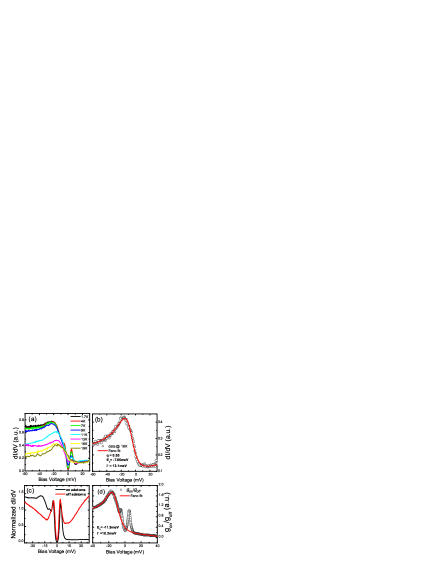
Fig. 3(a) shows the evolution of the STS spectra with temperature up to K, and it is clear that the pronounced asymmetric background lineshape tends to become more symmetric and the resonance peak moves slightly to the Fermi energy as the temperature is increased. Above K, when the sample is in the normal state, the superconducting coherence peaks disappear and the curves show only the asymmetric resonance feature. This type of asymmetric spectra with dip or peak features near the Fermi energy have been observed for the individual magnetic impurity on metal surface and interpreted as the Kondo resonanceMadhanvanScience ; JamnealaPRB ; LiPRL . Below , the spin of impurity can be flipped by an itinerant electron while simultaneously a spin excitation state called the Kondo resonance is created close to the Fermi energy. This spin exchange can modify the energy spectrum of the system. In STS measurement, an electron tunneling from a tip to the Kondo resonance actually has two different paths with different probabilities (the orbital of impurity and the continuum), leading to a quantum interference term. This term gives rise to a so-called Fano lineshape and described as
| (1) |
where is the normalized energy, with as the energy position of the resonance from the Fermi level and as the half-width at half-maximum of the curve. The parameter is related to the interference of the two channels contributing to the Fano line shapeUjsaghy , and the Fano resonance shape thus depends on . Fig. 3(b) shows the spectrum obtained at K and the corresponding fit to Eq. 1, which yields a half-width of meV. To investigate how these adatoms modify the spectra in superconducting state, we normalized the spectra obtained on and off the adatoms at K at energy of about meV, and then used Fano equation to fit ( LDOS). The outcomes are depicted in Fig. 3(c) and Fig. 3(d), respectively. One excellent fit of the spectrum outside the superconducting feature is achieved by introducing a linear background term into Eq. 1BorkNP , and yields a value of meV and thus K. With the excellent agreement to the Fano fitting of the tunneling spectra, we argue that the adatoms are most likely to be excess magnetic impurities, such as Fe or Co, which induce a strong Kondo resonance in the vicinity.
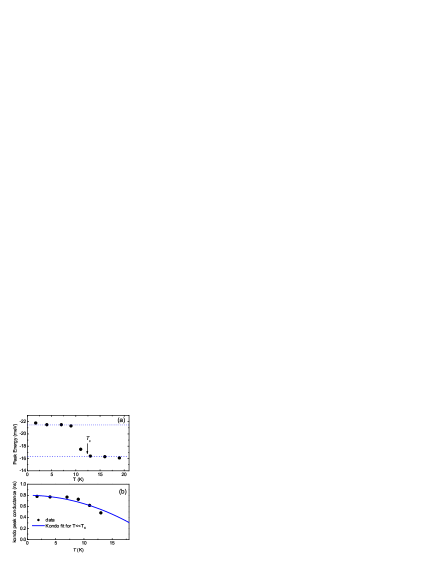
Fig. 3(a) allows us to semi-quantitatively determine the temperature dependence of the resonance characters. A close look into the variation of the resonance peak position reveals that it moves to Fermi energy slightly with elevating temperature. As a result, Fig. 4(a) shows the temperature dependence of the resonance peak energy directly extracted from the curves. The absolute value decreases from meV to meV, which cannot be simply explained by the thermal broadening. Interestingly, the resonance peak almost does not change its location at temperature below K or above . This decrease can be rationalized qualitatively considering that the Bogoliubov quasiparticle is responsible for screening the local spin of the adatom, which needs an energy of to overcome the superconducting pairing potential. Furthermore, the resonance peak energy changes slowly at low temperature but drop down very quickly near , giving further support to this picture. Similar temperature dependent behavior were observed on other adatoms in our measurements.
Another intriguing observation is that, with elevating temperature, the asymmetric background of the lineshape is gradually washed out. One important characteristics of the Kondo effect is the broadening and reduction of the Kondo resonance with increasing temperatureHankePRB . In the Fermi liquid model, the Kondo peak height has a temperature dependent behavior and is predicted to decay slowly with for Nozieres . However, determining the absolute intensity of the conductance for different spectra in STS measurements especially with varying temperature is a challenge. Considering that the LDOS at the positive bias side is relatively featureless, we used a simplest analytical treatment to illustrate the temperature dependence of the resonance feature, i.e., we normalized the spectra to the conductance value at about meV and then extracted the magnitude of the peak in the normalized curves as a description of the Kondo resonance peak height. The result arising from this process and a theoretical fit with are shown in Fig. 4(b). One can see that the decrease of the peak height follows the expected behavior of a Kondo resonance at low temperature.
No clear in-gap bound states were detected on these magnetic adatoms, in striking contrast with the pervious STS measurement on Mn impurities in this materialHyangNC and the conventional superconductor NbYazdaniScience . This seems to create a dilemma since the magnetic impurities are always regarded as pair-breaker in superconductors. Nevertheless, the competition between Kondo screening and superconductivity should be taken into account. The absence of in-gap states was also detected for adsorbed Co adatom on the Cu (111) surface using a superconducting Nb tipTernes . STS performed on manganese-phthalocyanine molecules on Pb(111) substrate revealed the evolution from a Kondo screened singlet ground state to a unscreened multiplet ground state, and the in-gap states was found to be induced very close to the gap edge when FrankeScience . The absence of the in-gap bound states in our present case may be understood as a consequence of the pairing together with the Kondo screening effect on the spin of the adatom. In iron pnictides, superconducting pairing is suggested to be established by exchanging the spin fluctuations leading to a gap with reversed signs on the hole and electron pocketsMazin ; Kuroki ; Lee ; Hirschfeld . STM measurements involving impurity effects have been successfully performed and many interesting features have been reportedHoffman ; Davis ; Song ; Pennec ; Hanaguri ; Golden . For the adatom we studied here, the larger energy scale of the Kondo resonance channel, with , may give rise to the strong screening of the local spin of the adatom. At the mean time, the scattering potential gets much broader due to this Kondo screening. For the inter-pocket pairing with large momentum transfer during the pair-scattering process, a broadened scattering potential can hardly act as the effective pair breaker. Both effects mentioned here will weaken the pair-breaking. This is quite similar to the case of Co dopants in Na(Fe1-xCox)AsYangPRB . Therefore, although the adatoms discovered in our experiment can produce clear Kondo effect and modify the tunneling spectrum significantly, the absence of in-gap bound states may however gain an explanation showing the consistency with the pairing.
In summary, we have presented spatial evolution and temperature dependence of the tunneling spectra associated with the adatoms on iron pnictide Na(Fe0.96Co0.03Mn0.01)As. At the adatom and below , the superconducting spectrum is significantly modified with a Kondo resonance like background. The temperature dependence of the resonance is in good agreement with the predicted Kondo behavior, giving further evidence that the Kondo effect is playing the role here. The spectra in the superconducting state reveal the absence of in-gap bound states predicted theoretically for magnetic impurities. This is understood as the consequence of the Kondo screening effect on the spin of the adatom, and the broadened scattering potential, both will weaken the pair breaking effect with the scenario of pairing.
This work is supported by the Ministry of Science and Technology of China (973 projects: 2011CBA00102, 2012CB821403, 2010CB923002), NSF and PAPD of China.
∗ huanyang@nju.edu.cn, hhwen@nju.edu.cn
References
- (1) P. W. Anderson, J. Phys. Chem. Solids 11, 26 (1959).
- (2) A. Balatsky, J. X. Zhu, and I. Vekhter, Rev. Mod. Phys. 78, 373 (2006).
- (3) M. E. Flatté and J. M. Byers, Phys. Rev. Lett. 78, 3761 (1997).
- (4) J. Kondo, Prog. Theor. Phys. 32, 37 (1964).
- (5) A. C. Hewson, The Kondo Problem to Heavy Fermions (Cambridge University Press, Cambridge, UK, 1993).
- (6) K. Satori, H. Shiba and Y. Shimizu, J. Phys. Soc. Japan. 61, 3239 (1992).
- (7) A. Yazdani, B. A. Jones, C. P. Lutz, M. F. Crommie, M. F. and D. M. Eigler, Science 275, 1767 (1997).
- (8) L. Yu, Atca Phys. Sin. 21, 75 (1965).
- (9) H. Shiba, Prog. Theor. Phys. 40, 435 (1968).
- (10) A. I. Rusinov, Zh. Eksp. Theor. Fiz. 56, 2047 (1969).
- (11) S. H. Pan, E. W. Hudson, K. M. Lang, H. Eisaki, S. Uchida, and J.C. Davis, Nature 403, 746 (2000).
- (12) H. Yang, Z. Y. Wang, D. L. Fang, Q. Deng, Q. -H. Wang, Y. -Y. Xiang, Y. Yang and H. -H. Wen, Nat. Comm. 4, 2749 (2013).
- (13) V. Madhavan, W. Chen, T. Jamneala, M. F. Crommie and N. S. Wingreen, Science 280, 567 (1998).
- (14) T. Jamneala, V. Madhavan, W. Chen and M. F. Crommie, Phys. Rev. B 61, 9990 (2000).
- (15) U. Fano, Phys. Rev. 124, 1866 (1961).
- (16) K. J. Franke, G. Schulze and J. I. Pascual, Science 332, 940 (2011).
- (17) A. V. Chubukov, Annu. Rev. Condens. Matter Phys. 3, 57 (2012).
- (18) Q. Deng, X. X. Ding, S. Li, J. Tao, H. Yang and H. -H. Wen, e-print arXiv: 1308.1356 (2013).
- (19) H. Yang, et al., Phys. Rev. B 86, 214512 (2012).
- (20) Z. Y. Wang, H. Yang, D. L. Fang, B. Shen, Q. -H. Wang, L. Shan, C. L. Zhang, P. C. Dai and H. -H. Wen, Nat. Phys. 9, 42 (2013).
- (21) K. Teichmann, M. Wenderoth, S. Loth, R. G. Ulbrich, J. K. Garleff, A. P. Wijnheijmer, and P. M. Koenraad, Phys. Rev. Lett. 101, 076103 (2008).
- (22) J. Li, W. -D. Schneider, R. Berndt, and B. Delley, Phys. Rev. Lett. 80, 2893 (1998).
- (23) O. Újsághy, J. Kroha, L. Szunyogh, and A. Zawadowski, Phys. Rev. Lett. 85, 2557 (2000).
- (24) J. Bork, Y. Zhang, L. Diekhöner, L. Borda, P. Simon, J. kroha, P. Wahl, and K.Kern, Nat. Phys. 7, 901 (2011).
- (25) T. Hänke, M. Bode, S. Krause, L. Berbil-Bautista, and R. Wiesendanger, Phys. Rev. B 72, 085453 (2005).
- (26) P. Nozières, J. Low Temp. Phys. 17, 31 (1974).
- (27) M. Ternes, A. J. Heinrich, and W. -D. Schneider, J. Phys.: Condens. Matter 21, 053001 (2009).
- (28) I. I. Mazin, D. J. Singh, M. D. Johannes, and M. H. Du, Phys. Rev. Lett. 101, 057003 (2008).
- (29) K. Kuroki, et al., Phys. Rev. Lett. 101, 087004 (2008).
- (30) F. Wang, and D. -H. Lee, Science 332, 200 (2011).
- (31) P. J. Hirschfeld, M. M. Korshunov, and I. I. Mazin, Rep. Prog. Phys. 74, 124508 (2011).
- (32) I. Zeljkovic, and J. E. Hoffman, Phys. Chem. Chem. Phys. 15, 13462 (2013).
- (33) M. P. Allan, et al., Nat. Phys. 9, 220 (2013).
- (34) C. -L. Song, et al., Phys. Rev. Lett. 109, 137004 (2012).
- (35) S. Grothe, S. Chi, P. Dosanjh, R. Liang, W. N. Hardy, S. A. Burke, D. A. Bonn, and Y. Pennec, Phys. Rev. B 86, 174503 (2012).
- (36) T. Hanaguri, K. Kitagawa, K. Matsubayashi, Y. Mazaki, Y. Uwatoko, and H. Takagi, Phys. Rev. B 85, 214505 (2012).
- (37) K. Koepernik, S. Johnston, E. van Heumen, Y. Huang, J. Kaas, J. B. Goedkoop, M. S. Golden, and Jeroen van den Brink, Phys. Rev. Lett. 109, 127001 (2012).