Extremely high polarization in 2010 outburst of blazar 3C 454.3
Abstract
The gamma-ray-detected blazar 3C 454.3 exhibits dramatic flux and polarization variations in the optical and near-infrared bands. In December 2010, the object emitted a very bright outburst. We monitored it for approximately four years (including the 2010 outburst) by optical and near-infrared photopolarimetry. During the 2010 outburst, the object emitted two rapid, redder brightenings, at which the polarization degrees (PDs) in both bands increased significantly and the bands exhibited a frequency-dependent polarization. The observed frequency-dependent polarization leads us to propose that the polarization vector is composed of two vectors. Therefore, we separate the observed polarization vectors into short and long-term components that we attribute to the emissions of the rapid brightenings and the outburst that varied the timescale of days and months, respectively. The estimated PD of the short-term component is greater than the maximum observed PD and is close to the theoretical maximum PD. We constrain the bulk Lorentz factors and inclination angles between the jet axis and the line of sight from the estimated PDs. In this case, the inclination angle of the emitting region of short-term component from the first rapid brightening should be equal to 90∘, because the estimated PD of the short-term component was approximately equal to the theoretical maximum PD. Thus, the Doppler factor at the emitting region of the first rapid brightening should be equal to the bulk Lorentz factor.
Subject headings:
galaxies: active — galaxies: jets — quasars: individual (3C 454.3) — methods: observational — techniques: photometric — techniques: polarimetric1. Introduction
Blazars are a type of active galactic nuclei with relativistic jets that are widely believed to be viewed at small angles to the line of sight. Blazars frequently show violent variations in flux and polarization, which vary on timescales ranging from minutes (Aharonian et al., 2007; Sasada et al., 2008) to years (Sillanp et al., 1996). On the timescale of months, blazars may turn out to be over 10 times brighter than in their quiescent state. These brightening phenomena are often called “outburst”.
The blazar 3C 454.3 with a redshift (Jackson & Browne, 1991) is one of the most famous blazar because it has emitted several large-amplitude outbursts. In 2005, it emitted a dramatic outburst that covered the range from radio to hard X-ray bands (Fuhrmann et al., 2006; Pian et al., 2006; Giommi et al., 2006; Villata et al., 2007). The maximum brightness in the optical band reached . Many authors reported that prominent outbursts occurred from 3C 454.3 in 2007, 2008 and 2009 and covered the range from radio to gamma-ray bands. Gamma-ray emission from the 2007 outburst was detected by the AGILE satellite (Vercellone et al., 2008; Donnarumma et al., 2009; Vercellone et al., 2010), and brightenings in other wavelengths were also detected (Villata et al., 2008; Raiteri et al., 2008a, b; Villata et al., 2009a; Sasada et al., 2010). Ghisellini et al. (2007) and Sikora et al. (2008) proposed two possible explanations for the origin of seed photons for inverse Compton scattering emission in the GeV gamma-ray band. A large-amplitude gamma-ray brightening in the 2008 outburst was detected by the Fermi Gamma-ray Space Telescope (Bonning et al., 2009a; Abdo et al., 2009). Based on intensive monitoring, it was determined that the flux variations in the optical bands lagged no more than one day behind those of the GeV gamma-ray band (Vercellone et al., 2009a; Donnarumma et al., 2009; Bonning et al., 2009a; Vercellone et al., 2010). In 2009, an outburst from 3C 454.3 occurred over all wavelengths: in the gamma-ray band it was detected by Fermi and AGILE (Striani et al., 2009a, b; Escande & Tanaka, 2009; Striani et al., 2010; Pacciani et al., 2010; Ackermann et al., 2010), in the X-ray band it was detected by INTEGRAL (Vercellone et al., 2009b), Swift/XRT (Sakamoto et al., 2009), and Swift/BAT (Krimm et al., 2009), in the optical bands it was detected by many groups (Villata et al., 2009b; Bonning et al., 2009b; Sasada et al., 2009; Raiteri et al., 2011; Sasada et al., 2012), and in the radio bands it was detected by Raiteri et al. (2011) and Jorstad et al. (2013).
In September 2010, a prominent outburst from 3C 454.3 was detected in the GeV gamma-ray band by Fermi and AGILE (Abdo et al., 2011; Vercellone et al., 2011). The peak flux reached 8510-6 photons cm-2 s-1 in December 2010. The optical continuum and emission-line fluxes increased simultaneously in this outburst (Vercellone et al., 2011; León-Tavares, 2013), and the X-ray and radio fluxes also increased (Wehrle et al., 2012; Jorstad et al., 2013).
In the present study, we report the results of using the Kanata telescope to monitor emission from 3C 454.3 using optical and near-infrared (NIR) photopolarimetry from July 2007 to January 2011: a period that includes the 2010 outburst. In December 2010, the polarization degree (PD) increased in the rapid brightenings of the 2010 outburst and the polarization difference between the optical and NIR bands became frequency dependent (this phenomenon is called “frequency-dependent polarization” or FDP). The temporal variations of polarization angle (PA) indicate that no rotation event occurred during this outburst. The paper is organized as follows: In section 2, we present the methods used for observation and analysis. In section 3, we report the results of the photometric and polarimetry observation. In section 4, we discuss the origin of the observed FDP and emission regions of the observed rapid brightenings and outburst. The conclusion is given in section 5.
2. Observations
We monitored 3C 454.3 by multi-band photopolarimetry from July 2007 to January 2011 (JD 2454618—2455590). The monitoring was performed in the optical and NIR bands by attaching TRISPEC (Watanabe et al., 2005) and HOWPol (Kawabata et al., 2008) to the 1.5-m Kanata telescope at the Higashi-Hiroshima Observatory. TRISPEC enables simultaneous photopolarimetric observations in the optical band and two NIR bands. HOWPol can also make photopolarimetric measurements in the optical band. Unfortunately during the entire monitoring period, one channel (IR-2) of the two NIR arrays and an optical CCD of the TRISPEC were at times not available because of readout errors. We compensated for the lack of optical data by using the HOWPol. Thus, we measured the - and -band photopolarimetry at the same time. An observation sequence unit consisted of successive exposures with a half-wave plate set at four different angles. The polarization for the given observation sequence unit was derived from the set of four exposures.
We adjusted the integration time depending on the sky conditions and the brightness of the object. Typical integration times were 170 s in both bands. For all images, the bias and dark were subtracted and the image field was flattened before performing the aperture photometry. By comparing with star 13 listed in González-Pérez et al. (2001), which appeared in the same frame as 3C 454.3, we were able to conduct differential photometry. For star 13, we used the magnitudes and (González-Pérez et al., 2001; Skrutskie et al., 2006), and (for 3C 454.3) we adopted a Galactic extinction of 0.349 and 0.097 mag in the and bands, respectively (Schlegel et al., 1998). We converted the observed magnitudes into fluxes by referring to Fukugita, Shimasaku & Ichikawa (1995) and Bessell, Castelli & Plez (1998).
We confirmed that the instrumental polarization of TRISPEC was less than 0.1 % in the and bands by using the unpolarized standard stars. Thus, we did not apply any correction for the instrumental polarization. However, we applied the instrumental depolarization factors of 0.827 and 0.928 in the and bands, respectively. The zero point of the PA was defined by the standard system (measured from north to east) by observing the polarized standard stars: HD 19820 and HD 25443 (Wolff, Nordsieck & Nook, 1996).
A large instrumental polarization (4%) appears from HOWPol because of the asymmetric reflection of the incident light from the tertiary mirror of the Kanata telescope. The instrumental polarization can be expressed as a function of a declination of 3C 454.3 and an hour angle at the observation. We calculate the intrinsic polarization by subtracting the instrumental polarization from the raw polarization. The deviation of the instrumental polarization is estimated by observing the unpolarized standard stars. The error from instrumental polarization is less than 0.5, which we calibrate from the deviation.
3. Results
 |
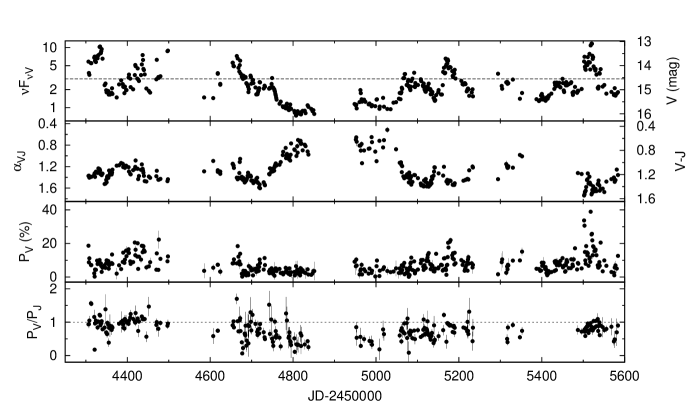 |
Figure 1 shows the temporal variations of the observational parameters during our 2010 monitoring. The bottom panel of Figure 1 shows the -band light curve during the entire 2010 monitoring period. From top to bottom, the panels show the - and -band light curves, the temporal variations of spectral index (), the PDs and PAs in the and bands, and the ratio between the PDs in both bands during the 2010 outbursts. The units of flux, PD and PA are erg s-1 cm-2, percent and degrees, respectively. During the 2010 outburst, there were two rapid brightenings at JD 2455502 and 2455518 shown by solid lines in Figure 1. The maximum fluxes in the and bands were 1.16710-10 and 2.06010-10 erg s-1 cm-2, respectively, in JD 2455520. After the peak, the object gradually became faint. The object became redder as it brightened, which we call the “redder-when-brighter” phenomenon. In general, blazars become bluer as they brighten, (“bluer-when-brighter”; Racine 1970). However, in previous publications, 3C 454.3 was reported to be redder-when-brighter (Miller, 1981; Villata et al., 2006; Raiteri et al., 2007; Sasada et al., 2010).
The polarization vectors in both bands were variable and exhibited almost similar behavior. In the and bands, the PDs reached as high as 38.90.4 and 46.52.1 %, respectively, during the rapid brightenings. Although the PD characteristics were approximately the same, the -band PD increased more than the -band PD. Thus, 3C 454.3 exhibits a FDP, which means the PDs differ between two selected wavelengths. The eighth panel of Figure 1 shows that the ratio was slightly less than unity during the 2010 monitoring period. However, the temporal variations of the PAs were approximately the same. During the 2005, 2007, and 2009 outbursts, polarization rotation events were detected for 3C 454.3 (Jorstad et al., 2010; Sasada et al., 2010, 2012). However, we did not detect any polarization rotation events during the 2010 outburst with our frequency of observations, which was at most once a day.
Figure 2 shows the temporal variation of flux in the band, , the PD in the band, and the ratio for our four-year monitoring period. All the parameters varied, including the ratio . During the faint state from JD 2454800 to 2455050, became bluer. However, the object also showed the bluer-when-brighter feature from JD 2454300 to JD 2454340 (Sasada et al., 2010, 2012). During the bright states regarded as outbursts, the parameter was 1.330.05 (2007; JD 2454306 to 2454341), 1.340.13 (2008; JD 2454654 to 2454693), 1.480.09 (2009; JD 2455162 to 2455190), and 1.590.11 (2010; JD 2455502 to 2455532). Here, the error is taken to be the standard deviation in The 2010 outburst was the reddest of the four outbursts.
The PDs in the band (and also the band) at the rapid brightenings of the 2010 outburst were the highest observed during the four-year monitoring period. The average PDs in the band during the outbursts in 2007, 2008, 2009, and 2010 were 7.4% 3.8%, 6.1% 4.6%, 11.4% 5.8%, and 17.4% 8.1%, respectively, where the error is the standard deviation in the PD. The ratio was often less than unity. The average ratios during the 2007, 2008, 2009, and 2010 outbursts were 1.0 0.3, 0.9 0.5, 0.9 0.2, and 0.8 0.1, respectively. The ratios during the 2008, 2009, and 2010 outburst were less than or approximately equal to unity (Figure 2). Their standard deviations are larger, except in the 2010 outburst for which the ratio is less than unity. Thus, at least FDP occurs during the 2010 outburst.
4. Discussion
4.1. Origin of Frequency-Dependent Polarization
During the 2010 outburst, 3C 454.3 frequently exhibited FDP along with the rapid brightenings. We examine two possible causes of the FDP: (1) contamination from an unpolarized thermal component with spectral content different than the synchrotron radiation and (2) intrinsic FDP in the synchrotron radiation.
The object 3C 454.3 was redder-when-brighter during the faint state (Figure 2), which may be explained by the combination of two emission processes: thermal radiation from the disk and synchrotron radiation from the jet. Thermal radiation is less variable and bluer than synchrotron radiation. In the optical and UV bands, thermal radiation from an accretion disk is expected to be affected by the spectral shape (Sasada et al., 2010, 2012). Raiteri et al. (2008b) and Sasada et al. (2010) proposed that the redder-when-brighter trend in 3C 454.3 is because of a substantial contribution of thermal emission from a disk. When the thermal emission is negligible, this trend shows “saturation” at 14. We estimate the -band saturation level as 14.55 by using and (Raiteri et al., 2008b) and assuming that the spectral shape from the to bands follows a simple power-law. The saturation level in the band is shown as a dotted line in the top panel of Figure 2. Note that this saturation level is not the flux of the thermal radiation but the flux level at which the thermal radiation becomes negligible compared with the observed flux.
In the faint state, the thermal component, being comparable to the synchrotron component, emerges below the saturation level (Raiteri et al., 2008b). The unpolarized thermal radiation would lower the PD in the band compared with that in the band, because the thermal radiation becomes more dominant toward the bluer band. For this reason, the ration was less than unity during the faint state from JD 2454800 to JD 2455000. However, during the rapid brightenings of the 2010 outburst, the object also apparently became redder and exhibited FDP, when the peaks were brighter than the saturation level shown in the top panel of Figure 2. This indicates that the synchrotron radiation dominated the thermal radiation during the rapid brightenings. Thus, the FDP was not caused by contamination from thermal radiation, but was intrinsic to the synchrotron radiation.
4.2. Frequency-Dependent Polarization of Synchrotron Radiation from Shock Regions
We will discuss a possible cause of FDP at the synchrotron radiation. For electrons with a single power-law distribution of energies, a theoretical maximum PD of synchrotron emission () is;
| (1) |
where is the power-law index for electron energy distribution (Rybicki & Lightman, 1979). The PD is independent of wavelength, if is uniform. However, the polarization in the rapid brightenings exhibited FDP.
Synchrotron radiation and its polarization in a blazar is caused by the shock propagating down a relativistic jet with a turbulent magnetic field (Marscher & Gear, 1985; Hughes, Aller & Aller, 1985). There could be multiple shocks and emitting regions even in a single jet. Valtaoja et al. (1988) suggest that frequency-dependent optical polarization events can be explained with two-component models, typically consisting of a steep component and a flatter (more highly polarized) component. If a shock occurs in a jet, particles in the shock region should be accelerated by a first-order Fermi acceleration process. High energy particles are generated, and they emit higher frequency synchrotron radiation. The shock grows rapidly, and the synchrotron peak moves steeply upward through the infrared/millimeter regime (Valtaoja et al., 1991). Thus, FDP in the optical range could be caused by the early stages of such shocks. If two synchrotron emissions exist with different polarization vectors and spectral shapes, the observed polarization is the sum of the two polarization vectors. The fractions of these two components in the and bands differ depending on its spectral shape. The PD observed in each band should also differ, and thus, the object exhibits the FDP. Therefore, more than two polarization components are required to explain the observed FDP only by the synchrotron radiation.
4.3. Shocked Jet Model Applied to Rapid Brightenings
4.3.1 Polarization in Shocked Jet Model
The PD of the synchrotron radiation in blazars depends not only on the power-law index of the electron energy distribution but also on the degree of the alignment of the magnetic field in the shock region. The PD should be less than the theoretical maximum PD , because the magnetic field in the emitting region is turbulent. When the magnetic field is compressed by the shock, it should be aligned perpendicular to the direction in which the front of region of shock moves (Laing, 1980). In this case, the PD of the synchrotron radiation from the shock region becomes greater and approaches . We shall derive an expression for PD caused by an initially random magnetic field that is compressed and viewed at an angle to the plane of compression (Hughes, Aller & Aller, 1985). The increase in PD generated by the compression of the emitting region and the alignment of magnetic field can be represented as;
| (2) |
where is the ratio of densities in the shock region with respect to the unshocked region, , is the angle between the direction in which the shock moves and the line of sight in the co-moving frame (Hughes & Miller, 1991). The inclination angle of the shock with respect to the jet axis in the observer’s frame is represented by the bulk Lorentz factor of the emitting region and the viewing angle in the co-moving frame:
| (3) |
If this compression by the shock is described by a fluid approximation, then it is described by the Rankine-Hugoniot equations. In these equations, is , where is the Mach number and is the specific heat ratio for the case in which the relativistic jet is constructed from monatomic molecules. In this case, should be less than 7. For , we can also estimate a lower limit of by using equation (2) with the ratio between the PD and .
Between the optical and NIR wavelengths, the energy of synchrotron radiation particles should be approximately similar, because the observed in the optical and NIR bands are almost the same (Sasada et al., 2010, 2012). In this case, we assume that the observed is the spectral index of synchrotron radiation and follows . In the optical and NIR bands, the for synchrotron radiation estimated from should be the same. Hereafter, we assume the for the optical and NIR bands are the same. Figure 3 shows the light curve in the band, the temporal variation of calculated from equation (1) by using the observed , and the ratio and . The were distributed around 79 % and the amplitude was less than 4 %. The is much less variable than the observed PD, and thus the temporal variation of and follow the variations of the observed PDs. Hughes, Aller & Aller (1985) suggest that the power-law index of the electron distribution does not play a major role in determining PD. Our result is consistent with this suggestion.
 |
4.3.2 Decomposition of Radiations and Application Shocked Jet Model
Short- and long-term variations both in the flux and polarization have been reported for blazars (Hagen-Thorn et al., 2008; Villforth et al., 2010; Sasada et al., 2011; Sakimoto et al., 2013; Sorcia et al., 2013). Temporal variations in observed flux and polarization occur on various timescales. We can assume that the observed synchrotron radiation consists of short and long-term variable components having different spectra and different polarization vectors (Sasada et al., 2011). In this case, the observed flux and polarization vector ( and ) are;
| (4) | |||
| (5) |
where fluxes ( and ) and polarization vectors ( and ) are the long- and short-term components.
The short-term variation is produced by the acceleration at one shock region in the shocked jet model. Therefore, we can apply equations (2) and (3) to the short-term variable components. Note that it is important to define timescales we are looking at, because there are various variation timescales as can be seen from our four-year monitoring lightcurve (figure 2). As a result, the behavior of the polarization and physical parameters estimated from its polarization depend on the choice of timescales. 3C 454.3 clearly has two different-timescale variations (timescales of days and a month) for the 2010 outburst (figure 1). Then, the days-timescale rapid brightenings and month-timescale slowly varing outburst can be regarded as the short- and long-term components. We separate and from and for the rapid brightenings of the 2010 outburst using the difference of the variation timescales and estimate the bulk Lorentz factors and inclination angles from equations (2) and (3).
The timescale of the short-term variation is shorter than that of the long-term variation. We estimate the long-term components in the rapid brightenings from the pre- and post-brightening data, because the long-term variation can be regarded as a dominant component in the pre and postbrightening. We interpolate and at the brightening by using a linear approximation based on the pre- and post-brightening data. Figures 4 and 5 show the dates of the rapid brightenings (solid line) and the pre and postbrightenings (dashed line). Unfortunately, the data from the predate of the second brightening was obtained only in the band, because of the aforementioned readout error of our instrument. To estimate , we interpolate the -band flux from the -band flux by assuming at the predate of the second brightening to be the observed averaged (JD 24555111 to JD 2455515). We subtract the estimated and from and and calculate and . Currently, calculations of polarization are performed by using the Stokes parameters and in flux units (erg s-1 cm-2). Next, we calculate the ratio between (=) and estimated from and 1.52 at the first and second brightenings (). We also calculate the , , and in a similar manner. We show the resultant parameters of the short- and long-term components at the first and second brightenings in table 1. The at these brightenings are greater than and . of the rapid brightenings indicate that the appearance of the highly polarized short-term component causes the increase of .
 |
 |
| Band | |||||
|---|---|---|---|---|---|
| (1) | (2) | (3) | (4) | (5) | (6) |
| 1st short | 4.95 | 4.30 | 87 | 1.07 | |
| 1st long | 5.60 | 0.72 | 13 | 0.16 | |
| 2nd short | 5.93 | 3.78 | 64 | 0.81 | |
| 2nd long | 4.98 | 0.54 | 11 | 0.14 |
Note. — Column 1 - brightenings, 2 - Using band, 3 - total fluxes of each component at the brightenings (10-11 erg s-1 cm-2), 4 - polarized fluxes (10-11 erg s-1 cm-2), 5 - degree of polarization calculated from the total and polarized fluxes (%), 6 - ratio between PDs and the estimated from .
Although the ratio for the first brightenings is greater than unity, should be less than unity in principle. The higher value for can be caused by a systematic uncertainty of the long-term component estimated by the interpolation of the linear approximation from the pre- and post-brightening data. We estimate an error of the ratio and compare the ratio of the short-term component to that of the observed maximum PD with consideration for these errors. The error of the ratio , , is calculated by the errors in the total and polarized fluxes and of the short-term component. The uncertainty in is negligible with respect to because is less affective to . The of the first and second rapid brightenings are approximately equal to 0.14 and 0.11 when we assume systematic errors of 10% in the total and polarized fluxes of the short-term component caused by the estimation of long-term component. The assumed errors of the short-term component are 10 times greater than those of the observed total and polarized fluxes. The ratio for the first brightening is still close to unity even considering large systematic uncertainties. In this case, the alignment of the magnetic field in the emitting region of the short-term component is quite uniform. The ratio of the second brightening is also greater than that at the observed maximum PD. The lower limit of is calculated from the ratio for the second brightening when is equal to 90∘, .
 |
Using equations (2) and (3), we derived a constraints on and for the first and second brightenings. Because for the first brightening is close to , should be 90∘ according to equation (2). In this case, as the first order of approximation. The Doppler factor, where , should be equal to . We can calculate the limits of the parameters for and by using equations (2) and (3) and using the ratio for the second brightening with the highest case of and at the observed maximum PD for comparison. The curves in Figure 6 show the upper limits for and . The values of and should fall below these lines because . The open triangle shows the parameter for and adopted by Vercellone et al. (2011), which is estimated from the multi-wavelength SED from radio to gamma-ray bands around the 2010 outburst. The adopted parameters for and for the outburst considered by Vercellone et al. (2011) is excluded from the acceptable parameter space estimated from and . As much as we don’t know the origin of the long-term component, if we apply the shocked jet model to the case of for the first and second brightenings, the acceptable parameter space of and can allow the parameter for and adopted by Vercellone et al. (2011).
Although the timescale of the rapid brightenings was several days, the 2010 outburst lasted two months. The rapid brightenings were faster than the entire variation trend of the outburst. The timescale of variation becomes faster in proportion to . Thus, for the rapid brightenings can be greater than that of the outburst. In our results, for the first rapid brightening should equal to explain its high polarization. Thus, for the rapid brightenings can be greater than that of the outburst for these variation timescales. The emitting region of the rapid brightenings must differ from that of the outburst to explain why the values of for the rapid brightenings were greater than those of the outburst.
PKS 2155304, a TeV gamma-ray-emitting BL Lac object, varies on the timescale from 3 to 5 minutes in the TeV band (Aharonian et al., 2007). Begelman, Fabian & Rees (2008) suggest that the bulk Lorentz factors in the jet must be 50 to explain this rapid variation. The Lorentz factor clearly exceeds the jet Lorentz factors 10. Several authors propose jet models to explain this complex situation (Giannios, Uzdensky & Begelman, 2009; Ghisellini et al., 2009). Our results indicate that 3C 454.3 is also involved in two or more components varying on different timescales with different values for .
5. Conclusions
We monitored blazar 3C 454.3 in the optical and near-infrared bands for approximately four years starting from July 2007, and we detected two types of variations in 2010: a large-amplitude outburst occurring on a timescale of months and extraordinary rapid brightenings occurring on a timescale of days. These brightenings had three features: (1) the bands reddened, (2) the degree of polarization (PD) increased in the and bands, and (3) the polarization was frequency dependent (FDP).
Based on these results, we suggest that the observed polarization
vectors can be decomposed into two components, namely long- and
short-term components. We separate the short-term component, estimating
the long-term component for the rapid brightenings from the pre- and
post-brightening data. The estimated PD of the short-term component for
the rapid brightenings was higher than the observed maximum PD and was
close to the theoretical maximum PD. This result indicates that the
short-term emitting regions responsible for the rapid brightenings are
different from the long-term emitting region that radiated the
outburst. The blazar FDP gives us important constraints on ,
, and .
This work was supported by a Grant-in-Aid for JSPS Fellows.
References
- Abdo et al. (2009) Abdo, A. A., et al. 2009, ApJ, 699, 817
- Abdo et al. (2011) Abdo, A. A., et al. 2011, ApJ, 733, L26
- Ackermann et al. (2010) Ackermann, M., et al. 2010, ApJ, 721, 1383
- Aharonian et al. (2007) Aharonian, F., et al. 2007, ApJ, 664, L71
- Begelman, Fabian & Rees (2008) Begelman, M. C., Fabian, A. C., & Rees, M. J. 2008, MNRAS, 384, L19
- Bessell, Castelli & Plez (1998) Bessell, M. S., Castelli, F., & Plez, B. 1998, A&A, 333, 231
- Bonning et al. (2009a) Bonning, E. W., Bailyn, C., Urry, C. M., et al. 2009a, ApJ, 697, L81
- Bonning et al. (2009b) Bonning, E., et al. 2009b, ATel, 2332, 1
- Donnarumma et al. (2009) Donnarumma, I., et al. 2009, ApJ, 707, 1115
- Escande & Tanaka (2009) Escande, L. & Tanaka, Y. T. 2009, ATel, 2328, 1
- Fuhrmann et al. (2006) Fuhrmann, L., et al. 2006, A&A, 445, L1
- Fukugita, Shimasaku & Ichikawa (1995) Fukugita, M., Shimasaku, K., & Ichikawa, T. 1995, PASP, 107, 945
- Ghisellini et al. (2007) Ghisellini, G., Foschini, L., Tavecchio, F., & Pian, E. 2007, MNRAS, 382, L82
- Ghisellini et al. (2009) Ghisellini, G., Tavecchio, F., Bodo, G., & Celotti, A. 2009, MNRAS, 393, L16
- Giannios, Uzdensky & Begelman (2009) Giannios, D., Uzdensky, D. A., & Begelman, M. C., 2009, MNRAS, 395, L29
- Giommi et al. (2006) Giommi, P., et al. 2006, A&A, 456, 911
- González-Pérez et al. (2001) González-Pérez, J. N., Kidger, M. R., & Martín-Luis, F. 2001, AJ, 122, 2055
- Hagen-Thorn et al. (2008) Hagen-Thorn, V. A., Larionov, V. M., Jorstad, S. G., Arkharov, A. A., Hagen-Thorn, E. I., Efimova, N. V., Larionova, L. V., & Marscher, A. P. 2008, ApJ, 672, 40
- Hughes, Aller & Aller (1985) Hughes, P. A., Aller, H. D., & Aller, M. F. 1985, ApJ, 298, 301
- Hughes & Miller (1991) Hughes, P. A. & Miller, L. 1991, in Beams and Jets in Astrophysics, ed. P. A. Hughes (Cambridge Univ. Press), 1
- Jackson & Browne (1991) Jackson, N. & Browne, W. A. 1991, MNRAS, 250, 414
- Jorstad et al. (2010) Jorstad, S. G., et al. 2010, ApJ, 715, 362
- Jorstad et al. (2013) Jorstad, S. G., et al. 2013, arXiv1307.2522
- Kawabata et al. (2008) Kawabata, K. S., et al. 2008, Proc, SPIE, 7014, 10144
- Krimm et al. (2009) Krimm, H. A., et al. 2009, ATel, 2330, 1
- Miller (1981) Miller, H. R. 1981, ApJ, 244, 426
- Marscher & Gear (1985) Marscher, A. P. & Gear, W. K. 1985, ApJ, 298, 114
- Laing (1980) Laing, R. A. 1981, MNRAS, 193, 439
- León-Tavares (2013) León-Tavares, J. 2013, ApJ, 763, L36
- Pacciani et al. (2010) Pacciani, L., et al. 2010, ApJ, 716, L170
- Pian et al. (2006) Pian, E., et al. 2006, A&A, 449, 21
- Racine (1970) Racine, R. 1970, ApJ, 159, L99
- Raiteri et al. (2007) Raiteri, C. M., et al. 2007, A&A, 473, 819
- Raiteri et al. (2008a) Raiteri, C. M., Villata, M., Chen, W. P., et al. 2008a, A&A, 485, L17
- Raiteri et al. (2008b) Raiteri, C. M., Villata, M., Chen, W. P., et al. 2008b, A&A, 491, 755
- Raiteri et al. (2011) Raiteri, C. M., Villata, M., Chen, W. P., et al. 2011, A&A, 534, 87
- Rybicki & Lightman (1979) Rybicki, G. B. & Lightman, A. P. 1979, Radiative Processes in Astrophysics (New York: Interscience)
- Sakamoto et al. (2009) Sakamoto, T., D’Ammando, F., Gehrels, N., Kovalev, Y. Y., & Sokolovsky, K. 2009, ATel, 2329, 1
- Sakimoto et al. (2013) Sakimoto, K., et al. 2013, PASJ, 65, 35
- Sasada et al. (2008) Sasada, M., et al. 2008, PASJ, 60, L37
- Sasada et al. (2009) Sasada, M., et al. 2009, ATel, 2333, 1
- Sasada et al. (2010) Sasada, M., et al. 2010, PASJ, 62, 645
- Sasada et al. (2011) Sasada, M., et al. 2011, PASJ, 63, 489
- Sasada et al. (2012) Sasada, M., et al. 2012, PASJ, 64, 58
- Schlegel et al. (1998) Schlegel, D. J., Finkbeiner, D. P., & Davis, M. 1998, ApJ, 500, 525
- Sillanp et al. (1996) Sillanp, A., et al. 1996, A&A, 305, L17
- Sikora et al. (2008) Sikora, M., Moderski, R., & Madejski, G. M. 2008, ApJ, 675, 71
- Skrutskie et al. (2006) Skrutskie, M. F., et al. 2006, AJ, 131, 1163
- Sorcia et al. (2013) Sorcia, M., Benítez, E., Hiriart, D., López, J. M., Cabrera, J. I., Mújica, R., Heidt, J., Agudo, I., Nilsson, K., & Mommert, M. 2013, ApJ, 206, 11
- Striani et al. (2009a) Striani, E., et al. 2009a, ATel, 2322, 1
- Striani et al. (2009b) Striani, E., et al. 2009b, ATel, 2326, 1
- Striani et al. (2010) Striani, E., et al. 2010, ApJ, 718, 455
- Valtaoja et al. (1988) Valtaoja, E., et al. 1988, A&A, 203, 1
- Valtaoja et al. (1991) Valtaoja, L., Sillanpaa, A., Valtaoja, E., Shakhovskoi, N. M., & Efimov, I. S. 1988, AJ, 101, 78
- Vercellone et al. (2008) Vercellone, S., et al. 2008, ApJ, 676, L13
- Vercellone et al. (2009a) Vercellone, S., Chen, A. W., Vittorini, V., et al. 2009, ApJ, 690, 1018
- Vercellone et al. (2009b) Vercellone, S., et al. 2009, ATel, 2344, 1
- Vercellone et al. (2010) Vercellone, S., et al. 2010, ApJ, 712, 405
- Vercellone et al. (2011) Vercellone, S., et al. 2011, ApJ, 736, L38
- Villata et al. (2006) Villata, M., et al. 2006, A&A, 453, 817
- Villata et al. (2007) Villata, M., et al. 2007, A&A, 464, L5
- Villata et al. (2008) Villata, M., et al. 2008, A&A, 481, L79
- Villata et al. (2009a) Villata, M., et al. 2009a, A&A, 504, L9
- Villata et al. (2009b) Villata, M., Raiteri, C. M., Larionov, V. M, Konstantinova, T. S., Nilsson, K., Pasanen, M., & Cariosati, D. 2009b, ATel, 2325, 1
- Villforth et al. (2010) Villforth, C., et al. 2010, MNRAS, 402, 2087
- Watanabe et al. (2005) Watanabe, M., et al. 2005, PASP, 117, 870
- Wehrle et al. (2012) Wehrle, A. E., Marscher, A. P., Jorstad, S. G., Gurwell, M. A., Joshi, M., MacDonald, N. R., Williamson, K. E., Agudo, I., & Grupe, D. 2012, ApJ, 758, 72
- Wolff, Nordsieck & Nook (1996) Wolff, M. J., Nordsieck, K. H., & Nook, M. A. 1996, AJ, 111, 856