A SOLAR ERUPTION DRIVEN BY RAPID SUNSPOT ROTATION
Abstract
We present the observation of a major solar eruption that is associated with fast sunspot rotation. The event includes a sigmoidal filament eruption, a coronal mass ejection, and a GOES X2.1 flare from NOAA active region 11283. The filament and some overlying arcades were partially rooted in a sunspot. The sunspot rotated at 10∘ per hour rate during a period of 6 hours prior to the eruption. In this period, the filament was found to rise gradually along with the sunspot rotation. Based on the HMI observation, for an area along the polarity inversion line underneath the filament, we found gradual pre-eruption decreases of both the mean strength of the photospheric horizontal field () and the mean inclination angle between the vector magnetic field and the local radial (or vertical) direction. These observations are consistent with the pre-eruption gradual rising of the filament-associated magnetic structure. In addition, according to the Non-Linear Force-Free-Field reconstruction of the coronal magnetic field, a pre-eruption magnetic flux rope structure is found to be in alignment with the filament, and a considerable amount of magnetic energy was transported to the corona during the period of sunspot rotation. Our study provides evidences that in this event sunspot rotation plays an important role in twisting, energizing, and destabilizing the coronal filament-flux rope system, and led to the eruption. We also propose that the pre-event evolution of may be used to discern the driving mechanism of eruptions.
1 Introduction
Solar eruptions, including solar flares, coronal mass ejections (CMEs), and filament eruptions, are spectacular energy release phenomena that occur in the solar atmosphere. They often lead to catastrophic impacts on the near-Earth space environment. They are generally believed to be a result of the rapid release of magnetic energy stored in highly-stressed/twisted magnetic structures of the corona (e.g., Forbes 2000; Low 2001). The magnetic energy is transported into the corona via slow photospheric footpoint motions, e.g., emergence, shearing, twist, etc., in a relatively long period of time, comparing to the time scale of an eruption. Among various forms of photospheric motions, sunspot rotation, first observed a century ago by Evershed (1910), has been considered to be an important process and has been studied extensively (e.g., Stenflo 1969; Barnes & Sturrock 1972; Ding et al. 1977, 1981; Amari et al. 1996; Tokman & Bellan 2002; Trk & Kliem 2003; Brown et al. 2003; Regnier et al. 2006; Yan et al. 2007, 2008a, 2008b, 2009; Su et al. 2010).
Previous studies confirmed the important role played by sunspot rotation in transporting energy and helicity from below the photosphere into the corona with quantitative calculations (e.g., Kazachenko et al. 2009; Vemareddy et al. 2012), and revealed some temporal and spatial association of sunspot rotation with solar flares on the basis of observational data analysis (e.g., Zhang, Li & Song 2007; Zhang, Liu & Zhang 2008; Yan et al. 2007, 2008a, 2008b, 2009; Jiang et al. 2012). There also exist a number of magnetohydrodynamic (MHD) studies examining the consequence of twisting a flux rope structure which is confined by overlying magnetic arcades (e.g., Amari et al. 1996; Trk et al. 2003). In a latest study, Trk et al. (2013) examined the role of twisting the overlying arcades in the onset of a CME using a flux rope model. These studies showed that the CME can be triggered by twisting either the core flux rope structure or the overlying coronal fields, thus established the importance of sunspot rotation in the eruption process from a theoretical perspective. On the other hand, observational studies connecting sunspot rotation with CMEs remain elusive.
Here we present a case study of the evolution of a sigmoidal filament which has roots in a rotating sunspot. The study, involving multi-wavelength imaging and vector magnetic field data from the Solar Dynamics Observatory (SDO), provides a rare case revealing the role of sunspot rotation being as not only a general energy transport process but also a direct driving process that leads to the eventual flare, CME, and filament eruption.
2 Observation
We analyzed the multi-wavelength imaging data provided by the Atmospheric Imaging Assembly (AIA; Lemen et al. 2012) and the vector magnetic field and continuum intensity data by the Helioseismic and Magnetic Imager (HMI; Schou et al. 2012) on board the SDO spacecraft for the NOAA active region (AR) 11283 between 2011 September 3 and September 8. The AR was located N14W15 at 16:00 UT on September 6, close to the disk center. AIA observes the Sun in 10 different wavebands, covering a wide range of temperatures and reveals physical processes at various layers of the solar atmosphere. The data are taken with a pixel size of 0.6′′ and 12s cadence. For our study, we only analyze the AIA observations at the 304 Å (HeII, T 0.05 MK) to follow the dynamics of the cool filament and the 94 Å (FeXVIII, T6.3 MK) observation to trace the hot eruptive structures. The processed disambiguated HMI vector magnetic field data are of 12-minute cadence at a 0.5′′ pixel resolution, provided by the HMI team (see ftp://pail.stanford.edu/pub/HMIvector2/movie/ar1283.mov for the corresponding movie). These vector magnetogram data have been de-rotated to the disk center, and remapped using a Lambert equal area projection (Calabretta & Greisen 2002; Thompson 2006). The field vectors are then transformed to Heliographic coordinates with projection effect removed (Gary & Hagyard 1990, also see Sun et al., 2012).
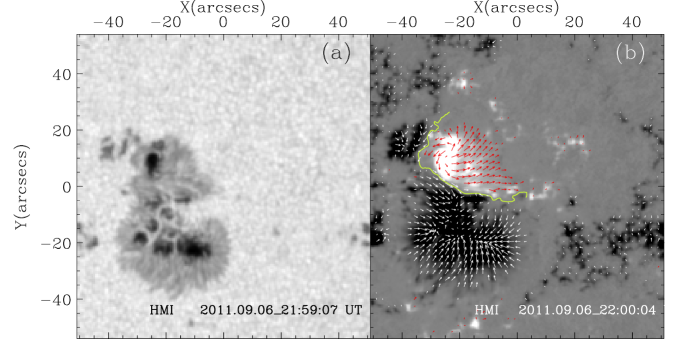
In Figure 1, we present the intensity map (panel a) and HMI vector magnetogram (panel b) at 22:00 UT on September 6, just before the X2.1 flare. We show the local vertical (i.e., radial) magnetic field component () in white and black for positive and negative polarities. The color-coded arrows in panel (b) represent the horizontal magnetic field , which is the component parallel to the solar surface (i.e., , where and represent two orthogonal directions in the plane of the solar surface). The yellow curve represents the magnetic polarity inversion line (PIL). From the temporal evolution of the HMI vector magnetic field, this AR is characterized by an emerging positive polarity sunspot. The emergence started from the heliographic location N13E28 near the end of September 3 and was the dominant process in the first two days. After that, the AR developed into a magnetic complexity. Since early September 6, the emerged sunspot exhibited an apparent clockwise rotation, as well as a slow westward shearing motion along the PIL. The rotation direction is consistent with the right-handed twist of the horizontal field as can be seen in panel b. Near the PIL, this field component is almost parallel to the PIL indicating the presence of strong magnetic shear.
Many flares have been produced by this AR from September 3 to 7. Among them, three big flares were observed on September 6 and 7 with GOES SXR flare classes being M5.3, X2.1, and X1.8. Their peaking times were 1:50 UT and 22:20 UT on September 6, and 22:38 UT on September 7, respectively. The sunspot rotation can be discerned a few hours before and after the M5.3 flare. It then became harder to trace until at 16:00 UT, 6 hours before the X2.1 flare, when two magnetic tongues (c.f., Schmieder et al. 2007) formed, providing excellent tracer to the rotation. We focus our analysis in this 6-hour period to examine the role of sunspot rotation in the onset of the eruption associated with the X2.1 flare.
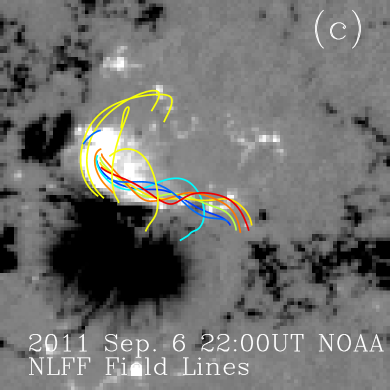
It is important to understand the topology of the coronal magnetic structure and how important the rotation in the coronal energy accumulation process. To achieve this, we reconstructed the three-dimensional (3D) coronal magnetic field using the nonlinear force-free field (NLFFF) extrapolation method developed by Wiegelmann (2004) and (Wiegelmann et al. 2006) on the basis of HMI data. Details of the method are presented in the Appendix.
3 Results and interpretation
The X2.1 flare started at 22:12 UT, peaked at 22:20 UT, and ended at 22:50 UT according to the GOES x-ray (1-8 Å) light curve shown in Figure 2. The pre-flare (22:06 UT) and flare-peaking (22:20 UT) images observed in the 94 Å bandpass have been shown in panels c and d of Figure 1 and the accompanying animation. The pre-flare hot structures exhibited an arcade connecting the northern and southern ends of the eruptive structure, two sets of arcade loops of different size, and highly twisted structures at the north-west part of the image. The large bright area in the post-flare 94 Å image indicates a strong heating there.
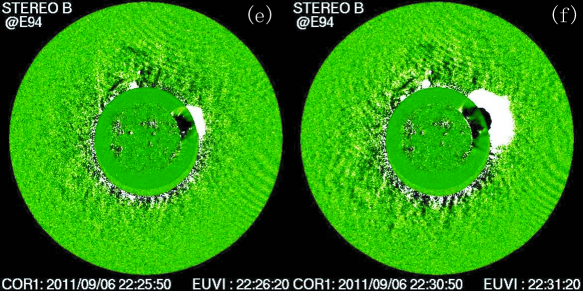
The flare was accompanied by a halo CME travelling at a linear speed of 575 km according to the CDAW (Coordinated Data Analysis Workshops) catalog of the LASCO data (Brueckner et al. 1995). The eruption was also observed with the STEREO spacecraft (Howard et al. 2008) as a limb event. Panels e and f of Figure 1 present two subsequent images at 22:26 UT and 22:31 UT observed by COR1 and EUVI aboard STEREO-B. We see that the CME front moved 0.5 R within 5 minutes yielding a speed of 1200 km s-1, much faster than that measured with LASCO. This is mainly due to the projection effect and the CME deceleration during its propagation to the outer corona.
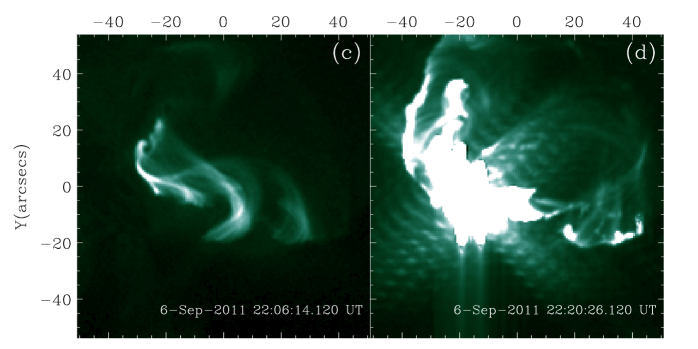
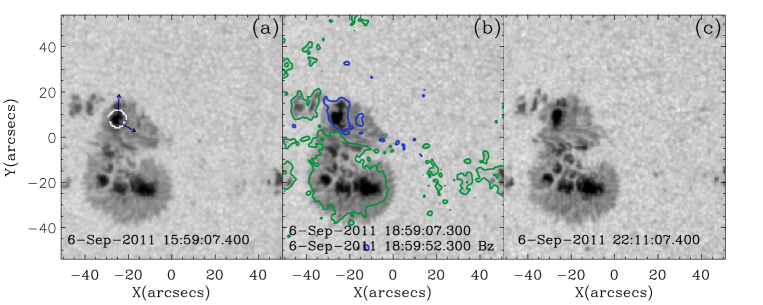
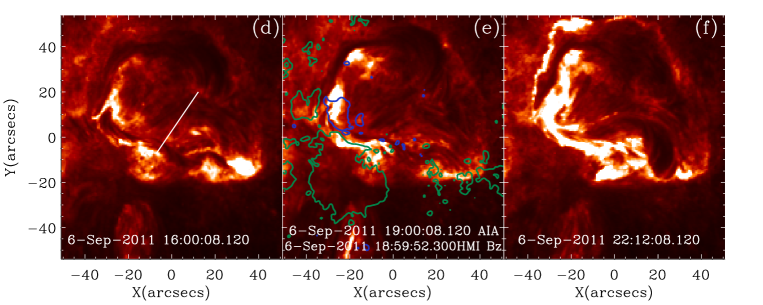
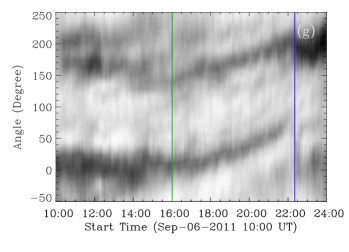
Figure 3 presents sequences of the sunspot (a-c) and the filament (d-f) morphological evolutions. The contours in panels b and e represent the 350 G level of at 19:00 UT. We can see from this figure and the online animation that the dominant motion in this period was the sunspot rotation. The sunspot developed co-rotating magnetic tongues at 16:00 UT on September 6. This allows a quantitative determination of the rotation rate. To do this, we present in Figure 3g the time-slice plot of the sunspot for the time range of 10:00 UT to 24:00 UT. The plot was produced by retrieving images along two semi-circular slices with a radius of 3.5′′ and 3′′ around the sunspot center (which is in motion), and stack them over time. The is along the northward (upward) direction. The angle increases in the clockwise direction. We use two slices so that we can examine both tongues simultaneously.
The plot reveals features consistent with the above description of the sunspot rotation. We can see that the sunspot rotated by 60∘ in the 6 hours prior to the flare, with an average rotation rate 10∘ per hour. After the flare (peaking time shown by the blue vertical line), the sunspot experienced a sudden morphological change and the rotation became hard to track. In comparison with events reported earlier (e.g., Zhang et al. 2007; Yan et al. 2012), our event can be regarded as a fast rotation one. Along with the rotation, the sunspot center moved westward by 2′′ in the 6 hours. Comparing to the fast rotation, the shearing motion seems to be insignificant, which is therefore presumed to play a less important role in the onset of the eruption.
From panels d-f of Figure 3, the entire filament structure exhibited a highly curved pattern with two segments. The southern and the northern segments were disconnected from each other at both ends. The southern filament erupted first which was followed by the eruption of the northern filament. In this study, we focus only on the southern filament. It presented a highly-curved sigmoidal morphology. Since its northern end was mostly rooted in the sunspot penumbra region, we suggest that the sunspot rotation was directly related to the dynamics of this filament.
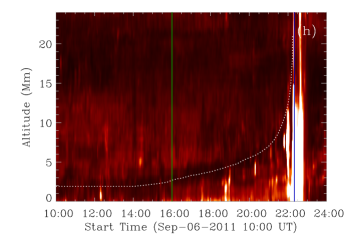
There were clear filament morphological changes during the 6-hour period. According to Figure 3 and the accompanying online animation, the filament exhibited separated filamentary structures which seem to be twisted around each other. The filament became more bulging after 20:00 UT. At 22:00 UT, the filament already started to rise rapidly before the start of the flare (22:12 UT). The filament motion can be viewed from the time-slice plot shown in panel h. The slice is drawn in panel d as a white line. The white-dotted line in panel h is drawn to indicate the moving filament. As can be seen, the motion of the filament along the slice was hardly measurable before 16:00 UT, and was clear from 16:00 UT to 21:00 UT, during which it moved a distance of 5 Mm (7′′).
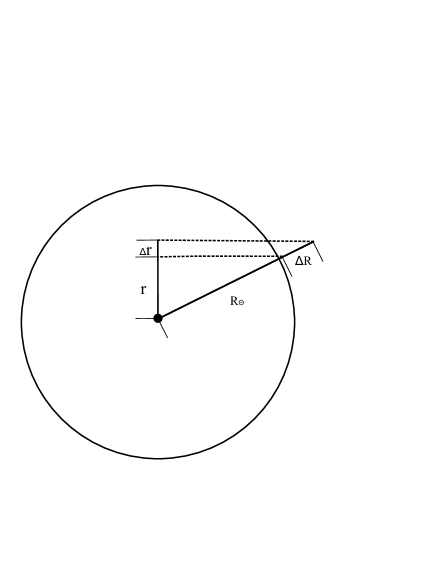
It has to be noted that the above measured moving distance consists of contributions from both the radial (or vertical) and horizontal motions of the filament, and it is generally difficult to disentangle them due to the projection effect. Nevertheless, we can estimate the maximum rising distance of the filament by assuming a pure radial motion. With this assumption, the deprojected motion () of the filament can be given by , where and are the filament moving distance and the distance from the filament center to the solar center as measured in the projection plane. The real distance from the filament to the solar center is approximated by the solar radius assuming that the initial filament height is negligible comparing to the solar radius. A schematic showing the relationship between these parameters is shown in Figure 4. According to the AIA data, we have at 16:00 UT and . This leads to a maximum rising height of .
In the pre-event process, several temporary and persistent brightening structures were observed in the 94 Å bandpass (see the animation accompanying Figure 1), indicating the existence of reconnections. These reconnections can release part of the accumulated energy and affect the dynamics and morphology of the filament.
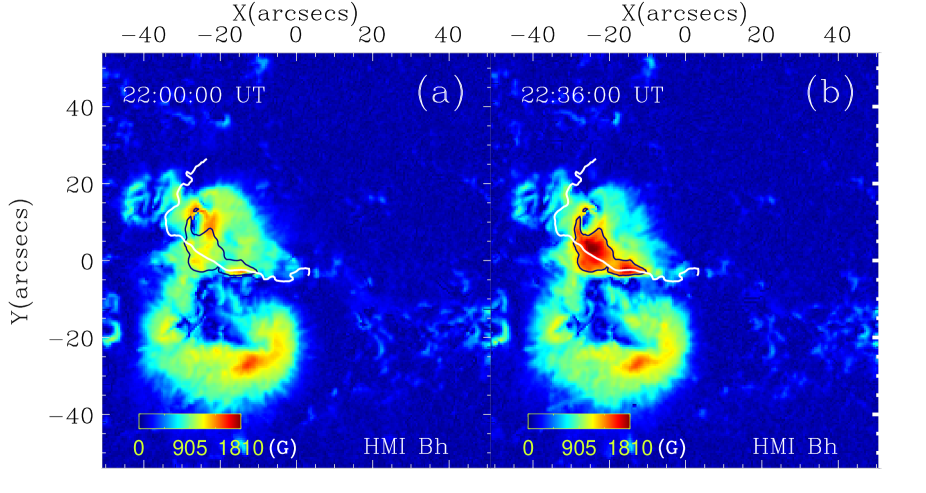
To further explore the details of magnetic field evolution, we display the distributions of at 22:00 UT (panel a) and 22:36 UT (panel b) in Figure 5. It can be seen that increased rapidly after the flare, in agreement with previous studies (e.g., Wang et al. 1994, 2010; Liu et al. 2012; Wang et al. 2012; Sun et al. 2012). The post-flare contour observed at 22:36 UT at a level of 1250 G is plotted in both panels, outlining the major region of the flare-induced enhancement, which is referred to as region R hereafter. It can be seen that region R is underneath the filament and across the PIL. In this study, we focus on the variation of the pre-flare photospheric field in the above region defined by the post-flare enhancement. Note that magnetic field measurement during flare time (within 30 minutes in general) is less accurate than before and after the flare (e.g., Qiu & Gary, 2003).
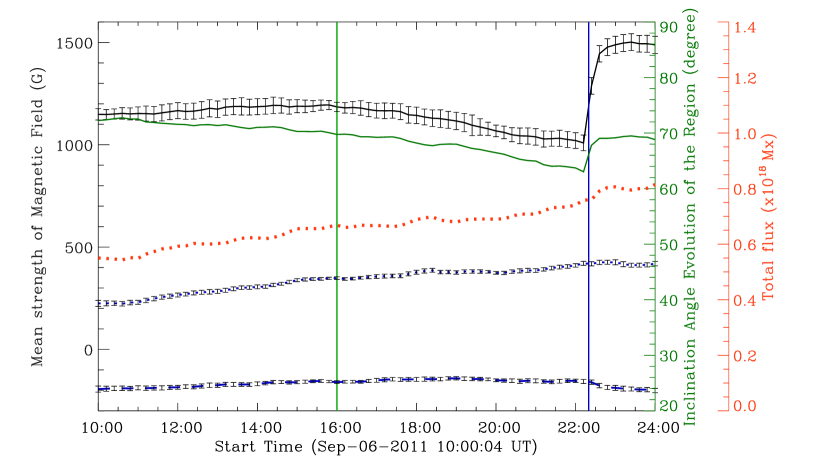
The temporal evolutions of the average and the positive and negative in R are plotted in Figure 6, as the black-solid, blue-dotted, and dashed lines, respectively. The error bars of the and data shown in this figure are given by where is the standard deviation of the HMI data obtained from a nearby quiet-sun region. Also plotted are the inclination angle of the vector photospheric magnetic field () (i.e., the angle between the local vertical direction and the vector magnetic field) in green and the total flux in red-dotted.
It can be seen that before the sudden changes of and , there were gradual but steady decreases of both quantities. This trend was especially clear during the 6-hour period between 16:00 UT and 22:00 UT. Indeed, the average decreased consistently by 15% from about 1185 G at 16:00 UT to 1009 G at 22:12 UT. In comparison, both the absolute value and variation of were much smaller than that of during the 6 hours before the flare. The positive increased from 350 G to 410 G, while the negative one changed from 160 G to 153 G during the same period. The total flux (the red dotted line) presented a slow yet steady increase with no apparent change of increasing rate during the period of sunspot rotation (i.e., after 16:00 UT). On the other hand, the average changed persistently from 70∘ to 63∘ during the 6 hours of sunspot rotation. This suggests that the relevant magnetic structures became more vertical. The total magnetic field strength (not shown here) decreases gradually in a manner similar to that of since is much stronger than . It is expected that when a magnetic structure rises into the corona it will expand into a larger volume. This will result in a decrease of both the total and the horizontal magnetic field strength, consistent with our observation.
Selected field lines of NLFFF reconstructions are shown in Figures 5c and 5d. The location of the low-lying twisted magnetic structure, i.e., a flux rope structure, co-aligned with the southern filament. Note that the magnetic topology of this event was also reconstructed and studied by Jiang & Feng (2013), Jiang et al. (2013a, 2013b), and Feng et al. (2013). They have presented similar reconstruction results as shown here. We can see that these field lines and some overlying magnetic arcades were rooted in the rotating sunspot, agreeing with the observation shown in Figure 3. Thus, the sunspot rotation may affect both the twisted filament-flux rope structure and the overlying arcade. After the flare, the field lines in the filament location became shorter and less twisted indicating a relaxed energy state.
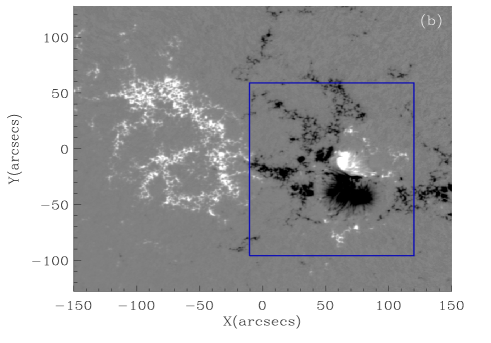
We plot in Figure 7(a) the temporal profile of the total energy of the reconstructed magnetic field in a sub-volume with a bottom shown as the blue square in Figure 7(b) and the same height as that used for the NLFFF reconstruction. The sub-domain is selected to focus on the smaller region of eruption. An estimate of the total magnetic energy in the whole reconstruction domain yields a very similar profile. We see that the total magnetic energy in this sub-domain shows a rapid increase after 16:00 UT, which is the starting time of the apparent sunspot rotation, and an abrupt decline during the flare. The energy increase from 16:00 UT to 22:00 UT is about 3 erg, which is capable of energizing a major solar event (e.g., Vourlidas et al., 2002) and therefore probably important to the onset of the following eruption. This indicates that the sunspot rotation, which is a major dynamical feature of the active region, is important to the pre-eruption energy storage in the corona. A detailed study on the energetics of this event, including the estimates of the free magnetic energy before and after the eruption, the thermal and nonthermal energies for the flare, the CME kinetic and potential energies, as well as the partition of the released magnetic energy between the CME and the flare, has been presented by Feng et al. (2013). They show that the flare and the CME may have consumed a similar amount of magnetic free energy within the estimate uncertainty.
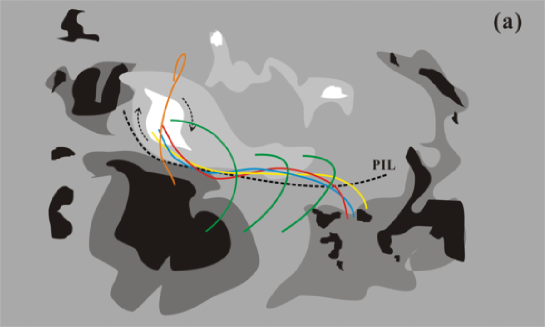
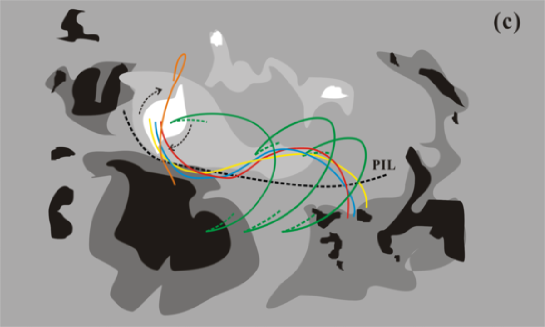
One likely driving mechanism of the eruption in our event is illustrated in the schematics shown in Figure 8. The white structure with two extending tongues indicates the rotating sunspot with the rotating direction denoted by the arrows. The long twisted field lines along the PIL represent the magnetic structure associated with the filament, representing the filament-carrying flux rope structure whose chirality is consistent with the direction of sunspot rotation. The flux rope and a part of the overlying arcades are rooted in the rotating sunspot. Thus, the sunspot rotation can directly transport energy and helicity into the coronal flux rope system. Trk et al. (2013) proposed a novel mechanism for CME eruption induced by the expansion of the overlying arcades that are rooted in a rotating sunspot. Our study provides observational evidences supporting their scenario. Note that our observations show that both the flux rope-filament structure and the overlying arcades were twisted by the rotation of the sunspot. Both twistings may play a role in driving the eruption in our event, and it is not possible to disentangle them. From Figure 8a to 8c, the sunspot rotates about 60∘, as indicated by the locations of the two tongues. Correspondingly, the central part of the twisted field lines expands and moves higher and the overlying arcades become more vertical. These features agree with the observations of the filament rising and the gradual decreases of both the horizontal component and the inclination angle of the photospheric magnetic field. In short, the observational features in our event can be understood with a flux rope CME driven by a persistent sunspot rotation, as schematically illustrated here.
4 Summary
We present observations of a sunspot rotation before a major solar event consisting of a fast CME, an X2.1 flare, and a filament eruption. We suggest that this pre-eruption rotation is not only transporting energy to the corona, but also playing a dynamic and critical role in leading to the eruption. Our suggestion is based on the data analysis results, which are summarized below. Firstly, the sunspot rotation was the dominant motion in the 6 hours before the flare. The rotation rate was 10∘ per hour, considerably faster than some previous observations (e.g., Zhang, Liu, & Zhang 2008). Secondly, the filament and part of the overlying arcades were rooted in the rotating sunspot, and the filament exhibited an apparent gradual rising motion along with the sunspot rotation. This provides a possible dynamical link between the sunspot rotation and the filament dynamics as well as the resultant eruption. Thirdly, the evolutions of both the photospheric horizontal field and the magnetic field inclination angle agree with the gradual rising of the magnetic structure that supports the filament. Last, using the NLFFF method of coronal magnetic field reconstructions, we find the presence of a well-developed twisted flux rope structure associated with the filament and a considerable amount of magnetic energy increase during the sunspot rotation period. These results highlight the importance of sunspot rotation to the energy storage and the onset of the eruption.
The evolution of photospheric magnetic field is essential to both the energy build-up and the triggering of a solar eruption. Many studies have focused on rapid changes of induced by the flare (e.g., Wang et al. 1994, 2010; Liu et al. 2012; Wang et al. 2012). However, the detailed pre-flare evolution of this field component has not received sufficient attention. Such evolution would carry important information of the energy storage and eruption onset process. In our study, we found that in the area underneath the filament decreased gradually in hours before the flare. This is related to the gradual ascending of the filament-flux rope structure. Our analysis indicates that this is associated with the rapid sunspot rotation. On the contrary, studies of another active region (AR11158) revealed that there increased gradually in a similar time period prior to the flare (Liu et al. 2012; Wang et al. 2012). Those studies deduced that the corresponding eruptions were driven by tether-cutting reconnection (Moore et al. 2001) of two approaching magnetic loops. The pre-flare footpoint separation of these loops can explain the gradual increase of . By comparing the different behavior of and corresponding understanding of the eruption mechanism, we suggest that the pre-flare variation of can be taken as a clue to discern the eruption mechanism: A gradual decrease of may be a precursor for an eruption in terms of the flux rope instability, while an increase of may be the precursor for tether-cutting reconnection. This needs further clarifications in future studies.
Appendix A NLFFF extrapolation method of the coronal magnetic field
The coronal magnetic field was reconstructed using the extrapolation method developed by Wiegelmann (2004). The code of the method was provided by Thomas Wiegelmann. The HMI magnetograms were preprocessed to remove most of the net Lorentz force and torque from the data so as to be more consistent with the force-free assumption (Wiegelmann et al. 2006). The extrapolation was performed using 22 rebinned magnetograms within a box of 217185145 Mm3 at the 12 minute cadence. The corresponding grid number is taken to be 300256200 with a uniform spacing of 1.0′′.
The method employs a weighted optimization approach which minimizes a joint measure for the Lorentz force density and the divergence of the field throughout the computational domain (Wheatland et al. 2000), which is represented by the optimization integral . The performance of the method is further evaluated by calculating the average dimensionless field divergence and the current-weighted average of (CWsin) where is the angle between the vector magnetic field B and the current density J () (c.f., Schrijver et al. 2006, 2008; Metcalf et al. 2008; DeRosa et al. 2009). The optimization measure is defined as
where the angle bracket denotes the mean value within the domain, the first and second parts of represent a measure of the mean Lorentz force density () and the mean field divergence (), respectively. Both and are position dependent to reduce the effect of boundary conditions. They are fixed to be 1.0 in the center of the computational domain and drop to 0 monotonically with a cosine profile in a buffer boundary region that consists of 32 grid points toward the side and top boundaries. It is found that the optimization measure decreases from an initial value of 109.6 to a final value of 11.5, while the field divergence measure decreases from 47.4 to 4.0, and the Lorentz force measure decreases from 62.2 to 7.5, in units of G2 arcsec-2. These values of the optimization measure are comparable to previously reported values for other events (e.g., Schrijver et al., 2008; Sun et al., 2012).
The code checks whether after each time step. If the condition is not fulfilled, the time step is reduced by a factor of 2 and the iteration step is repeated. After each successful iteration step is increased by a factor of 1.01. This allows to become as large as possible while satisfying the stability condition. The iteration stops if the condition is satisfied for 100 consecutive iteration steps.
The current weighted average of is defined as
and the pointwise average of the divergence is defined by
where represents the grid point and is the grid spacing (c.f., Schrijver et al. 2006, 2008; Metcalf et al. 2008; DeRosa et al. 2009). For the final reconstruction results, we find that the mean CWsin varies in a range of 0.33 - 0.41 with an average of 0.36, and the average field divergence varies in between 0.00072 and 0.00091 with a mean value of 0.00082.
We acknowledge that there exist other parallel NLFFF codes that have been broadly used or evaluated by solar physics researchers (e.g., Schrijver et al. 2006; Metcalf et al. 2008; Schrijver et al. 2008; DeRosa et al. 2009). Given the limitation of both the NLFFF algorithm and the vector magnetic field measurements, the reconstruction results should be assessed with caution.


References
- (1) Amari, T., Luciani, J. F., Aly, J. J., Tagger, M. 1996, ApJL, 466, L39
- (2) Barnes, C. W. & Sturrock, P. A. 1972, ApJ, 174, 659
- (3) Berger, M. A., Field, G. B. 1984, J. Fluid Mech. 147, 133
- (4) Brown, D. S., Nightingale, R. W., Alexander, D., Schrijver, C. J., Metcalf, T. R., Shine, R. A., et al.: 2003, Solar Phys. 216, 79
- (5) Brueckner, G. E., Howard, R. A., Koomen, M. J., et al. 1995, Solar Physics, 162, 357
- (6) Calabretta, M. R., & Greisen, E. W. 2002, A&A, 395, 1077
- (7) DeRosa, M. L., et al. 2009, ApJ, 696, 1780
- (8) Ding, Y. J., Zhang, B. R., Li, W. B., Hong, Q. F., Li, Z. K. 1977, Chinese Astronomy, 1, 131.
- (9) Ding, Y. J., Wang, H. Z., Hong, Q. F. 1981, Acta Astrophysica Sinica, 1, 264
- (10) Evershed, J. 1910, MNRAS, 70, 217
- (11) Feng, L., Wiegelmann, T., Su, Y., Inhester, B., Li, Y. P., Sun, X. D., Gan, W. Q. 2013, ApJ, 765, 37
- (12) Forbes,T. G. 2000, JGR, 105, 153
- (13) Gary, G. A., & Hagyard, M. J. 1990, Sol. Phys., 126, 21
- (14) Howard, R. A., Moses, J. D., Vourlidas, A., et al. 2008, Space Science Reviews, 136, 67
- (15) Jiang, Y., Zheng, R., Yang, J., Hong, J., Yi, B., Yang, D. 2012, ApJ, 744, 50
- (16) Jiang, C. W., Feng, X. S., Wu, S. T., & Hu, Q. 2013, ApJL, 771, l30
- (17) Jiang, C. W., & Feng, X. S. 2013a, ApJ, 769, 144
- (18) Jiang, C. W., Wu, S. T., Feng, X. S., Hu, Q., Jiang, C. W., 2013b, ApJ, arXiv: 1310.8196
- (19) Kazachenko, M. D., Canfield, R. C., Longcope, D. W., Qiu, J., DesJardins, D. W. & Nightingale, R. W. 2009, ApJ, 704, 1146
- (20) Lemen, J. R., Title, A. M., Akin, D. J., Boerner, P. F., & et al. 2012, Solar Phys., 275, 17
- (21) Liu, C., Deng, N., Liu, R., Lee, J. W., Wiegelmann, T., Jing, J., Xu, Y., Wang, S., & Wang, H. M. 2012, ApJ, 745, L4
- (22) Low, B. C. 2001, JGR, 70, 217
- (23) Metcalf, T. R., et al. 2008, Sol. Phys., 247, 269
- (24) Moore, R. L., Sterling, A. C., Hudson, H. S., & Lemen, J. R. 2001, ApJ, 552, 833
- (25) Pevtsov, A. A., Maleev, Y. M., Longcope, D. W. 2003, ApJ, 593, 1217
- (26) Qiu, J. and Gary, D. E. 2003, ApJ, 599, 615
- (27) Rgnier, S., & Canfield, R. C. 2006, A&A, 451, 319
- (28) Schmieder, B., Pariat, E. 2007, Scholarpedia, 2(12), 433
- (29) Schrijver, C. J., et al. 2006, Sol. Phys., 235, 161
- (30) Schrijver, C. J., et al. 2008, ApJ, 675, 1637
- (31) Schou, J., Scherrer, P. H., Bush, R. I., Wachter, R., et al. 2012, Solar Phys., 275, 229
- (32) Stenflo, J. O. 1969, Sol. Phys., 8, 115
- (33) Sun, X. D., Hoeksema1, J. T., Liu, Y., Wiegelmann, T., Hayashi, K., Chen, Q. R., & Thalmann, J. L. 2012, ApJ, 748, 77
- (34) Su, J. T., Liu, Y., Zhang, H. Q., Mao, X. J., Zhang, Y., He, H., 2010, ApJ, 710, 170
- (35) Thompson, W. T. 2006, A&A, 449, 791
- (36) Tokman, M., Bellan, P. M. 2002, ApJ, 567, 1202
- (37) Trk, T., Kliem, B. 2003, A&A, 406, 1043
- (38) Trk, T., Temmer, M., Valori, G., Veronig, A. M., van Driel-Gesztelyi, L., Vrnak, B. 2013, Solar Phys., 286, 453
- (39) Valori, G., Dmoulin, P., Pariat, E., Masson, S. 2013, A&A, 553, 38
- (40) Vemareddy, P., Ambastha1, A., & Maurya, R. A. 2012, ApJ, 761, 60
- (41) Vourlidas, A., Buzasi, D., Howard, R. A., & Esfandiari, E. 2002, in Solar Variability: From Core to Outer Frontiers, ed. J. Kuijpers (ESA SP-506; Noordwijk: ESA), 91
- (42) Wang, H. M., Ewell, M. W.,Jr., & Zirin, H. 1994, ApJ, 424, 436
- (43) Wang, H. M., Liu, C. 2010, ApJ, 716, L195
- (44) Wang, S., Liu, C., Liu, R., Deng, N., Liu, Y., & Wang, H. M. 2012, ApJ, 745, L17
- (45) Wheatland, M. S., Sturrock, P. A., & Roumeliotis, G. 2000, ApJ, 540, 1150
- (46) Wiegelmann, T. 2004, Sol. Phys., 219, 87
- (47) Wiegelmann, T., Inhester, B., & Sakurai, T. 2006, Sol. Phys., 233, 215
- (48) Yan, X. L., & Qu, Z. Q. 2007, A&A, 468, 1083
- (49) Yan, X. L., Qu, Z. Q., & Kong, D. F. 2008a, MNRAS, 391, 1887
- (50) Yan, X. L., Qu, Z. Q., & Xu, C. L. 2008b, ApJ, 682, L65
- (51) Yan, X. L., Qu, Z. Q., Xu, C. L., Xue, Z. K., & Kong, D. F. 2009, Res. Astron. Astrophys., 9, 596
- (52) Yan, X. L., Qu, Z. Q., Kong, D. F., Xu, C. L. 2012, ApJ, 754, 16
- (53) Zhang, J., Li, L., Song, Q. 2007, ApJL, 662, L35
- (54) Zhang, Y., Liu, J., Zhang, H. 2008, Solar Phys., 247, 39