Simulations of the COMET veto counter
Abstract
A computer model of a scintillator strip veto counter was built in order to verify the efficiency of the cosmic muon veto for the COMET experiment. To tune the model, experimentally measured data were utilized. Three different geometrical configuration of the counter were considered. For one of the configurations the simulation gave the inefficiency of the cosmic muon registration being below 0.0001, which meets requirements of the experiment.
1 Introduction
In the COMET experiment the cosmic background should be carefully eliminated because of tiny number of signal events expected. Veto at a cosmic muon propagation can be effectively managed with scintillator strip plates surrounding the COMET detector [1]. Similar strip plates are used in the Belle II detector where the scintillator light is collected through Kuraray WLS fibers to Hamamatsu silicon photodetectors MPPC. Properties of such a detecting system as well as the radiation hardness of MPPC are studied well enough to date [2, 3]. The aim of this study is a computer simulation of inefficiency of the veto counter designed for the COMET. The desirable value of the inefficiency is as small as 0.0001 [1], which can be achieved using a coincident signal of any two from four strip plates in a stack [3, 4].
2 The model
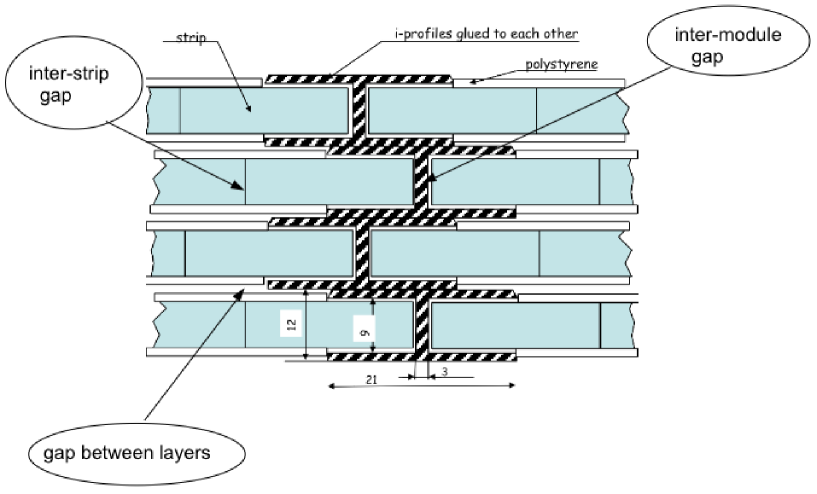
In this study we only model a horizontal slab of the COMET veto counter whereas there will be four side slabs also [4]. Modeling of those vertical slabs is straightforward and probably gives lower inefficiency due to longer average muon range. The ionization produced by muon in a scintillator strip is proportional to its range in the strip, hence the signal of muon depends on its entrance position and direction as well as on the size of inactive zones of detector. A layer of the COMET veto counter consists of scintillator strips of 40 mm width and 7 mm thickness. Surfaces of strips are chemically processed to provide a diffuse reflection of the scintillator light. Processing adds 0.2 mm to the strip width on average. Besides, we suppose additional 0.1 mm separation of strips because of imperfect geometry, so two neighboring strips are separated by a 0.3 mm inactive zone.
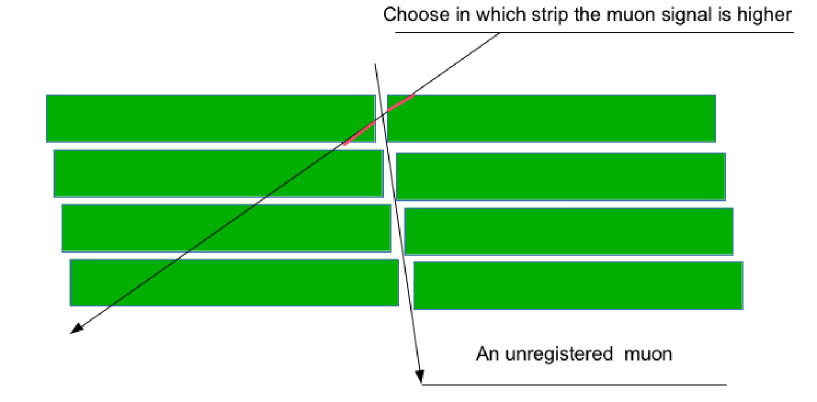
Similar to the Belle II strip modules, two neighboring modules are separated by an aluminum holder of 5 mm width, which also is an inactive zone. This wide zone is particularly harmful for muon registration because its width is comparable with an average cosmic muon range in 7 mm thick strips, so the muon signal can vanish. To increase the range/signal, both inter-strip and inter-module inactive zones of different layers should be shifted w.r.t. each other, cf. fig. 1.
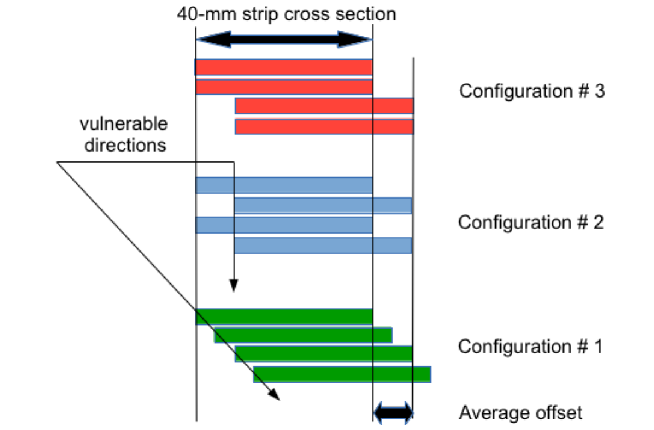
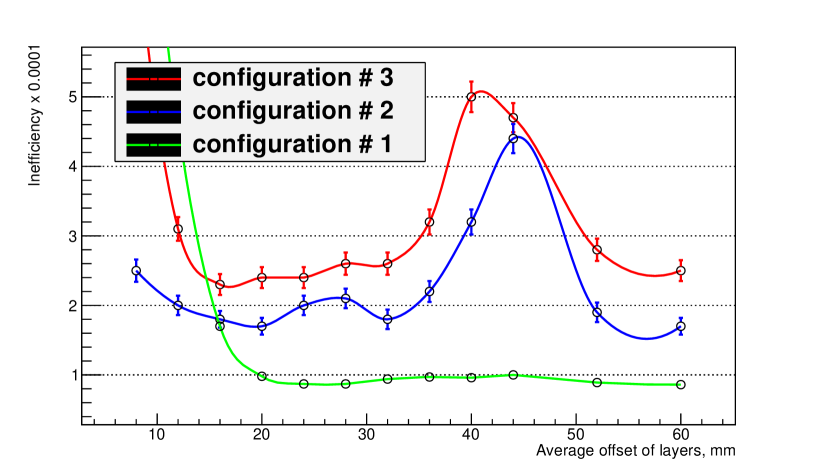
Our simulations were done for a single COMET layer as well as for a complete stack of four layers for three configurations sketched in fig. 2. In the first one each subsequent layer is shifted w.r.t. the previous one at the chosen distance in the same transverse direction. In the second configuration the second and the fourth layers are shifted w.r.t. others at the same distance doubled. Finally in the third configuration the third and the fourth layers are shifted w.r.t. others at the same distance doubled. Thus in the latter two configurations the offset of layers coincides with an average offset in the the first configuration.
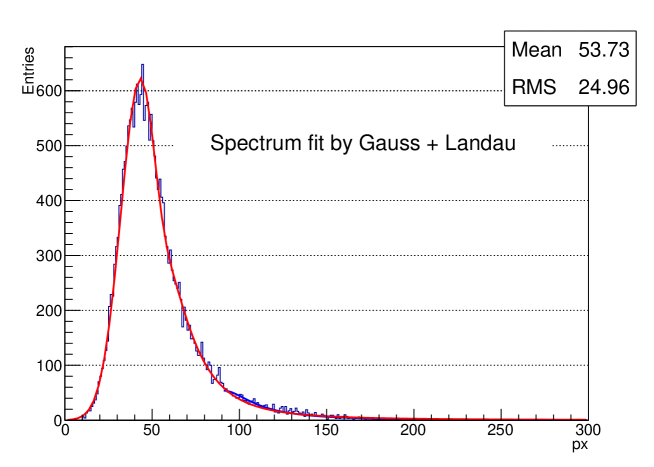
On its way from a muon entrance point to the MPPC the collected scintillator light is significantly attenuated. To take into account the attenuation, experimentally measured spectra were used. The spectra were available for three different locations on 2218 mm strips: in the close part, where a MPPC is set, in the middle and in the rear part of strip, see an example in fig. 3.
2.1 The algorithm
The inefficiency of the four-layer stack was calculated as a fraction of muons whose signal was below a threshold at least in three layers.222Alternatively, one can merely count events where the signal in two layers was above the threshold. We have chosen the former approach to write down the information about muons unregistered in the three layers for a visual verification. For this study the threshold value was chosen 11 photo-detector’s pixels, which is a possible level of noise signals after a long exposition of MPPC to a neutron background of the experiment, cf. section 3.2. The signal of simulated muon in a strip was obtained ascribing to each particle an experimentally known signal attenuated and then corrected according to the muon range for given entrance position and direction. To compute the signal, a random number according to a spectrum was taken after the spectrum was interpolated to the entrance position of muon and then scaled proportionally to the range of given muon in the strip.
Thus the simulation of each event consisted of the following steps:
-
•
generating random entrance point of muon within a plate of modules;
-
•
generating random polar and random azimuth angles and of muon trajectory according to distribution of cosmic muons;
Next steps were subsequently repeated for each layer until three of them gave signals below the threshold.
-
•
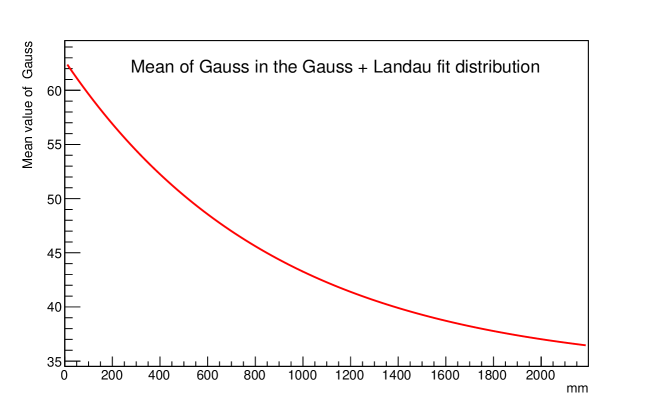
interpolating an experimental spectrum of signals to the entrance point by means of fitting and interpolating fit parameters, see an example in fig. 4;
-
•
calculating the range of muon in a hit strip, as well as in a neighboring one if it is penetrated by muon;
-
•
the longest of the two ranges was used to scale the attenuated spectrum by means of scaling the fit parameters, cf. fig. 5 ;
-
•
comparing a random signal from the spectrum with the threshold value.
2.2 Simplifications
For the sake of transparency of code and time saving, a number of simplifications of the real detector has been done in its model. In our opinion all those simplifications have a minor impact on results of simulation and can therefore be treated more accurately later on. Here is a list of them:
-
•
only four modules of strips were modeled for each layer;
-
•
inactive zones of grooves for the WLS fiber were not modeled;
-
•
crossing of more than two strips of a layer was neglected being both inessential and very rare for the given ratio of strip’s thickness to width;
-
•
a lateral distribution of the light in strips also was not modeled;
-
•
the experimental spectra were considered point-like while they were collected from a length 248 mm;
-
•
the experimental spectra were fitted by a sum of Gauss and Landau distributions rather than by a convolution of the distributions;
-
•
changing spectra with range was done by only scaling fit parameters while one expects widening spectra for small ranges;
-
•
to partially address the latter issue, the Gauss distribution was replaced by the Poisson one in the case of a small range when a standard deviation of Gauss was smaller than a square root from its mean, which typically happened when the mean did not exceed 16 pixels;
- •
A straightforward, without the latter inter-calibration coefficient, simulation of that measurement predicts smaller inefficiency. The introduced coefficient comprises the effects of above simplifications as well as the difference in responses between that measurement and obtaining the spectra at three locations used throughout the simulation.333 In this approach the value of simulated inefficiency must be conservative as the trigger in the inefficiency measurement had an admixture of “empty” events of order.
3 Results
3.1 Inefficiency
Our simulation has shown that in a single COMET layer about one third of unregistered muons went through inter-module inactive zones. Others are not registered due to occasional small signals, predominantly at inter-strip inactive zones in the rear part of strips where the attenuation of light is higher. Because of inactive zones in the COMET layer, an average range of muons contributing to signal amounts 10 mm contrary to 10.5 mm in a continuous layer of scintillator. This takes place under the condition that only the largest of two range parts contributes to the signal in the case when muons crosses an inactive zone. That condition a priori increases the inefficiency of the COMET layer w.r.t. that of the measurement [3] where both parts of range have been used – cf. fig. 6 – even though in that measurement the average range was only 9.8 mm because of its geometry.
As for the complete stack of 4 layers, in the second and the third configurations at the offset 40 mm positions of inter-strip inactive zones of all layers coincide. At the offset about 43 mm the inter-strip inactive zones of two layers appear below/above of inter-module inactive zones of other layers, right on the symmetry line of the zones. Such offsets abruptly increase the inefficiency, cf. fig. 7. The first configuration is apparently preferable because the inter-strip inactive zones (i) do not coincide and (ii) can only be crossed by a muon trajectory at large polar angle where the muon flux is lower. The gap between layers of strips was omitted in the above simulations. One can expect to improve the performance of the that configuration by a sophisticated layout of inactive zones. In the case of completely uncorrelated positions of inactive zones in different layers the inefficiency should reach its low limit equal to four cubic inefficiencies of the single layer.
The muon-stopping target of the COMET detector is the most vulnerable element in the sense of cosmic muon interactions since the resulting electrons could not be geometrically distinguished from signal ones. To address this, for the first configuration of the veto counter separate simulations of the registration inefficiency for muons aimed to the target have been done. The muon-stopping target is located in the central region of the detector beneath the center of the veto counter slab. Therefore it could be only hit by a small fraction of those muons that largely contribute to the registration inefficiency, i.e.coming through the inter-strip and inter-module inactive zones. This makes the inefficiency lower.
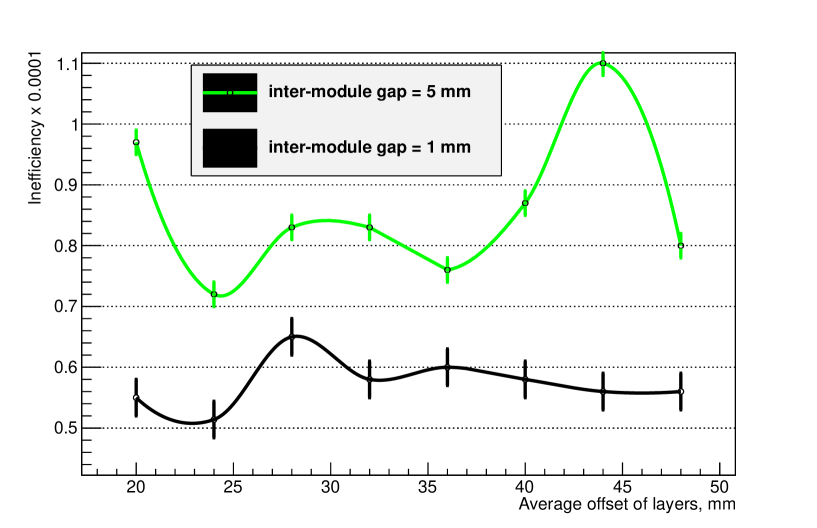
To be more realistic, the constructing gap between layers equal to 3 mm was introduced in the simulations. Those simulations have been done for two different inter-module gaps equal to 5 mm and 1 mm, cf. fig. 8. The smaller inter-module gap corresponds to the case of absence of the aluminum module holder, which is a possible option since, unlike the Belle II detector, the COMET veto counter have no sloping modules to be held. In addition to the 11-pixel threshold, the simulations have been done for the readout thresholds equal to 10, 9, 8, and 7 pixels, which have shown the muon registration inefficiency decreasing by an order of magnitude when the threshold value was reduced by two pixels.
3.2 Noise signals
The MPPC noise signals above the the threshold can fake muon passing, which results in the wasted time of data taking. The reason is the random coincidence of MPPC noise signals that appear in two strips of two layers within resolution time , which could not be distinguished from signals of a real muon in those layers. Veto time windows should be formed around such coincident noise signals. Data from the veto windows should be excluded from the physics analysis, while in fact there was no any cosmic muons. As there is about two hundreds of strips in each layer of the horizontal slab of the veto counter, the frequency of the noise signal in the entire layer equals 200 times the frequency of the noise signal in a single strip .
During data taking that frequency grows with irradiation of photo-detectors by background neutrons that damage the p-n conjunction of silicon photo-detectors [2]. The neutrons are abundantly emitted by nuclei of aluminum of the muon-stopping target after muon capture at the rate Hz. Signals of the background neutrons in the veto counter result also in the loss of data taking time. Fraction of the lost time is determined by the neutron registration efficiency and by neutron fluence at the veto counter. In order to minimize a frequency of neutron signals, the fluence of background neutrons will be constrained to p/cm2 by appropriate shielding. Therefore the irradiation dose received by MPPCs will not exceed p/cm2 throughout full time of COMET data taking.
The frequency of the coincident noise signals in two layers can be evaluated as multiplied by the number of adjacent strips that could be crossed by a muon trajectory in other layers of the veto counter slab. In order to cross underlying COMET detector elements, on which the cosmic muon could interact, the muon trajectory has to be descending, so for all practical purposes is not large: the steeper the trajectory descents, the smaller is.
For instance to cross the muon-stopping target, the -angle of muon trajectory could not exceed about 50° for the counter dimensions quoted in [4]. Taking into account the value of the angle and the ratio of strip’s thickness to width, one can see that after crossing the first layer the trajectories aimed to the target can only cross one of three adjacent strips in the second layer, one of five strips in the third one, and one of seven strips in the fourth one, i.e. . For the same reasons a muon signal in some strip of the second layer can only coincide with a signal from one of adjacent strips of two subsequent layers, similarly a signal in the third layer can coincide with that in three adjacent strips of the fourth layer. Summing up the probabilities for all layers one gets the increasing factor 26, thus the frequency of the fake muon signal is about .
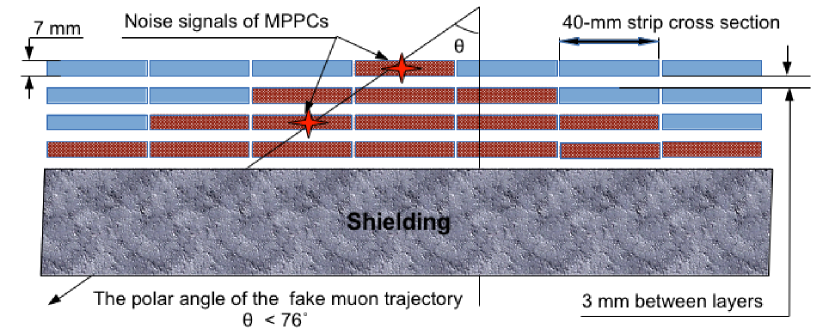
In the general case, when one looks for the coincident signal in adjacent strips of the second layer, and the frequency-increasing factor equals to . For quoted strip dimensions and the 3 mm gap between layers, that minimal value of allows covering of the -angle up to 76°, cf. fig. 9.
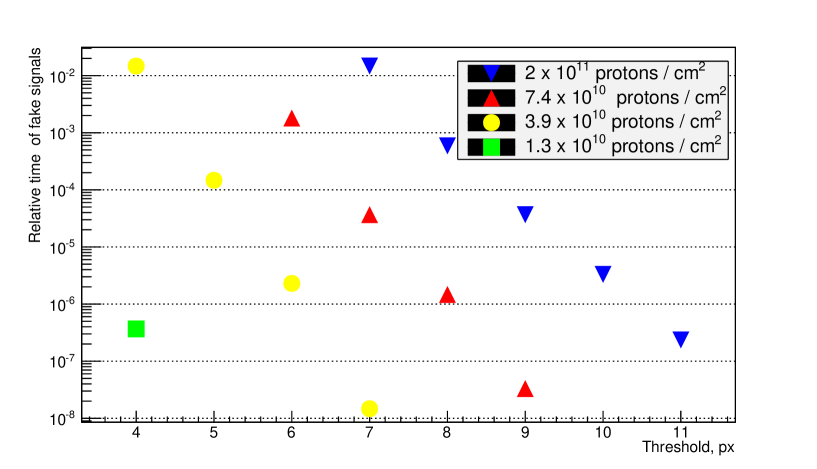
For one covers the region up to 83°of , which is sufficient to survey the whole detector if the latter is separated from the veto counter by 500 mm neutron shielding. The 125 mm distance between the counter and the detector assumes examination of 99 strips covering 88°. Figure 10 shows the fraction of time lost due to fake veto signals versus the readout threshold, for different irradiation doses received by MPPC, and .
4 Conclusion
A simplified computer model of the scintillator strip COMET veto counter demonstrates viability of the counter inefficiency to be 0.0001. It has been shown, that operating at the threshold above seven pixels can keep the fraction of the lost time at the level of few percents. A disadvantage of working at high thresholds is lower muon registration efficiency. However, simulations of the efficiency value has demonstrated that it still meets COMET requirements even at the 11-pixel threshold. On the other hand both the noise frequency and the neutron registration efficiency are lower when operating at high thresholds, which results in a shorter time loss.
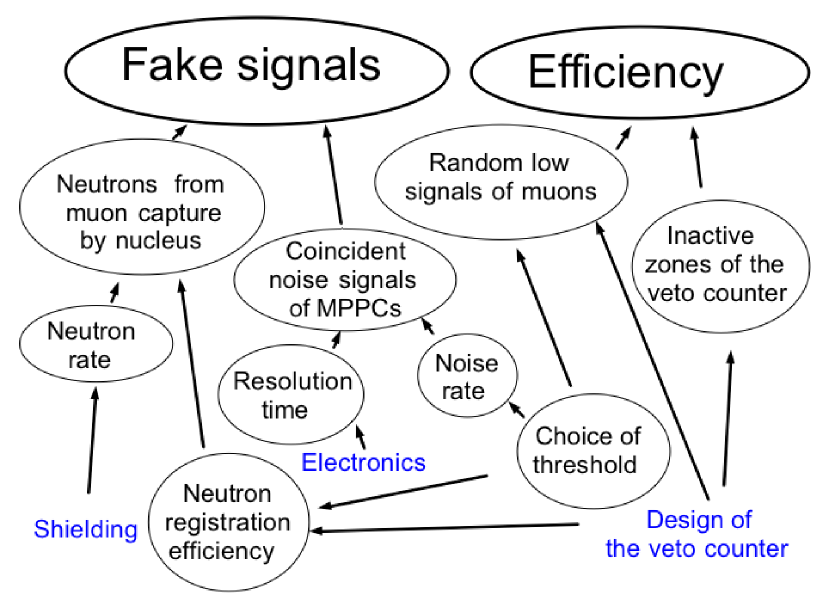
Further work should be done in the two basic directions: (i) building an elaborate model of the veto counter and (ii) optimization of the counter design according to the scheme in fig. 11. We are grateful to B. Bobchenko, A. Drutskoy and V. Rusinov for discussions and help.
References
- [1] The COMET Collaboration, Conceptual Design Report for Experimental Search for Lepton Flavor Violating Conversion at Sensitivity of with a Slow-Extracted Bunched Proton Beam (COMET), J-PARC P21, June 23, 2009
- [2] E. Tarkovsky, Performance of a scintillating strip detector with G-APD readout, Nucl. Instr. Meth. A628 (2011) 372
- [3] E. Tarkovsky, Study of performance of a scintillation strip detector with a SiPM readout as a basic unit for veto system, CM11 at JINR, 30 September – 5 October 2013
- [4] A. Drutskoy, Cosmic veto system basic setup for Phase-I, CM11 at JINR, 30 September – 5 October 2013