Watching the IPv6 Takeoff from an IXP’s Viewpoint
Abstract
The different level of interest in deploying the new Internet address space across network operators has kept IPv6 tardy in its deployment. However, since the last block of IPv4 addresses has been assigned, Internet communities took the concern of the address space scarcity seriously and started to move forward actively. After the successful IPv6 test on 8 June, 2011 (World IPv6 Day [1]), network operators and service/content providers were brought together for preparing the next step of the IPv6 global deployment (World IPv6 Launch on 6 June, 2012 [2]). The main purpose of the event was to permanently enable their IPv6 connectivity.
In this paper, based on the Internet traffic collected from a large European Internet Exchange Point (IXP), we present the status of IPv6 traffic mainly focusing on the periods of the two global IPv6 events. Our results show that IPv6 traffic is responsible for a small fraction such as 0.5 % of the total traffic in the peak period. Nevertheless, we are positively impressed by the facts that the increase of IPv6 traffic/prefixes shows a steep increase and that the application mix of IPv6 traffic starts to imitate the one of IPv4-dominated Internet.
I Introduction
Although designing a new Internet protocol was not the most pressing matter within the Internet community in the beginning of the 1990s, the unforeseen growing speed of the Internet usage had started to cause worries about the exhaustion of the Internet address space. Despite these concerns, the exhaustion of the current Internet address space (IPv4) became inevitable due to the consequence of overstaying in the decision process of the movement to the new Internet address space (IPv6 [3]). Even though the optimistic prediction of the Internet growth was one of the major mistakes made in the beginning of its evolution, Internet pioneers are not to be blamed because it was nearly impossible to expect such a massive success of the Internet at that point in time.
Internet Protocol Version 6 (IPv6) has been developed by the Internet Engineering Task Force (IETF) in 1994 with a view to succeeding the current version of Internet Protocol (IPv4). Besides the expansion of the address space, developers of IPv6 took several demanding features such as the security (based on compliance with IPSec), Quality of Service (QoS, via the prioritization scheme and the non-fragmentation principle), and the extensibility (using the chain header) into the design consideration, while maintaining the simplicity of its predecessor (IPv4). Even with such promising functionalities network operators and software developers were not motivated enough to adopt the new version of the Internet protocol because the current version of the Internet protocol is irreproachable and it was still too early to feel the scarcity of the address space in their bones. Furthermore, it was commonly acknowledged that inequalities of the benefit of and the demand for the new Internet protocol among network operators made it difficult to adopt IPv6 all together.
However, the situation has changed since the last block of the IPv4 addresses has been assigned to the RIRs in mid-2011. Soon after the IPv4 address depletion of the Internet Assigned Numbers Authority (IANA), Asia Pacific Network Information Centre (APNIC) reported that they reached the final stage of the IPv4 exhaustion [4]. After all, major network operators nodded at an implicit agreement that there is no more time to calculate gains and losses. To this end, the Internet Society [5] organized a 24-hour global IPv6 test flight (World IPv6 Day [1]) on 8 June, 2011 and more than a thousand globally influential service providers have participated in the event. As no severe problems have been reported from participants, the community has decided to move a step forward, which is the World IPv6 Launch [2] event held on 6 June, 2012. The World IPv6 Launch event was expected to be an important turning point in the Internet history, because participants agreed to keep their IPv6 connectivity permanently enabled after the event.
In this paper, we study the changes to the IPv6 traffic from the viewpoint of a large European Internet Exchange Point (IXP). We analyze 14 months worth of traffic traces which include the two world IPv6 events.
The remainder of this paper is structured as follows. We first illustrate the vantage point of our measurement and traffic data sets in Section II. The methodology used for conducting our measurement is described in Section III. Then, we show the characteristics of the current IPv6 traffic observed in our measurement in Section IV. After that, we select publicly available reports about the current status of the adoption of IPv6 and summarize them in Section V. We overview the related work in Section VI. Finally, we conclude the paper in Section VII.
II Measurement Environment and Traces
In this section, we give a brief overview of our data sets and describe the vantage point that our data is collected from.
II-A Internet eXchange Point (IXP)
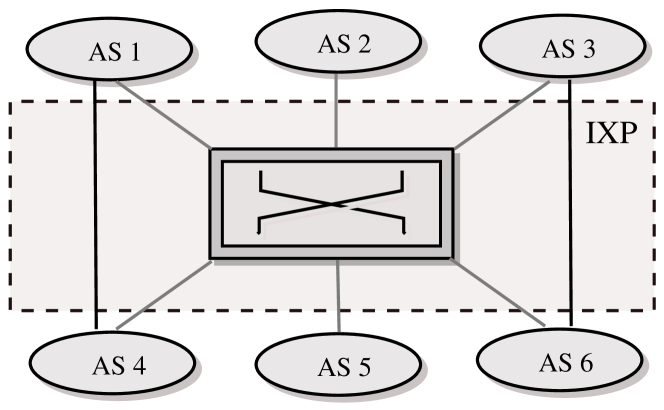
An Internet eXchange Point (IXP) is a physical infrastructure for interconnecting Internet Service Providers (ISPs) and ASes in order to reduce the end-to-end latency and the cost of transit traffic. A simplified topology of an IXP is illustrated in Fig. 1. Through such infrastructures, its member ASes can establish peering (or transit) relationships with other member ASes. The volume of daily network traffic at an IXP depends, amongst other things, on the number of networks connected to the IXP. Our IXP has more than 400 members which makes it one of the largest IXPs in Europe. For a detailed analysis of the IXP ecosystem and the peering behavior of the IXP participants we refer to [6].
II-B Data Sets
| Name | Period | Global IPv6 Event |
|---|---|---|
| IXP11-v6day | Jun. 5, 2011 – Jun. 15, 2011 | World IPv6 Day |
| IXP12-newyear | Dec. 25, 2011 – Jan. 7, 2012 | — |
| IXP12-launch | Jun. 1, 2012 – Jun. 11, 2012 | World IPv6 Launch |
| IXP12-olympics | Aug. 12, 2012 – Aug. 30, 2012 | — |
We base our measurement on four sets of traffic traces (see Table I) collected within the above-mentioned IXP during a time span of 14 months including World IPv6 Day and World IPv6 Launch (54 days of traffic in total). Note that one of our data sets (IXP11-v6day) overlaps the one used in Sarrar et al. [7]. Due to the immense amount of traffic volume, it is considered to be virtually impossible to capture and store all packets. To this end, we collect our data using sFlow, i. e., a network traffic sampling technology designed to provide a scalable monitoring solution with low costs, with the sampling rate of 1:16k. By the reasons of the space constraint and the privacy concern, we only record the first 128 bytes of the sampled packets. However, it is sufficient to include all relevant information that we rely on, e. g., IP headers, tunneling headers, and transport layer protocol headers. A sampled packet is pipelined to the anonymization process before being stored to disk for the purpose of muddling all IP addresses of the packet, while the consistency of an IP address and the size of the network prefix are preserved.
III Methodology
In order to conduct our measurement, we develop an IPv6 traffic analysis tool to which text-formatted information extracted from sFlow traces is fed. Our analysis tool is designed to identify IPv6 packets and to extract relevant information from the identified IPv6 packets.
The tool identifies the transition technology in the current measurement point (IXP) by observing the packet’s IP version field, protocol number, and port numbers. For this, we use the protocol number 41 as a clear indicator of 6in4 [8] technology and the protocol number 17 combined with the UDP port number 3544 as a clear evidence of teredo [9] technology. In the same manner, ayiya [10] technology can be identified by using the protocol number 17 and the UDP port number 5072. However, we do not consider the ayiya transition technology in our study since we observe only the negligible fraction (0.1 %) of IPv6 traffic over ayiya. Indeed, teredo and 6in4 are the only transition technologies carrying a considerable amount of IPv6 traffic.
IV Evaluation
In this section, we evaluate the change in the level of IPv6 deployment with emphasis on the impact of the two past global IPv6 events (World IPv6 Day and World IPv6 Launch). In general, we observe that IPv6 accounts for 0.5 % of the total Internet traffic in the peak period (IXP12-olympics) of our measurement results.
IV-A Quantitative Analysis of IPv6 Traffic
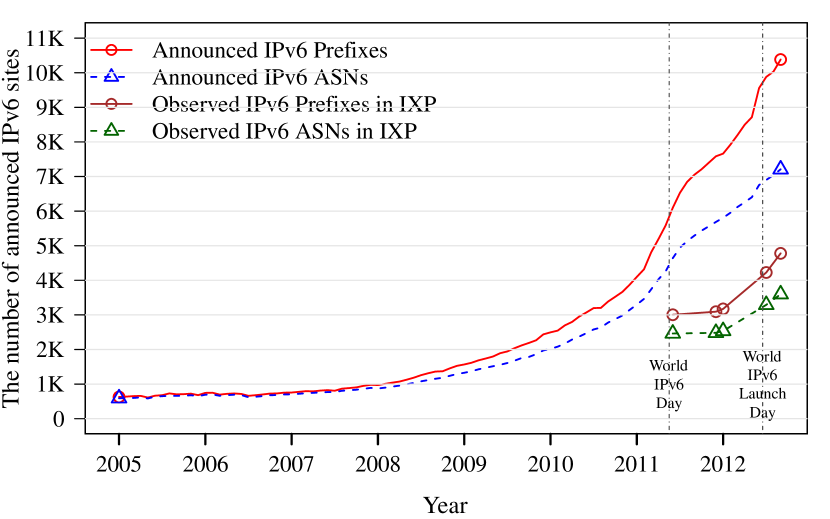
In order to see how the level of IPv6 adoption has been evolving, we download monthly snapshots of the IPv6 routing table from the RouteViews Project [11] and illustrate them in Fig. 2 together with the observed IPv6 prefixes within our data sets. The figure shows the sharp rise in the number of announced IPv6 network prefixes since the World IPv6 Day. More precisely, the number of IPv6 network prefixes announced between the World IPv6 Day period and the World IPv6 Launch period (one year) is almost equivalent to the total number of prefixes evolved during the last two decades. Even though we observe only half of the globally announced IPv6 prefixes at our vantage point, the increasing rate is still significant.
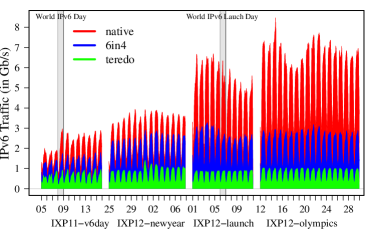
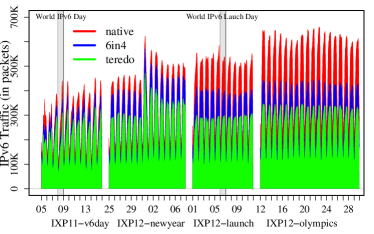
When seeing the change of the IPv6 adoption in the perspective of the traffic volume, the increase of IPv6 traffic is even more drastic than the one shown in the prefix data. As we see in Fig. 3, IPv6 traffic is increased by more than 50 % on the World IPv6 Day. Moreover, the volume of IPv6 traffic is again doubled (approximately from 3Gb/s to 6Gb/s) within the World IPv6 Launch period. The growth of IPv6 traffic is still observed in our latest data set (IXP12-olympics).
The most significant change that we can discover from the figure is that the increase of IPv6 traffic mainly results from native IPv6 traffic. On the World IPv6 Day, we see more than twice the volume of native IPv6 traffic and it does not decrease after the event (even though it was supposed to be a 24-hour test flight). Besides, another multi-fold increase of native IPv6 traffic is experienced in the World IPv6 Launch period.
With regard to the sudden peak of teredo packets observed on 1 January, 2012 (see Fig. 3 (b)), we do not have a clear answer for this phenomenon. However, we are of the strong belief that the cause of this peak is rather due to academic/industrial experiments than due to the participation in the World IPv6 Launch event. This assumption is based on three different observations. First, the number of teredo packets falls back to the normal level in the World IPv6 Launch period. Second, more than 40 % of the total teredo packets within the period are generated from a few IP addresses within the same IP prefix. Third, most of the teredo packets are bubble packets111A teredo bubble is a signaling packet typically used for creating and maintaining a NAT mapping in which there is no actual payload present.
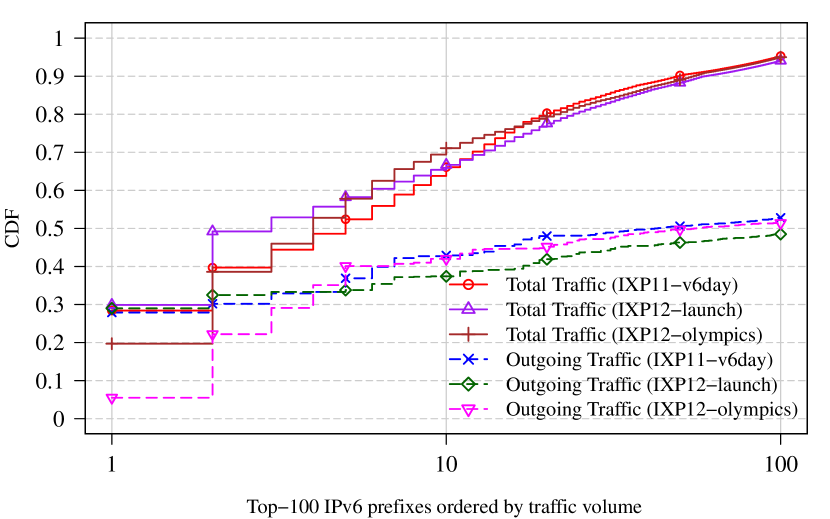
Next, we evaluate how IPv6 traffic is distributed across prefixes. Fig. 4 shows a Cumulative Distribution Function (CDF) of IPv6 traffic contributed by the top-100 IPv6 prefixes. Solid lines in the figure indicate the traffic fraction of the prefix out of the total observed IPv6 traffic, while dashed lines describe only the fraction of outgoing IPv6 traffic. The figure shows that about 1 % (50 prefixes in IXP11-v6day and 60 prefixes in IXP12-launch and IXP12-olympics) of the observed prefixes contribute more than 90 % of the total IPv6 traffic. Moreover, almost 30 % (IXP11-v6day and IXP12-launch) and 20 % (IXP12-olympics) of the total traffic is contributed by a single prefix. Given the fact that almost all traffic of the prefix is outgoing traffic in IXP11-v6day and IXP12-launch, we conclude (and also verify) that the top IPv6 contributor in these periods is a content provider. However, by observing the ratio between incoming traffic and outgoing traffic of the top prefix in IXP12-olympics, it appears likely that the first position in the traffic ranking is now taken by a large transit network. Indeed, by further dataset inspections we confirm the following assumption: The identified transit network is one of the largest IPv6 backbone network in the world.
Yet, readers must note that this evaluation is based on network prefixes. When prefixes are aggregated into the AS level, the content provider (the top IPv6 traffic contributor in IXP11-v6day and IXP12-launch) is still the largest IPv6 traffic contributor in terms of the traffic volume.
IV-B Application Breakdown
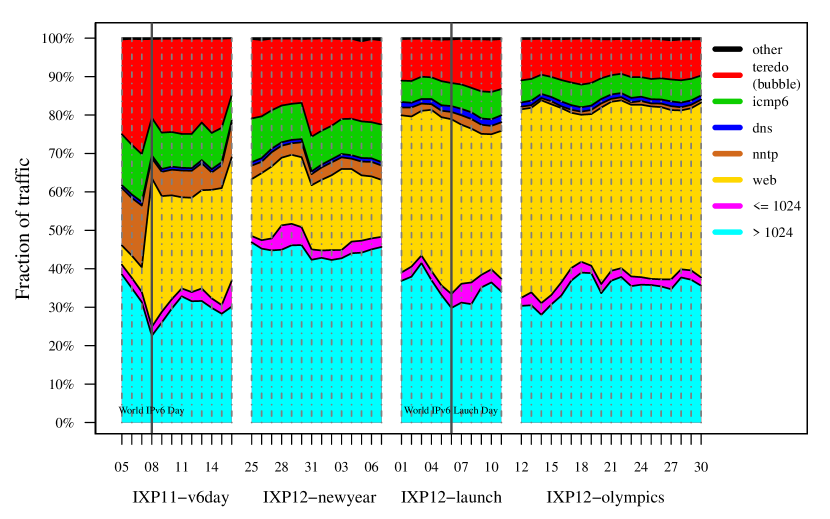
In this section, we provide insights into the application mix in IPv6 traffic. Fig. 5 shows the breakdown of the traffic into applications. Note that the header size of transition technologies is included in the traffic volume. Hence, we see a significant fraction of teredo traffic in the figure even though teredo bubbles222A teredo bubble is a signaling packet typically used for creating and maintaining a NAT mapping do not contain any actual payload.
The first application protocol that we need to pay attention to is the Network News Transport Protocol (NNTP). Even though the significance of NNTP traffic within the IPv6 network decreases drastically as the influence of web traffic increases, it is important to understand its characteristics since NNTP has been the dominant content carrier in the IPv6 world before HTTP became the major protocol and it is still responsible for a considerable fraction of the IPv6 traffic.
NNTP has been considered an obsolete protocol for a while, however recent measurement studies [12] have found that NNTP revives (or survives) from its oblivion. They report that NNTP accounts for up to 5 % of the total residential traffic in today’s Internet.
More surprisingly, Sarrar et al. [7] report that almost 40 % of the total IPv6 traffic is contributed by NNTP before the World IPv6 Day. Our result shows a significantly different fraction (about 20 %) of NNTP traffic in the same period, but this is due to the fact that we consider the header bytes of the transition technologies as part of the application’s traffic volume. When considering only the payload, our evaluation matches the one reported in [7].
The next application protocol that we study is HTTP. As the figure shows, the fraction of web traffic increases remarkably on the World IPv6 Day and it reaches nearly 50 % of the total IPv6 traffic in the World IPv6 Launch period. The change of the traffic shape has a particular meaning since the breakdown of IPv6 traffic into applications becomes similar to the one of today’s IPv4 traffic. Furthermore, the major share of IPv6 traffic is real content rather than signaling traffic. This leads us to the conclusion that service providers start to break away from the fixed idea that IPv6 is a faraway story and become more active in providing Internet access through IPv6 to their home and enterprise customers.
IV-C Native IPv6 Traffic Among ASes
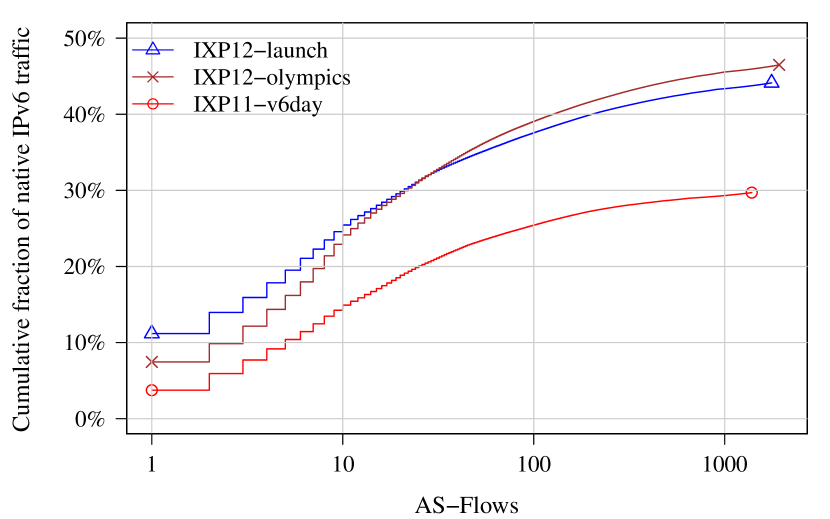
We now investigate how native IPv6 traffic is exchanged among ASes. For this study, we create a traffic matrix with sorted ASes as columns and rows (more than 3,500 ASes). Fig. 6 depicts the cumulative fraction of native IPv6 traffic of AS-flows 333We define an AS-flow as an asymmetric pair of ASes. In the figure, we only consider AS-flows which contribute at least 0.001 % of the total native IPv6 traffic, i. e., 1,386 AS-flows in IXP11-v6day, 1,761 AS-flows in IXP12-launch, and 1,928 AS-flows in IXP12-olympics. The figure describes that the traffic fraction of AS-flows increases remarkably in the World IPv6 Launch period. Interestingly, the amount of IPv6 traffic is largely concentrated in one AS-flow (i. e., the AS-flow numbered as 1 on the x-axis). However, the traffic contribution of this top AS-flow decreases from 11.19 % (IXP12-launch) to 7.46 % (IXP12-olympics), while the traffic share of those in the bottom 98 % of IXP12-olympics outperforms that of IXP12-launch. From this result, we can infer that the IPv6 traffic relationship among ASes slowly changes from a 1-n shape to a n-n shape. This phenomenon is likely related to the rapid growth of the transit network explained in reference to Fig. 4.
Before providing more information of this specific AS-flow, we narrow the scope of our investigation. For doing so, we illustrate the matrix of the native IPv6 traffic fraction among the top-25 ASes in Fig. 7. The cell in the figures are filled with different levels of color depth according to their share in the total native IPv6 traffic. Sums of IPv6 traffic transmitted among these top-25 ASes are 14.86 %, 30.61 %, and 33.50 % in IXP11-v6day, in IXP12-launch, and in IXP12-olympics, respectively. Readers might notice by the intuition that the cell filled with the deepest color in Fig. 7 (b) and Fig. 7 (c), i. e., ones representing the fraction of traffic originating from the AS numbered as 1 (x-axis) and destining for the AS numbered as 2 (y-axis), are corresponding to the largest AS-flow discussed in regard to Fig. 6. Furthermore, we can determine that the AS numbered as 1 is the major source of IPv6 contents. Adding up all native IPv6 traffic generated from this specific AS, we find that 15.21 % (IXP11-v6day), 29.93 % (IXP12-launch), and 17.88 % (IXP12-olympics) originate from that single AS.


From a closer inspection of that AS, we identify that this AS belongs to one of the largest content providers in the world. This might not be an eye-opener for readers because the consumer behavior of Internet contents in the IPv6 world cannot be very different from the one within the IPv4 world. However, we believe that by studying these trends in IPv6 traffic and their core content providers we can help network operators to come up with more effective strategies for implementing IPv6 in their networks.
Readers may still wonder about the identity of the AS in which the most IPv6 traffic from the top content provider is consumed (the AS numbered as 2 in Fig. 7). Regarding the largest AS-flow which is shown in Fig. 6 and is also illustrated as the cell filled with the deepest color in Fig. 7, we reveal that the top IPv6 traffic consumer in our measurement is one of the largest ISPs located in Romania. This is a somewhat unexpected discovery for us since Romania has not engaged any appreciable attentions in the Internet history before. Taking a closer look at the traffic of this specific ISP in the peak period of our IPv6 traffic (IXP12-olympics), approx. 3.02 % of the total native IPv6 traffic is going out from this AS, while about 14.23 % of the total traffic is going into the AS.
V Public Reports on IPv6 Traffic
Various content providers and service providers have been reporting the status of IPv6 traffic shown in their networks. In this section, we select three relevant reports and summarize them in relation to our measurement results.
V-A Google
Google has been collecting the statistics about the IPv6 connectivity of their users and reporting the results since 2008 [13]. They claim that 0.34 % of the total users have accessed their website over IPv6 on the World IPv6 Day and the fraction has increased to 0.65 % on the World IPv6 Launch. Given the fact that Google is the top ranked website in terms of the number of visitors and the traffic volume, these fractions indicate a considerable number of users. Our measurement witnesses that Google is one of the biggest sources of IPv6 traffic.
Another observation they have made is that since March 2010 the fraction of IPv6 users of the native IPv6 technology has overtaken the one of encapsulation technologies, i. e., teredo and 6in4. According to their report, the tendency of the decrease in users of transition technologies becomes more drastic over time. As a result, the share of users behind transition technologies decreases from 11.76 % (World IPv6 Day) to 1.54 % (World IPv6 Launch) of the total IPv6 users. Although our observation is based on the traffic volume, we confirm the tendency of the native IPv6 domination. More precisely, we see that the fraction of IPv6 traffic transferred with transition technologies decreases from 55.49 % (World IPv6 Day) to 46.74 % (World IPv6 Launch). From our measurement viewpoint, the amount of native IPv6 traffic has begun to outstrip the amount of IPv6 traffic via transition technologies since the World IPv6 Day.
V-B Hurricane Electric
Hurricane Electric is a global Internet backbone and one of the largest networks in terms of the number of customers as well as the largest IPv6 network in terms of the number of connected networks. According to the report of Hurricane Electric [14], in the middle of 2012, 85.4 % of the global Top Level Domains (TLDs) have IPv6 name servers. In an investigation of the top 1,000 Usenet servers, they find out that 16.22 % of them have IPv6 addresses. Given the fact that the Network News Transport Protocol (NNTP, the protocol used for Usenet) accounts for up to 5 % of the residential network traffic [12], the reported number of IPv6-enabled Usenet servers may produce a substantial fraction of IPv6 traffic. Indeed, Sarrar et al. [7] report that almost 40 % of the total IPv6 is NNTP traffic before World IPv6 Day. We also observe a considerable amount of NNTP traffic from our measurement.
V-C APNIC
The Asia Pacific Network Information Centre (APNIC) is the first regional Internet registry whose IPv4 address pool has been exhausted. APNIC measures the deployment level of IPv6 based on the IPv6 preference for IPv4 addresses using the BGP data. APNIC’s report describes that Europe has the highest IPv6 preference (0.51 in July, 2012) for IPv4 addresses among all continents. With the same metric, they report that Romania is the highest ranked country in the world. Similarly, the snapshot of Google’s IPv6 statistics in the same period shows that 8.38 % of their users from Romania access the website using IPv6 which is the highest number among all countries. We confirm that more than 17 % of the total IPv6 traffic in the peak period of our measurement is contributed by a Romanian ISP.
VI Related Work
Most of the studies made before the announcement of the name space exhaustion focused mainly on performance analyses of various transition techniques [15], IPv4 vs IPv6 comparison [16], and the deployment level of IPv6 based on the address reachability [17, 18, 19]. This tendency, however, became less pronounced as time passes. Instead, researchers start to take a close interest in the characteristics of IPv6 traffic based on real-world traces [20, 7]. In this section, we choose a small number of publications which also studied IPv6 and briefly discribe their work.
Raicu et al. [15] evaluated and compared the performance of the two different IPv4-to-IPv6 transition mechanisms, i. e., host-to-host encapsulation mechanism (6-over-4) and router-to-router tunneling mechanism (6in4), in terms of TCP latency, throughput, and CPU utilization.
Malone et al. [17] quantified the number of IPv6 addresses accessable in the Internet based on traffic data collected within specific websites and DNS servers. They used prefixes of identified IPv6 addresses in order to classify IPv4-to-IPv6 transition techniques. During their measurement (mid. 2006), the authors observed the remarkable increase of teredo prefixes, but still the least used compared to other transition mechanisms, within their data sets. Karpilovsky et al. [18] also measured the number of publicly announced IPv6 prefixes by analyzing snapshots of BGP data obtained from RouteViews Project. They reported that RIPE, i. e., Regional Internet Registry (RIR) for European countries, is the increasingly dominant registrar for IPv6 address allocation. Colitti et al. [19] analyzed passively collected data from Google’s IPv6-enabled web page and evaluated the degree of the IPv6 adoption. Their evaluation shows that the adoption of IPv6 is still low but steadily growing and that the vast majority of IPv6 traffic is contributed by only small number of networks.
Gao et al. [20] proposed the method to classify the P2P traffic from flow-baed IPv6 traffic and evaluated the stage of the IPv6 deployment in China. They found that P2P and streaming applications are accounting for the major fraction of IPv6 traffic in China.
Nikkhah et al. [16] assessed the performance of IPv6 and compare it to the performance of IPv4. They claimed that the inefficient pathfinding is the major cause of the poor performance that IPv6 shows.
Sarrar et al. [7] observed changes of IPv6 traffic on World IPv6 Day by analyzing traffic traces collected from the same monitoring point that our study bases on. They reported the significant increase of IPv6 traffic (more than twice) on the event day and found that IPv6 traffic did not decrease even after the end of the event.
VII Conclusions
In this paper, we evaluated the current status of IPv6 traffic by analyzing the traffic trace collected from a large European IXP during 14 months of the time span including the two global IPv6 events (World IPv6 Day and World IPv6 Launch).
Even though we observed that IPv6 traffic accounts for only small fraction of the total Internet traffic (0.5 % in the peak period within our measurement), our study on IPv6 traffic showed that the deployment of IPv6 technology is finally on the right track and we are slowly overcoming the shyness facing the new Internet technology. Our claim is based on three factors we have shown in the paper. First, the sharp rise in the number of IPv6 prefixes and the IPv6 traffic has been observed since the World IPv6 Day and the increase rate does not slow down after the the World IPv6 Launch event. Second, the application mix of the IPv6 traffic began to form the current traffic status of the IPv4-dominated Internet, e. g., about 50 % of HTTP traffic. Third, the fraction of native IPv6 traffic overtook that of traffic transferred within IPv6-over-IPv4 technologies. We are of the belief that continuous efforts on the IPv6 deployment such as World IPv6 Day and World IPv6 Launch will keep this increasing tendency.
References
- [1] Archive: 2011 world ipv6 day. [Online]. Available: http://www.internetsociety.org/ipv6/archive-2011-world-ipv6-day
- [2] World ipv6 launch. [Online]. Available: http://www.worldipv6launch.org
- [3] S. Deering and R. Hinden, “Internet Protocol, Version 6 (IPv6) Specification,” RFC 2460 (Draft Standard), Internet Engineering Task Force, Dec. 1998, updated by RFCs 5095, 5722, 5871. [Online]. Available: http://www.ietf.org/rfc/rfc2460.txt
- [4] Apnic’s ipv4 pool usage. [Online]. Available: http://www.apnic.net/community/ipv4-exhaustion/graphical-information
- [5] The internet society. [Online]. Available: http://www.internetsociety.org
- [6] B. Ager, N. Chatzis, A. Feldmann, N. Sarrar, S. Uhlig, and W. Willinger, “Anatomy of a large european ixp,” in Proceedings of the ACM SIGCOMM 2012, Aug. 2012. [Online]. Available: http://www.net.t-labs.tu-berlin.de/papers/ACFSUW-ALEI-12.pdf
- [7] N. Sarrar, G. Maier, B. Ager, R. Sommer, and S. Uhlig, “Investigating ipv6 traffic: what happened at the world ipv6 day?” in Proceedings of the 13th international conference on Passive and Active Measurement, ser. PAM’12. Berlin, Heidelberg: Springer-Verlag, 2012, pp. 11–20.
- [8] E. Nordmark and R. Gilligan, “Basic Transition Mechanisms for IPv6 Hosts and Routers,” RFC 4213 (Proposed Standard), Internet Engineering Task Force, Oct. 2005. [Online]. Available: http://www.ietf.org/rfc/rfc4213.txt
- [9] C. Huitema, “Teredo: Tunneling IPv6 over UDP through Network Address Translations (NATs),” RFC 4380 (Proposed Standard), Internet Engineering Task Force, Feb. 2006, updated by RFCs 5991, 6081. [Online]. Available: http://www.ietf.org/rfc/rfc4380.txt
- [10] J. Massar, “AYIYA: Anything In Anything,” Internet Engineering Task Force, Jan. 2005. [Online]. Available: http://tools.ietf.org/html/draft-massar-v6ops-ayiya-02
- [11] Routeviews project. [Online]. Available: http://www.routeviews.org
- [12] J. Kim, F. Schneider, B. Ager, and A. Feldmann, “Today’s usenet usage: Characterizing nntp traffic,” in Proceedings of INFOCOM IEEE Conference on Computer Communications Workshops. New York, NY, USA: IEEE, March 2010, p. 1–6.
- [13] Google ipv6 statistics. [Online]. Available: http://www.google.com/ipv6/statistics.html
- [14] Global ipv6 deployment progress report. [Online]. Available: http://bgp.he.net/ipv6-progress-report.cgi
- [15] I. Raicu and S. Zeadally, “Evaluating ipv4 to ipv6 transition mechanisms,” in Proceedings of the 10th International Conference on Telecommunications, vol. 2, Feb. 2003, pp. 1091 – 1098 vol.2.
- [16] M. Nikkhah, R. Guérin, Y. Lee, and R. Woundy, “Assessing ipv6 through web access a measurement study and its findings,” in Proceedings of the 7th COnference on emerging Networking EXperiments and Technologies, ser. CoNEXT’11. New York, NY, USA: ACM, 2011, pp. 26:1–26:12. [Online]. Available: http://doi.acm.org/10.1145/2079296.2079322
- [17] D. Malone, “Observations of ipv6 addresses,” in Proceedings of the 9th international conference on Passive and active network measurement, ser. PAM’08. Berlin, Heidelberg: Springer-Verlag, 2008, pp. 21–30. [Online]. Available: http://dl.acm.org/citation.cfm?id=1791949.1791953
- [18] E. Karpilovsky, A. Gerber, D. Pei, J. Rexford, and A. Shaikh, “Quantifying the extent of ipv6 deployment,” in Proceedings of the 10th international conference on Passive and Active Measurement, ser. PAM’09. Berlin, Heidelberg: Springer-Verlag, 2009, pp. 13–22. [Online]. Available: http://dx.doi.org/10.1007/978-3-642-00975-4_2
- [19] L. Colitti, S. Gunderson, E. Kline, and T. Refice, “Evaluating ipv6 adoption in the internet,” in Proceedings of the 11th international conference on Passive and Active Measurement, ser. PAM’10. Berlin, Heidelberg: Springer-Verlag, 2010, pp. 141–150. [Online]. Available: http://dl.acm.org/citation.cfm?id=1889324.1889339
- [20] L. Gao, J. Yang, H. Zhang, D. Qin, and B. Zhang, “What’s going on in chinese ipv6 world,” in Network Operations and Management Symposium (NOMS), 2012 IEEE, Apr. 2012, pp. 534 –537.