DNC/HNC and N2D+/N2H+ ratios in high-mass star forming cores
Abstract
Chemical models predict that the deuterated fraction (the column density ratio between a molecule containing D and its counterpart containing H) of N2H+, (N2H+), high in massive pre-protostellar cores, is expected to rapidly drop of an order of magnitude after the protostar birth, while that of HNC, (HNC), remains constant for much longer. We tested these predictions by deriving (HNC) in 22 high-mass star forming cores divided in three different evolutionary stages, from high-mass starless core candidates (HMSCs, 8) to high-mass protostellar objects (HMPOs, 7) to Ultracompact HII regions (UCHIIs, 7). For all of them, (N2H+) was already determined through IRAM-30m Telescope observations, which confirmed the theoretical rapid decrease of (N2H+) after protostar birth (Fontani et al. 2011). Therefore our comparative study is not affected by biases introduced by the source selection. We have found average (HNC) of 0.012, 0.009 and 0.008 in HMSCs, HMPOs and UCHIIs, respectively, with no statistically significant differences among the three evolutionary groups. These findings confirm the predictions of the chemical models, and indicate that large values of (N2H+) are more suitable than large values of (HNC) to identify cores on the verge of forming high-mass stars, likewise what found in the low-mass regime.
keywords:
Molecular data – Stars: formation – radio lines: ISM – submillimetre: ISM – ISM: molecules1 Introduction
The process of deuterium enrichment in molecules from HD, the main reservoir of deuterium in molecular clouds, is initiated by three exothermic ion-molecule reactions (e.g. Millar et al. 1989):
| (1) |
| (2) |
| (3) |
Since the backward reactions are endothermic by 232, 390 and 550 K, respectively, in cold environments (e.g. K for reaction (1)) they proceed very slowly, favouring the formation of deuterated ions. Moreover, the freeze-out of CO and other neutrals, particularly relevant in high-density gas ( cm-3), further boosts the deuteration process (e.g. Bacmann et al. 2003, Crapsi et al. 2005, Gerin et al. 2006). Therefore, in dense and cold cores the deuterated fraction, , defined as the abundance ratio between a deuterated molecule and its hydrogenated counterpart, is expected to be much higher than the average [D/H] interstellar abundance (of the order of , Oliveira et al. 2003, Linsky et al. 2006). Because of the changements in physical and chemical properties of a star forming core, its is expected to change with the evolution too. Specifically, is predicted to increase when a pre–protostellar core evolves towards the onset of gravitational collapse, as the core density profile becomes more and more centrally peaked (due to the temperature decrease at core centre, e.g. Crapsi et al. 2007), and then it drops when the young stellar object formed at the core centre begins to heat its surroundings (see e.g. Caselli et al. 2002).
While this net drop in before and after the protostellar birth in (N2H+) is clearly observed in both low-mass (Crapsi et al. 2005, Emprechtinger et al. 2009) and high-mass (Fontani et al. 2011, Chen et al. 2011) star-forming cores, other species show deviations from this general scenario. For example, DNC is produced in the gas from the same route reaction as N2D+, namely reaction (1), so that (HNC) and (N2H+) are expected to vary similarly with temperature (Turner 2001). However, Sakai et al. (2012) have measured (HNC) in a sample of 18 massive cores including both infrared-dark starless cores and cores harbouring high-mass protostellar objects, and found that (HNC) in the starless cores is only marginally higher than that measured in the protostellar cores. This ’anomaly’ could be explained by the fact that the destruction processes of N2D+ are much faster than those of DNC: being an ion, N2D+ can recombine quickly (few years) with CO and/or electrons, while the neutral DNC has to be destroyed by ions (such as HCO+ and/or H) through much slower ( yrs) chemical reactions (Sakai et al. 2012).
The chemical models of Sakai et al. (2012), are able to partially reproduce the observational results obtained by Fontani et al. (2011) and Sakai et al. (2012). We have performed chemical calculations similar to those in Sakai et al. (2012), and obtained the consistent results (see Section 4.2 for the details of our chemical model): the N2D+/N2H+ ratio approaches during the cold pre–protostellar phase and drops quickly to after the protostellar birth because very sensitive to a temperature growth (Fig. 1, panel (a)), while the DNC/HNC ratio remains relatively high (above ) even after a rapid temperature rise, and decreases in timescales of several 104 yrs. On the other hand, the N2D+/N2H+ drops much more quickly, in less than 100 yrs (Fig. 1, panel (b)). However, the different criteria adopted by Fontani et al. (2011) and Sakai et al. (2012) to select the targets does not allow for a consistent observational comparison between the two deuterated fractions, as well as between models and data.
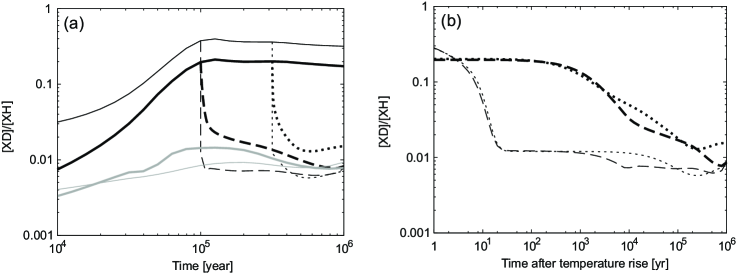
(b): same as panel (a), but the time starts from when the temperature increases from 10 K to 30 K.
In this paper we report observations performed with the Nobeyama-45m Telescope in the DNC and HN13C (1–0) rotational transitions towards 22 high-mass cores harbouring different stages of the high-mass star formation process, in which (N2H+) was already measured through observations of the IRAM-30 Telescope (Fontani et al. 2011). In this way, our study is not affected by observational biases possibly introduced by the source selection. The main aim of the work is to test in the same sample of objects whether the N2D+/N2H+ and DNC/HNC ratios trace differently the thermal history of high-mass cores despite the similar chemical origin, as predicted by Sakai et al. (2012). The sample, selected as explained in Fontani et al. (2011), is divided in 8 high-mass starless cores (HMSCs), 7 high-mass protostellar objects (HMPOs) and 7 ultracompact HII regions (UC HIIs), so that all main evolutionary groups of the high-mass star formation process are almost equally represented. We stress that all HMSCs, except I22134–B, have been previously classified as ’quiescent’ by Fontani et al. (2011) to distinguish them from ’perturbed’ cores, in which external phenomena (passage of outflows, shocks, nearby infrared objects) can have affected significantly the physical-chemical properties of the gas, as discussed in Fontani et al. (2011).
2 Observations
The HN13C(1–0) and DNC(1–0) transitions were observed with the NRO 45 m Telescope in may 2012 towards 22 out of the 27 cores already observed by Fontani et al. (2011) in N2D+(2–1) and N2H+(3–2). The source coordinates, as well as some basic properties of the star forming regions where they are embedded (LSR velocity of the parental core, distance to the Sun, bolometric luminosity, (N2H+) as measured by Fontani et al. 2011) are listed in Table 1. The two transitions were observed simultaneously by using the sideband-separating superconductor-insulator-superconductor receiver, T100 (Nakajima et al. 2008).
Some important spectroscopic parameters of the lines observed and the main technical parameters are listed in Table 2. The half-power beam width is about 21′′ and 18′′ at 76 (DNC (1–0)) and 87 GHz (HN13C(1–0)), respectively, similar to the beam width of the IRAM-30m Telescope at the frequency of the N2D+(2–1) line ( ′′, Fontani et al. 2011). The main beam efficiency () is 0.53 and 0.43 at 76 and 87 GHz, respectively. We derived the main beam temperature () from the antenna temperature () by using the relation = /, where is the main beam efficiency (see Table 2). For all the observations, we used digital backends SAM45 (bandwidth = 500 MHz, frequency resolution = 122.07 kHz). The telescope pointing was checked by observing nearby SiO maser source every one to two hours, and was maintained to be better than 5′′. The line intensities were calibrated by the chopper wheel method. All the observations were carried out with the position switching mode.
| source | RA(J2000) | Dec(J2000) | Ref. | (N2H+) | |||
| h m s | km s-1 | kpc | |||||
| HMSC | |||||||
| I00117-MM2 a | 00:14:26.3 | +64:28:28 | 1.8 | (1) | 0.32 | ||
| G034-G2(MM2) a | 18:56:50.0 | +01:23:08 | 2.9 | r | (4) | 0.7 | |
| G034-F2(MM7) a | 18:53:19.1 | +01:26:53 | 3.7 | r | (4) | 0.43 | |
| G034-F1(MM8) a | 18:53:16.5 | +01:26:10 | 3.7 | – | (4) | 0.4 | |
| G028-C1(MM9) a | 18:42:46.9 | 04:04:08 | 5.0 | – | (4) | 0.38 | |
| I20293-WC a | 20:31:10.7 | +40:03:28 | 2.0 | (5,6) | 0.19 | ||
| I22134-G b w | 22:15:10.5 | +58:48:59 | 2.6 | (7) | 0.023 | ||
| I22134-B b | 22:15:05.8 | +58:48:59 | 2.6 | (7) | 0.09 | ||
| HMPO | |||||||
| I00117-MM1 a | 00:14:26.1 | +64:28:44 | 1.8 | (1) | |||
| 18089–1732 b | 18:11:51.4 | 17:31:28 | 3.6 | (9) | 0.031 | ||
| 18517+0437 b | 18:54:14.2 | +04:41:41 | 2.9 | (10) | 0.026 | ||
| G75-core a | 20:21:44.0 | +37:26:38 | 3.8 | (11,12) | |||
| I20293-MM1 a | 20:31:12.8 | +40:03:23 | 2.0 | (5) | 0.07 | ||
| I21307 a | 21:32:30.6 | +51:02:16 | 3.2 | (13) | |||
| I23385 a | 23:40:54.5 | +61:10:28 | 4.9 | (14) | 0.028 | ||
| UC HII | |||||||
| G5.89–0.39 b | 18:00:30.5 | 24:04:01 | 1.28 | (15,16) | 0.018 | ||
| I19035-VLA1 b | 19:06:01.5 | +06:46:35 | 2.2 | (11) | 0.04 | ||
| 19410+2336 a | 19:43:11.4 | +23:44:06 | 2.1 | (17) | 0.047 | ||
| ON1 a | 20:10:09.1 | +31:31:36 | 2.5 | (18,19) | 0.017 | ||
| I22134-VLA1 a | 22:15:09.2 | +58:49:08 | 2.6 | (11) | 0.08 | ||
| 23033+5951 a | 23:05:24.6 | +60:08:09 | 3.5 | (17) | 0.08 | ||
| NGC7538-IRS9 a | 23:14:01.8 | +61:27:20 | 2.8 | (8) | 0.030 | ||
a Observed in N2H+ (3–2) and N2D+ (2–1);
b Observed in N2H+ (1–0), N2H+ (3–2), and N2D+ (2–1);
c Observed in N2H+ (1–0) and N2D+ (2–1);
w ”warm” HMSC;
r Luminosity of the core and not of the whole associated star-forming region (Rathborne et al. 2010);
References: (1) Palau et al. (2010); (2) Busquet et al. (2011); (3) Beuther et al. (2007); (4) Butler & Tan (2009); (5) Palau et al. (2007); (6) Busquet et al. (2010); (7) Busquet (2010); (8) Sánchez-Monge et al. (2008); (9) Beuther et al. (2004); (10) Schnee & Carpenter (2009); (11) Sánchez-Monge (2011); (12) Ando et al. (2011); (13) Fontani et al. (2004a); (14) Fontani et al. (2004b); (15) Hunter et al. (2008); (16) Motogi et al. (2011); (17) Beuther et al. (2002); (18) Su et al. (2009); (19) Nagayama et al. (2011).
| Transition | Rest Frequency | BW | HPBW | |||||
|---|---|---|---|---|---|---|---|---|
| (GHz) | (K) | (D) | (MHz) | (kHz) | (arcsec) | (K) | ||
| DNC (1–0) | 76.305727 | 3.66 | 3.05 | 40 | 37 | 21 | 0.53 | 250 |
| HN13C (1–0) | 87.090850 | 4.18 | 3.05 | 40 | 37 | 18 | 0.43 | 150 |
3 Results
3.1 Detection rates and line profiles
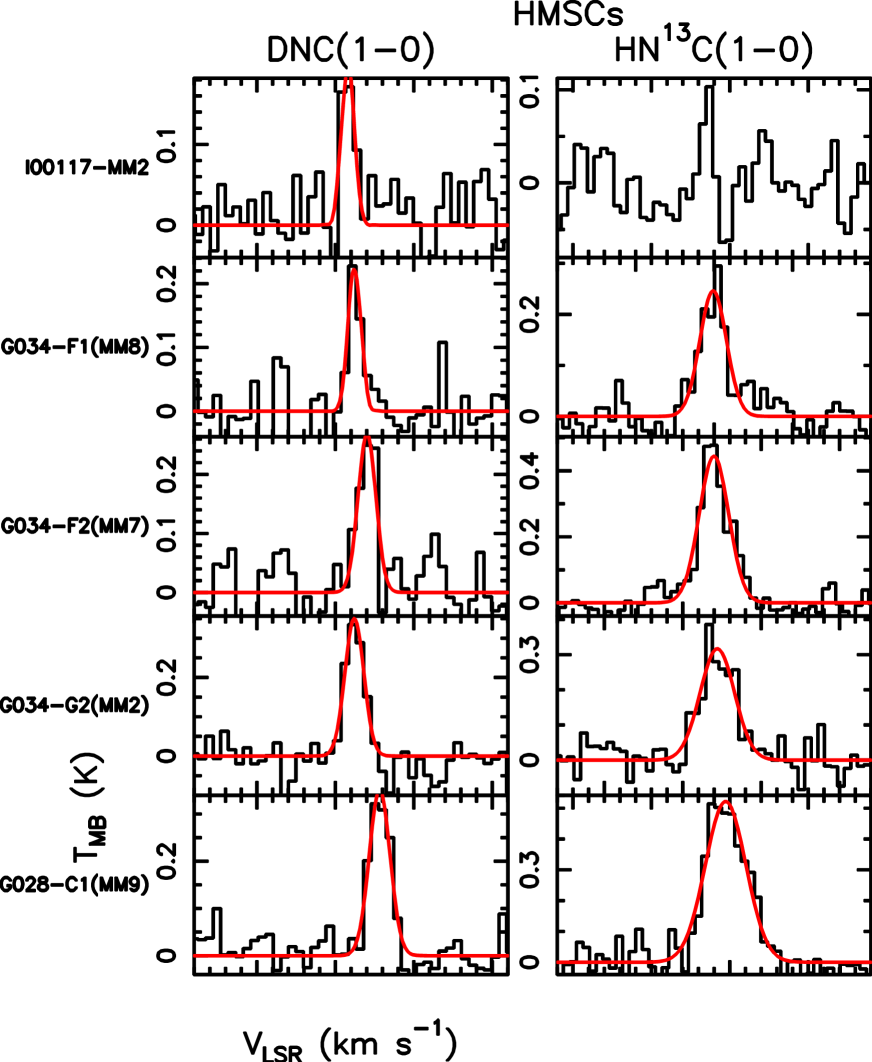
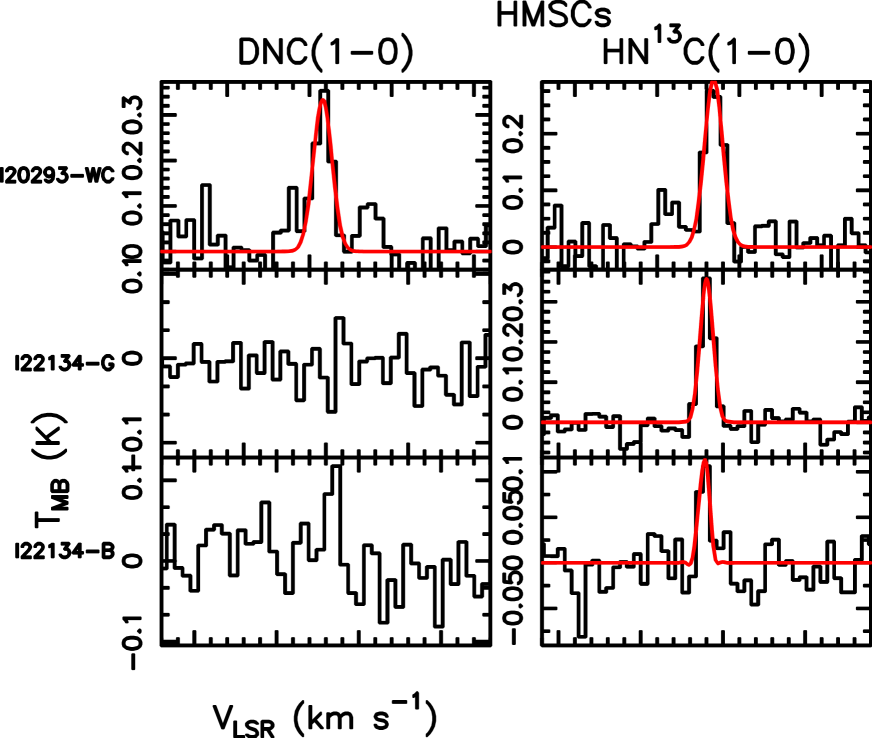
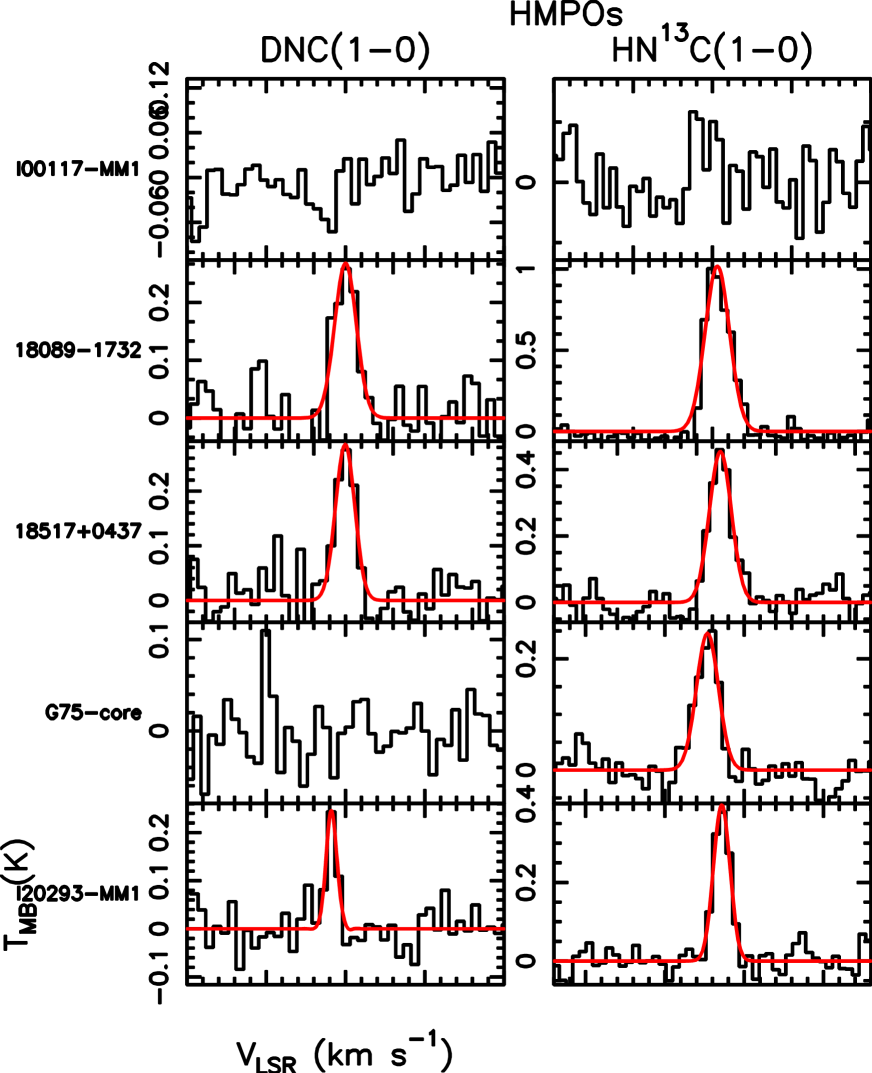
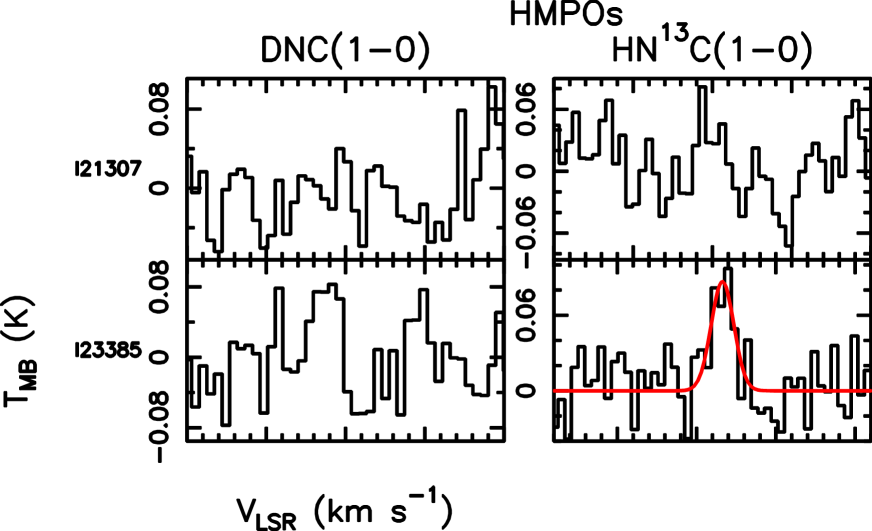
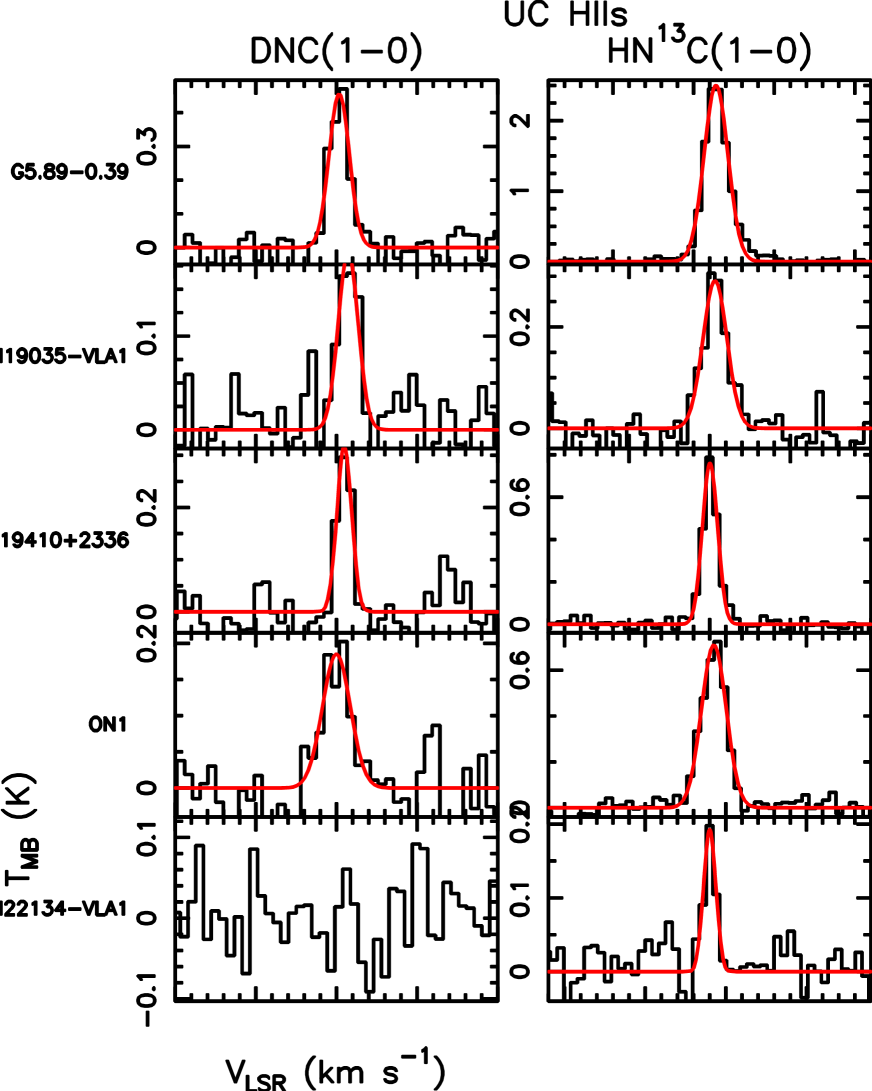
We have detected DNC (1–0) emission in: 6 out of 8 HMSCs, 3 out of 7 HMPOs, and 5 out of 7 UCHIIs. HN13C (1–0) has been detected towards all cores detected in DCN, except I00117-MM2, undetected in HN13C but detected in DNC (although a faint line at rms level is possibly present in the spectrum). Therefore, the detection rate follows a trend with core evolution similar to the one observed in N2D+ by Fontani et al. (2011): its maximum is in the HMSC phase, then it decreases in the HMPO phase but does not decrease further in the later stage of UC HII region. In the Appendix–A, available online, we show all spectra (Figs. A.1 to A.6). They have been analysed with the CLASS program, which is part of the GILDAS software111The GILDAS software is available at http://www.iram.fr/IRAMFR/GILDAS developed at the IRAM and the Observatoire de Grenoble.
Both transitions have a hyperfine structure due to electric quadrupole interactions of nitrogen and deuterium nuclei. We tried to fit the observed spectral line profiles by considering these components through the command ’method hfs’ into CLASS. However, given that the maximum separation between the components is 1.28 km s-1 and 0.73 km s-1 for DNC and HN13C, respectively (van der Tak et al. 2009), i.e. smaller than the typical velocity widths ( km s-1), the method failed. Due to this, and because the observed spectra typically show single-peaked profiles, the lines have been fitted with Gaussian functions. In Tables 3 and 4 we give the main parameters of the lines derived through Gaussian fits: integrated area (), full width at half maximum (), peak temperature () and 1 rms of the spectrum.
Asymmetric profiles and hints of non-Gaussian high-velocity wings are detected in the DNC(1–0) spectrum of G034–F1 and G034–F2 (Fig. A.1), and in the HN13C(1–0) spectrum of G034–F2, G028–C1 (Figs. A.1), 18089–1732, 18517+0437 (Fig. A.3), G5.89–0.39 and I19035–VLA1 (Fig. A.5), 23033+5951 and NGC7538–IRS9 (Fig. A.6). The non-Gaussian emission in the wings can be naturally attributed to outflows in the HMPOs and UCHIIs, although neither DNC nor HN13C are typical outflow tracers. On the other hand, this explanation is not plausible in the HMSCs G034–F1, G034–F2 and G028–C1, which do not show any clear star formation activity. Other possibilities could be the presence of multiple velocity components, or high optical depth effects. High optical depths seem unlikely for the DNC and HN13C lines because these species are not very abundant, and also because the major effect should be at line centre, while the asymmetries are seen at the edges of the lines (see e.g. G034–F1 in Fig. A.1). The presence of multiple velocity components is the most realistic scenario, especially in the HMSCs. However, only with higher angular resolution observations one can shed light on the origin of these asymmetric line shapes.
3.2 Line widths
In Fig. 2 we compare the line widths of DNC(1–0) to both those of the HN13C(1–0) and N2D+(2–1) transitions detected by Fontani et al. (2011). Globally, DNC and HN13C(1–0) have comparable line widths (left panel in Fig. 2) regardless of the evolutionary stage of the cores. This global trend confirms that the two transitions arise from gas with similar turbulence, as already found in the massive star-forming cores studied by Sakai et al. (2012). Incidentally, we note that four HMSCs have HN13C(1–0) line widths in between and 3 km s-1, i.e. almost twice the corresponding DNC(1–0) line widths. However, the low signal to noise ratio in the spectra, and the fact that the kinematics in the targets may be complex and due to the superimposition of several velocity components (as suggested by the deviations from the Gaussian line shape, see Sect. 3.1), could explain the different line widths of DNC and HN13C in these sources.
A similar comparison between the DNC(1–0) line widths and those of the N2D+(2–1) transition is shown in the right panel of Fig. 2, for which a strong correlation is found (correlation coefficient , Kendall’s = 0.52). This time the DNC lines show a systematical smaller broadening not only in the HMSC group but also in the groups containing the more evolved objects. In this case, however, the reason could be also attributed to the fact that the two transitions require different excitation conditions: the (1–0) line traces gas colder, and hence more quiescent, than that associated with the emission of the (2–1) line.


Right panel: Same as left panel but the comparison is between DNC(1–0) and N2D+(2–1).
3.3 Deuterated fraction of HNC
| core | rms(2) | |||
|---|---|---|---|---|
| K km s-1 | km s-1 | K | K | |
| HMSC | ||||
| I00117–MM2 | 0.20(0.04) | 1.0(0.2) | 0.20(0.04) | 0.044 |
| G034–F2(MM7) | 0.38(0.06) | 1.3(0.2) | 0.27(0.05) | 0.055 |
| G034–F1(MM8) | 0.23(0.04) | 0.95(0.2) | 0.23(0.04) | 0.017 |
| G034–G2(MM2) | 0.53(0.06) | 1.4(0.2) | 0.35(0.05) | 0.018 |
| G028–C1(MM9) | 0.58(0.06) | 1.6(0.2) | 0.35(0.05) | 0.032 |
| I20293–WC | 0.47(0.07) | 1.3(0.2) | 0.34(0.05) | 0.021 |
| I22134–B | ||||
| I22134–G | ||||
| HMPO | ||||
| I00117–MM1 | ||||
| 18089–1732 | 0.43(0.07) | 1.6(0.3) | 0.26(0.04) | 0.055 |
| 18517+0437 | 0.43(0.05) | 1.4(0.2) | 0.29(0.05) | 0.012 |
| G75–core | ||||
| I20293–MM1 | 0.21(0.04) | 0.8(0.2) | 0.25(0.04) | 0.05 |
| I21307 | ||||
| I23385 | ||||
| UC HII | ||||
| G5.89–0.39 | 0.72(0.07) | 1.5(0.2) | 0.46(0.06) | 0.041 |
| I19035–VLA1 | 0.29(0.05) | 1.4(0.2) | 0.19(0.04) | 0.018 |
| 19410+2336 | 0.36(0.04) | 1.1(0.1) | 0.32(0.04) | 0.024 |
| ON1 | 0.40(0.06) | 2.0(0.4) | 0.18(0.04) | 0.026 |
| I22134-VLA1 | ||||
| 23033+5951 | 0.39(0.04) | 0.9(0.1) | 0.40(0.02) | 0.030 |
| NGC7538–IRS9 | ||||
in units; rms noise in the spectrum.
| core | rms(2) | |||
|---|---|---|---|---|
| K km s-1 | km s-1 | K | K | |
| HMSC | ||||
| I00117–MM2 | ||||
| G034–F2(MM7) | 1.05(0.06) | 2.2(0.2) | 0.44(0.04) | 0.05 |
| G034–F1(MM8) | 0.52(0.04) | 2.0(0.2) | 0.25(0.03) | 0.04 |
| G034–G2(MM2) | 0.87(0.08) | 2.6(0.3) | 0.32(0.06) | 0.022 |
| G028–C1(MM9) | 1.69(0.08) | 3.0(0.1) | 0.52(0.05) | 0.05 |
| I20293-WC | 0.42(0.04) | 1.3(0.1) | 0.30(0.04) | 0.04 |
| I22134–B | 0.09(0.02) | 0.7(0.2) | 0.36 | 0.03 |
| I22134–G | 0.35(0.02) | 0.93(0.07) | 0.36(0.03) | 0.03 |
| HMPO | ||||
| I00117–MM1 | ||||
| 18089–1732 | 1.96(0.05) | 1.81(0.05) | 1.02(0.04) | 0.04 |
| 18517+0437 | 0.79(0.04) | 1.6(0.1) | 0.46(0.03) | 0.03 |
| G75-core | 0.43(0.04) | 1.6(0.2) | 0.25(0.03) | 0.03 |
| I20293–MM1 | 0.52(0.03) | 1.22(0.09) | 0.40(0.03) | 0.03 |
| I21307 | ||||
| I23385 | 0.15(0.04) | 0.9(0.3) | 0.08 | 0.03 |
| UC HII | ||||
| G5.89–0.39 | 4.64(0.05) | 1.74(0.02) | 2.50 (0.04) | 0.03 |
| I19035–VLA1 | 0.54(0.04) | 1.75(0.2) | 0.29(0.03) | 0.03 |
| 19410+2336 | 0.90(0.03) | 1.11(0.04) | 0.76(0.03) | 0.03 |
| ON1 | 1.37(0.04) | 1.81(0.07) | 0.71(0.03) | 0.03 |
| I22134-VLA1 | 0.18(0.03) | 0.9(0.2) | 0.19(0.03) | 0.02 |
| 23033+5951 | 0.54(0.03) | 1.2(0.1) | 0.41(0.03) | 0.02 |
| NGC7538–IRS9 | 0.57(0.04) | 1.4(0.1) | 0.39(0.03) | 0.03 |
in units; rms noise in the spectrum.
To derive (HNC) from the line parameters, we have adopted the same approach as in Sakai et al. (2012). First, we assume the lines are optically thin. This is justified by both the shape of the lines (which have not the flat-topped shape typical of high optical depth transitions) and by the findings of Sakai et al. (2012) in similar objects. Second, given the similar critical density of the two transitions ( cm-3), we assume their excitation temperatures and emitting regions, and thus the filling factors, are the same. Under these hypotheses, the column density ratio is given by (see Sakai et al. 2012):
| (4) |
where is the excitation temperature, and is the integrated area of the line (in units).
The method adopted to fit the lines does not allow to derive directly , for which a good fit to the hyperfine structure is needed. Therefore, in Eq. (4) as we have taken the kinetic temperatures given in Fontani et al. (2011, see their Table 3) assuming that the lines are thermalised. These have been derived either directly from the N2H+ (3–2) transition or from NH3 measurements, and then extrapolated to following Tafalla et al. (2004). In principle, the excitation temperature derived from N2H+ or NH3 can be different from that of the DNC and HN13C (1–0) lines, but we stress that Eq. (4) shows that the column density ratio is little sensitive even to changes of an order of magnitude in (see also Sakai et al. 2012).
We have then converted into =(HNC) by calculating the 13C/12C abundance ratio from the relation: 13C/12C (Wilson & Rood 1994), where is the source Galactocentric distance in kpc, and multiplying Eq. (4) by this correction factor. In Table 5 we list the column density ratio (HNC) for the cores observed and the physical parameters used to derive it as explained above: Galactic coordinates (longitude , latitude ), Galactocentric distance (), isotopic abundance ratio 13C/12C, , , and .
| core | 13C/12C | (HNC) | ||||||
| o | o | kpc | K km s-1 | K km s-1 | K | |||
| HMPO | ||||||||
| I00117–MM2 | 2.082 | 0.03706 | 9.5 | 79 | 0.20 | 14 | ||
| G034–F2(MM7) | 0.6071 | –0.005093 | 5.9 | 52 | 0.38 | 1.05 | 17 | 0.009 |
| G034–F1(MM8) | 0.6068 | –0.005021 | 5.9 | 52 | 0.23 | 0.52 | 17 | 0.011 |
| G034–G2(MM2) | 0.6132 | –0.0192 | 6.4 | 55 | 0.53 | 0.87 | 17 | 0.014 |
| G028–C1(MM9) | 0.5004 | –0.008629 | 4.8 | 43 | 0.58 | 1.69 | 17 | 0.010 |
| I20293–WC | 1.384 | 0.003144 | 8.4 | 70 | 0.47 | 0.42 | 17 | 0.02 |
| I22134–B | 1.819 | 0.03383 | 9.5 | 79 | 0.09 | 17 | ||
| I22134–G | 1.819 | 0.03373 | 9.5 | 79 | 0.35 | 25 | ||
| HMSC | ||||||||
| 18089–1732 | 0.231 | –0.001963 | 5.1 | 46 | 0.43 | 1.96 | 38 | 0.006 |
| 18517+0437 | 0.6592 | 0.01745 | 6.5 | 56 | 0.43 | 0.79 | 43 | 0.0125 |
| G75-core | 1.329 | 0.002301 | 8.4 | 71 | 0.43 | 96 | ||
| I20293-MM1 | 1.385 | 0.003035 | 8.4 | 70 | 0.21 | 0.52 | 43 | 0.008 |
| I23385 | 2.005 | –0.006124 | 11.5 | 94 | 0.15 | 43 | ||
| UC HII | ||||||||
| G5.89–0.39 | 0.1088 | –0.01743 | 7.2 | 62 | 0.72 | 4.64 | 26 | 0.003 |
| I19035–VLA1 | 0.7151 | –0.01113 | 7.0 | 60 | 0.29 | 0.54 | 39 | 0.011 |
| 19410+2336 | 1.05 | –0.005147 | 7.7 | 65 | 0.36 | 0.90 | 21 | 0.008 |
| ON1 | 1.22 | –0.02177 | 8.0 | 68 | 0.40 | 1.37 | 26 | 0.006 |
| I22134–VLA1 | 1.819 | 0.0338 | 9.5 | 79 | 0.18 | 47 | ||
| 23033+5951 | 1.928 | 0.001401 | 10.3 | 85 | 0.39 | 0.54 | 25 | 0.011 |
| NGC7538-IRS9 | 1.953 | 0.01593 | 9.9 | 82 | 0.57 | 26 | ||
(1) assumed equal to the gas kinetic temperature listed in Table A.3 of Fontani et al. (2011).
4 Discussion
4.1 (N2H+) versus (HNC)
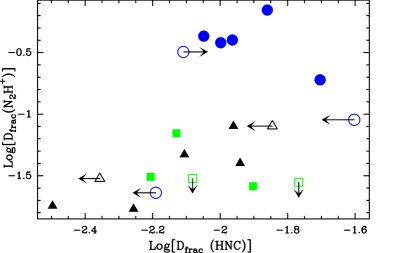
Table 5 shows that the HMSC group has the highest average (HNC) (mean value , if one includes the lower limit on I00117–MM2). The HMPOs and UC HII groups have very similar average (HNC) ( and , respectively), but given the dispersion and the poor statistics, there are no significant statistical differences between the three groups. By comparing the observational data of this work and those of Fontani et al. (2011), we clearly note a different behavior of (HNC) and (N2H+) in high-mass star-forming cores: (HNC) does not change significantly going from the pre-protostellar phase to subsequent phases of active star formation, while (N2H+) is smaller of an order of magnitude in the evolved phases (HMPOs and UCHIIs) than in the pre-protostellar phase (HMSCs), and the latter evolutionary group is undoubtedly statistically separated from the other two (Fontani et al. 2011). We stress once more that these results, obtained towards the same clumps and with comparable telescope beam sizes, are not affected by possible biases introduced by the source selection.
In Fig. 3 we compare (N2H+) and (HNC) measured in the cores observed in both N2D+ (Fontani et al. 2011) and DNC. As one can see, the sources with the largest (N2H+) tend to also have the largest (HNC), despite the different absolute magnitude especially in the HMSC group. In fact, the two parameters are slightly correlated, with a Kendall’s rank correlation coefficient of (excluding lower and upper limits, which tend to reinforce the possible correlation though).
4.2 (N2H+) and (HNC) versus chemical models
The results presented in Section 4.1 are consistent overall with the scenario proposed by the chemical models of Sakai et al. (2012): the N2D+/N2H+ abundance ratio sharply decreases after the protostellar birth, while the DNC/HNC abundance ratio decreases more gradually and maintains for longer the high deuteration of the earliest evolutionary stages of the core. In this subsection, we compare the observational results with the model predictions in detail.
We have solved the chemical rate equations with the state-of-art gas-grain reaction network of Aikawa et al. (2012). The model includes gas-phase reactions, interaction between gas and grains, and grain surface reactions. The parameters for chemical processes are essentially the same as in Sakai et al. (2012), except for the binding energy of HCN and HNC; we adopt a binding energy of 4170 K for HCN (Yamamoto et al. 1983), while a smaller value of 2050 K was used for those species in Sakai et al. (2012). We assume the binding energy of HNC to be the same as that of HCN. Species are initially assumed to be atoms (either neutrals or ions), except for hydrogen and deuterium, which are in molecular form. The elemental abundance of deuterium is set to be (Linsky 2003). As a physical model, we assume a static homogeneous cloud core with a H2 volume density of 104 cm-3 or 105 cm-3. To mimic the protostar formation, we suddenly rise a temperature from 15 K to 40 K at a given time of 105 yr. The two temperatures are consistent with the average kinetic temperatures measured in the targets of this work ( K and K for HMSCs and HMPOs, respectively, see Table 5). Our choice of 105 yr is comparable to the timescale of high-mass starless-phase ( yr) estimated by the statistical study of Chambers et al. (2009), while Parsons et al. (2009) estimated it to be a few 103–104 yr.
A comparison between model predictions and observational results is illustrated in Fig. 4. In our model, in the pre-protostellar stage ( K) the deuteration of both molecules increases similarly with time: this is due to the fact that the deuterium fractionation is initiated in both species by the same route reaction (i.e. H isotopologues), as mentioned in Sect. 1. On the other hand, if we assume that the deuterated fractions of the HMSCs must be compared with the model predictions before the temperature rise, i.e. before yr, the measured (HNC) and (N2H+) cannot be reproduced simultaneously in a single model: (HNC) can be well reproduced with cm-3, while (N2H+) is reproduced with cm-3. This discrepancy could indicate that the observed lines of DNC (and HN13C) arise from regions that, on average, are less dense than those responsible for the emission of N2D+ (and N2H+). In fact, the observational parameters are averaged values measured over slightly different angular regions (′′ for DNC, and ′′ for N2D+), so that the emission seen in DNC could be more affected than that seen in N2D+ by the contribution from the low-density envelope surrounding the dense cores, where the deuterium fractionation is expected to be less important. This can explain why the model with lower average gas density can reproduce (HNC), but not (N2H+), for which a higher average gas density is needed. Another possibility is that we are missing something in the current chemical model. For example, we do not consider the ortho state of hydrogen molecules in this work. The presence of ortho-H2 suppresses the deuteration process of molecules, since the internal energy of ortho-H2 helps to overcome the endothermicity of reaction (1) in the backward direction (Flower et al. 2006). If we consider ortho-H2, however, both the DNC/HNC and N2D+/N2H+ abundance ratios would be lowered.
Inspection of Fig. 4 also shows that an average (N2H+) in a starless core with cm-3 is reached at a time close to yrs. Assuming this as the time necessary for the starless core to collapse, as suggested by Chambers et al. (2009), this means that only cores relatively close to the onset of gravitational collapse, i.e. the so–called pre–stellar cores, can give rise to the observed high values of (N2H+). This behaviour is in agreement with the predictions of chemical models including also the spin states of the H2 and H isotopologues (Kong et al. 2013), in which levels of (N2H+) larger than 0.1 are possible only in cores older than yrs. Models with higher average density (cm-3) can reproduce such high deuterated fractions in shorter times, but these average densities are not realistic to represent regions with angular sizes of ′′, like those that we have observed.
In the protostellar stage ( K), the N2D+/N2H+ abundance ratio sharply decreases in timescale of 102 yrs, while the DNC/HNC abundance ratio decreases in 104 yrs both in the model with cm-3 and in that with cm-3. Again, the measured (HNC) is better reproduced by the model with cm-3 after 104–105 yr from a temperature rise, while our model slightly underestimates (N2H+), regardless of the average gas density, unless the protostellar cores are extremely young (i.e. age shorter than yrs). It should be noted that once the gas temperature rises, not only the N2D+/N2H+ ratio, but also the N2H+ abundance decreases significantly in the models. Also, according to models of spherical star-forming cores (Aikawa et al. 2012, Lee et al. 2004), the central warm gas is still surrounded by a spherical shell of cold and dense gas during the early stages of collapse, in which both N2D+ and N2H+ are still abundant. This is not taken into account for simplicity in our one-box model. However, such residual emission from the cold envelope could explain the higher N2D+/N2H+ ratio still apparent after the sudden temperature rise.
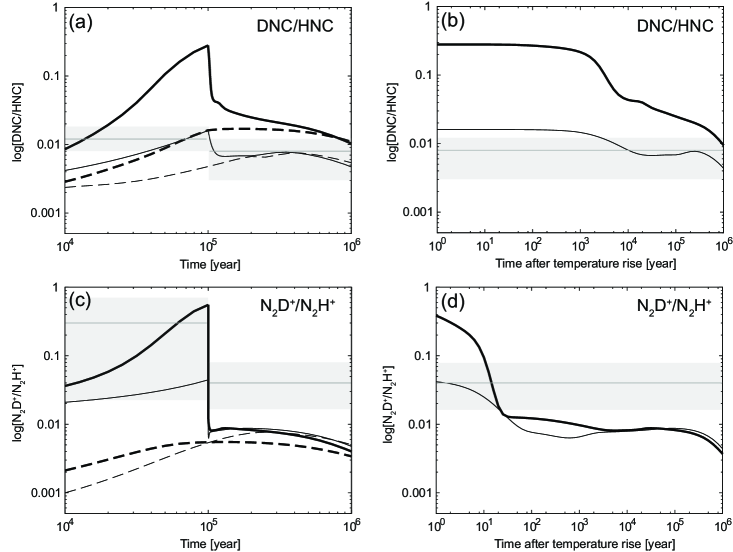
(b): same as (a) for N2D+/N2H+. The observational data here are from Fontani et al. (2011).
(c) and (d): same as (a) and (b), respectively, but the time starts from when the temperature increases from 15 K to 40 K.
5 Conclusions
We have observed the DNC and HN13C(1–0) rotational transitions towards 22 massive star-forming cores in different evolutionary stages, towards which (N2H+) was already measured by Fontani et al. (2011). The aim of the work was to compare (HNC) to (N2H+) in the same sample of sources and with similar telescope beams, so that the comparison should not suffer from possible inconsistencies due to different sample selection criteria. The main observational result of this work confirms the predictions of the models of Sakai et al. (2012), namely that (HNC) is less sensitive than (N2H+) to a sudden temperature rise, and hence it should keep more than (N2H+) of the thermal history of the cores, despite the chemical processes leading to the deuteration of the two species are similar. Therefore, our work clearly indicates that (N2H+) is more suitable than (HNC) to identify high-mass starless cores. Based on the predictions of our chemical models, the starless cores studied in this work having (N2H+) around 0.2 - 0.3 are very good candidate massive ’pre–stellar’ cores, because only relatively ’evolved’ starless cores can be associated with such high values of (N2H+). Several results require follow-up high-angular resolution observations to map the emitting region of DNC and N2D+, as well as DNC and HN13C, and test if these are slightly different as the present low-angular resolution data seem to suggest. Observations of higher excitation HN13C and DNC lines (3–2 or 4–3) may be also important to constrain better the excitation conditions.
Acknowledgments
We thank the NRO staff for their help in the observations with the 45m Telescope presented in this paper. The 45m Telescope is operated by the Nobeyama Radio Observatory, a branch of the National Astronomical Observatory of Japan. This study is supported by KAKENHI (21224002, 23540266, 25400225 and 25108005). K.F. is supported by the Research Fellowship from the Japan Society for the Promotion of Science (JSPS) for Young Scientists.
References
- Aikawa et al. (2012) Aikawa, Y., Wakelam, V., Hersant, F., Garrod, R.T., Herbst, E. 2012, ApJ, 760, 40
- Aikawa et al. (2005) Aikawa, Y., Herbst, E., Roberts, H., Caselli, P. 2005, ApJ, 620, 330
- Ando et al. (2011) Ando, K., Nagayama, T., Omodaka, T. et al. 2011, PASJ, 63, 45
- Bacmann et al. (2003) Bacmann, A., Lefloch, B., Ceccarelli, C., et al. 2003, ApJ, 585, L55
- Bergin & Tafalla (2007) Bergin, E.A. & Tafalla, M. 2007, ARA&A, 45, 339
- Beuther et al. (2007) Beuther, H., Leurini, S., Schilke, P. et al. 2007, A&A, 466, 1065
- Beuther et al. (2004) Beuther, H., Hunter, T.R., Zhang, Q. et al. 2004, ApJ, 616, L23
- Beuther et al. (2002) Beuther, H., Walsh, A., Schilke, P. et al. 2002, A&A, 390, 289
- Busquet et al. (2011) Busquet, G., Estalella, R., Zhang et al. 2011, A&A, 525, A141
- Busquet (2010) Busquet, G. 2010, PhD Thesis, University of Barcelona
- Busquet et al. (2010) Busquet, G., Palau, A., Estalella, R. et al. 2010, A&A, 517, L6
- Butler & Tan (2009) Butler, M.J. &Tan, J.C. 2009, ApJ, 696, 484
- Caselli et al. (2002) Caselli, P., Walmsley, C.M., Zucconi, A., et al. 2002a ApJ, 565, 344
- Chambers et al. (2009) Chambers, E. T., Jackson, J. M., Rathborne, J. M., & Simon, R. 2009, ApJS, 181, 360
- Chen et al. (2011) Chen, H.-R., Liu, S.-Y., Su, Y.-N., Wang, M.-Y. 2011, ApJ, 743, 196
- Crapsi et al. (2005) Crapsi, A., Caselli, P., Walmsley, C. M., et al. 2005, ApJ, 619, 379
- Crapsi et al. (2007) Crapsi, A., Caselli, P., Walmsley, M.C., Tafalla, M. 2007, A&A, 470, 221
- Dalgarno (2006) Dalgarno, A. 2006, PNAS, 10312269
- Emprechtinger et al. (2009) Emprechtinger, M., Caselli, P., Volgenau, N.H., Stutzki, J., Wiedner, M.C. 2009, A&A, 493, 89
- Flower et al. (2006) Flower, D. R., Pineau des Forêts, G., & Walmsley, C. M. 2006, A&A, 449, 621
- Fontani et al. (2011) Fontani, F., Palau, A., Caselli, P. et al. 2011, A&A, 529, L7
- Fontani et al. (2004a) Fontani, F., Cesaroni, R., Testi, L. et al. 2004a, A&A, 424, 179
- Fontani et al. (2004b) Fontani, F., Cesaroni, R., Testi, L. et al. 2004b, A&A, 414, 299
- Gerin et al. (2006) Gerin, M., Lis, D.C., Philipp, S., Gusten, R., Roueff, E., Reveret, V. 2006, A&A, 454, L63
- Goodman et al. (1998) Goodman, A.A., Barranco, J. A., Wilner, D.J., & Heyer, M.H. 1998, ApJ, 504, 223
- Hunter et al. (2008) Hunter, T.R., Brogan, C.L., Indebetouw, R., Cyganowski, C. 2008, ApJ, 680, 1271
- Kong et al. (2013) Kong, S., Caselli, P., Tan J.C., Wakelam, V. 2013, arXiv:1312.0971
- Lee et al. (2004) Lee, J.-E., Bergin, E.A., Evans, N.J.II 2004, ApJ, 617, 360
- Linsky et al. (2006) Linsky, J.L., Draine, B.T., Moos, H.W., Jenkins, E.B., Wood, B.E. et al. 2006, ApJ, 647, 1106
- Linsky (2003) Linsky, J.L. 2003, SSRv, 106, 49
- Millar et al. (1989) Millar, T.J., Bennett, A., Herbst, E. 1989, ApJ, 340, 906
- Motogi et al. (2011) Motogi, K., Sorai, K., Habe, A. et al. 2011, PASJ, 63, 31
- Nagayama et al. (2011) Nagayama, T., Omodaka, T., Nakagawa, A. et al. 2011, PASJ, 63, 23
- Nakajima et al. (2008) Nakajima, T., Sakai, T., & Asayama, S. et al. 2008, PASJ, 60, 435
- Oliveira et al. (2003) Oliveira, C.M., Hébrard, G., Howk, J.C., Kruk, J.W., Chayer, P., Moos, H.W. 2003, ApJ, 587, 235
- Palau et al. (2010) Palau, A., Sánchez-Monge, Á., Busquet, G. et al. 2010, A&A, 510, 5
- Palau et al. (2007) Palau, A., Estalella, R., Girart, J.M. et al. 2007, A&A, 465, 219
- Parsons et al. (2009) Parsons, H., Thompson, M. A., & Chrysostomou, A. 2009, MNRAS, 399, 1506
- Pineda et al. (2010) Pineda, J.E., Goodman, A.A., Arce, H.G., Caselli, P., Foster, J.B., Myers, P.C., Rosolowsky, E.W. 2010, ApJ, 712, L116
- Rathborne et al. (2010) Rathborne, J.M., Jackson, J.M., Chambers, E.T. et al. 2010, ApJ, 715, 310
- Sánchez-Monge (2011) Sánchez-Monge, Á. 2011, PhD Thesis, University of Barcelona
- Sánchez-Monge et al. (2008) Sánchez-Monge, Á., Palau, A., Estalella, R., Beltrán, M.T., Girart, J.M. 2008, A&A, 485, 497
- Sakai et al. (2012) Sakai, T., Sakai, N., Furuya, K., Aikawa, Y., Hirota, T., Yamamoto, S., 2012, ApJ, 747, 140
- Schnee & Carpenter (2009) Schnee, S. & Carpenter, J. 2009, ApJ, 698, 1456
- Su et al. (2009) Su, Y.-N., Liu, S.-Y., Lim, J. 2009, ApJ, 698, 1981
- Tafalla et al. (2004) Tafalla, M., Myers, P.C., Caselli, P., Walmsley, C.M. 2004, A&A, 416, 191
- Turner (2001) Turner, B.E. 2001, ApJS, 136, 579
- van der Tak et al. (2009) van der Tak, F.F.S., Müller, H. S. P.; Harding, M. E.; Gauss, J. 2009, A&A, 507, 347
- Wilson & Rood (1994) Wilson, T. L. & Rood, R. 1994, ARA&A, 32, 191
- Yamamoto et al. (1983) Yamamoto, T., Nakagawa, N., Fukui, Y. 1983, A&A, 122, 171
Appendix A: Spectra
In this appendix we show all spectra of the DNC(1–0) and HN13C(1–0) transitions.