Nuclear magnetic resonances in (In,Ga)As/GaAs quantum dots studied by resonant optical pumping
Abstract
The photoluminescence polarizations of (In,Ga)As/GaAs quantum dots annealed at different temperatures are studied as a function of external magnetic field (Hanle curves). In these dependencies, remarkable resonant features appear due to all-optical nuclear magnetic resonances (NMR) for optical excitation with modulated circular polarization. Application of an additional radio-frequency field synchronously with the polarization modulation strongly modifies the NMR features. The resonances can be related to transitions between different nuclear spin states split by the strain-induced gradient of the crystal field and by the externally applied magnetic field. A theoretical model is developed to simulate quadrupole and Zeeman splittings of the nuclear spins in a strained quantum dot. Comparison with the experiment allows us to uniquely identify the observed resonances. The large broadening of the NMR resonances is attributed to variations of the quadrupole splitting within the quantum dot volume, which is well described by the model.
pacs:
78.67.Hc, 78.47.jd, 76.70.Hb, 73.21.LaIntroduction
Nuclear magnetic resonance (NMR) is based on the resonant absorption of radio frequency (RF) electromagnetic radiation by nuclear spin-split states by a magnetic field. The absorption of RF field is limited by small differences of the populations of the nuclear-spin states in thermodynamic equilibrium. Therefore NMR requires probing of a macroscopically large number of nuclei () Abragam . The NMR detection sensitivity can be greatly improved by preparing a nuclear-spin state with degree of polarization higher than the thermodynamic equilibrium value at a given magnetic field LampelPRL68 . Additional improvement is achieved by using optical methods to detect the state of the nuclear-spin system Paget-OO ; KKM-SPS . The efficiency of optically detected NMR was demonstrated for bulk semiconductors EkimovJETPLett72 ; PagetPRB81 ; PagetPRB82 , quantum wells KalevichJETPLett90 ; FlinnJLum90 ; KalevichApplMagnRes91 ; BarrettPRL94 ; PoggioAPL05 , and even quantum dots (QDs) GammonScience97 ; DzhioevJETPLett98 ; MakhoninPRB10 ; FlisinskiPRB10 ; MakhoninNatMat11 ; ChekhovichNatNano12 , containing nuclear spins only, thanks to the high values of dynamic nuclear-spin polarization (DNP), of the order of tens percent, that can be achieved in QDs by optical pumping GammonPRL01 ; BraunPRB06 ; TartakovskiiPRL07 ; MaletinskyPRB07 ; OultonPRL07 ; CherbuninPRB09 ; ChekhovichPRL10 ; KrebsPRL10 ; UrbaszekRMP13 .
For self-assembled QDs the observation of NMR is complicated by the large spread of parameters in a QD ensemble FlisinskiPRB10 . Usually, single QD spectroscopy is used to diminish this spread GammonScience97 ; MakhoninNatMat11 ; ChekhovichNatNano12 . However, a considerable broadening of the resonances remains even at the single QD level ChekhovichNatNano12 . The main origin of this broadening in self-assembled QDs is the inhomogeneous quadrupole splitting of the nuclear-spin states by the strain-induced gradient of crystal field within a dot DzhioevPRL07 ; MaletinskyNatPhys09 . The broadening results in overlapping resonances from the same and from different isotopes, making their identification difficult.
Here, we show that such an identification is nevertheless possible. We investigate two samples with self-assembled (In,Ga)As/GaAs QDs grown by the Stranski-Krastanov method and annealed at different temperatures. The annealing gives rise to a decrease of the deformation of the crystal lattice, caused by the mismatch of the QD and barrier lattices and, hence, to a decrease of the inhomogeneous quadrupole splitting of nuclear states.
We make use of polarization modulation of the optical pumping of the dots. Such modulation has been the common basis for the all-optical NMR technique KalevichFTT86 ; KikkawaScience00 . As the hyperfine interaction of nuclei with oriented electron spins can be described as an effective magnetic field (the Knight field) acting on the nuclei DPJETP73 , the modulation of this field caused by the modulated optical pumping is similar to the action of an RF field KalevichFTT80 ; KalevichFTT81 ; KalevichIzvNauk83 ; KalevichFTT86 ; KalevichFTT95 ; KikkawaScience00 ; SalisPRL01 ; SalisPRB01 ; EickhoffPRB02 . Optical detection of NMR under light-polarization modulation brings about a resonance cooling of nuclear spins or, in other words, a cooling of nuclear spin system in the rotating frame KalevichFTT80 ; KalevichFTT81 . The effect was observed in a magnetic field oriented perpendicular to the excitation light beam (Voigt geometry). Resonance cooling results in appearance of Overhauser field oriented parallel or antiparallel to the static magnetic field KalevichFTT80 ; KalevichFTT81 .
In our study we exploit another resonant effect connected with the modulation of the polarization of the optical pumping as described in Ref. CherbuninPRB11, . If the modulation frequency coincides with that of a nuclear-spin precession about the magnetic field, considerable nuclear-spin polarization perpendicular to the magnetic field appears in the system. This DNP component favorably increases the electron-spin polarization monitored in the experiment. As a result, additional maxima associated with the nuclear resonances appear in the magnetic field dependence of the electron spin polarization, i.e., in the Hanle curve. To accurately determine the positions of these nuclear resonances, we have measured the Hanle curves at different modulation frequencies varied from units of kilohertz up to of about MHz. An RF field synchronized with the optical modulation was applied to magnify the resonant effects.
Identification of the different resonances was done by a theoretical analysis based on modeling the quadrupole-Zeeman splitting of the nuclear-spin states. Comparison of the calculated results with the experimental data allows us to identify several resonances corresponding to transitions between the states characterized by spin projection for all the nuclei contained in the QDs and by for the In and Ga nuclei. Besides, resonances with transitions between the higher spin-projection states, , for the In nuclei and between the states having different projections, , for the In and Ga nuclei were identified. The large broadening of resonances is confirmed to be caused by the spread of strain within the QDs.
I Details of experiment
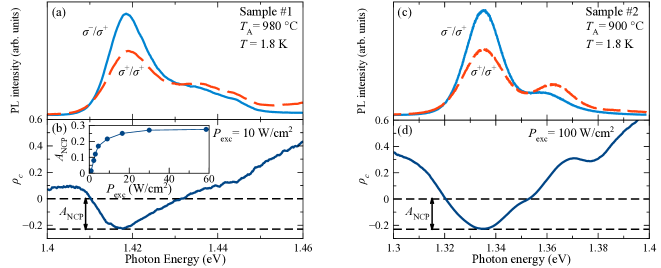
We study a heterostructure containing 20 layers of self-assembled (In,Ga)As QDs sandwiched between GaAs barriers. The barriers are -doped by donors with a concentration, which supplies every dot with, on average, a single resident electron after the donor ionization. The structure was grown by molecular-beam epitaxy on a (001)-oriented GaAs substrate. Rapid thermal post-growth annealing of the structure provides inter-diffusion of indium and gallium atoms between the QDs and GaAs barriers so that the nominally pure InAs QDs are partially enriched by the in-diffusion of Ga atoms which increases the band gap, resulting in a blue shift of the ground QD optical transition LangbeinPRB04 . The annealing also causes a decrease of built-in strain in the QDs that is an important source of the quadrupole splitting of the nuclear-spin states. We study two pieces of this structure annealed at °C (sample 1) and at °C (sample 2). The samples were placed in a cryostat with a superconducting magnet such that the magnetic field could be applied perpendicular to the structure growth axis (Voigt geometry) coinciding with the crystallographic axis. The experiments were performed at a sample temperature K.
To detect DNP, we look over the circular polarization of the PL from the QDs. To excite the QDs we use a continuous-wave Ti:sapphire laser, which photon energy is tuned to the optical transition of the wetting-layer exciton. The ground-state PL is dispersed by a half-metre spectrometer and is detected with a silicon avalanche photodiode. The degree of circular polarization of the PL, , is measured using a photo elastic modulator operated at a frequency of kHz and a two-channel photon-counting system. Here, is the PL intensity for co- (cross-) polarization relative to that of excitation. In the maximum of PL band of the QDs, the polarization is negative (Fig. 1) and reflects the mean spin polarization of the resident electrons along the optical axis ( axis), as has been extensively discussed earlier CortezPRL02 ; ShabaevPRB09 ; IgnatievOS09 . Due to the interaction of the resident electrons with the QD nuclei, the negative circular polarization (NCP) can be used as a sensitive tool to monitor the nuclear spin state OultonPRL07 ; CherbuninPRB09 ; FlisinskiPRB10 ; CherbuninPRB11 .
In our experiments, the helicity of the optical excitation was periodically modulated between and by an electro-optical modulator followed by a quarter-wave plate. In addition, an RF field was applied by means of a small coil oriented parallel to the optical axis. The RF-field frequency coinciding with the frequency of optical modulation was fixed, while the Hanle curves were measured by scanning the magnetic field.
II Experimental results and discussion
II.1 Hanle curves at optical excitation with modulated polarization. Dependence on modulation frequency
The PL of the QDs at low excitation density shows a broad emission contributed mostly by the ground state optical transition but also the first excited state transition shows up on the high-energy flank, see Fig. 1. We focus here on the behavior observed for the lowest transition. The corresponding emission line has the half-width at half-maximum of about 10 meV, centered at 1.418 eV for sample 1 and 1.337 eV for sample 2. The NCP is observed across the whole emission line with a peak amplitude reaching 30% at optimal excitation density, which is about 30 W/cm2 for sample 1 and three times larger for sample 2. The analysis shows KuznetsovaPRB13 that the upper limit of NCP is determined by the fraction of QDs containing a single resident electron. Optimization of the excitation density allows one to fully polarize the electrons. Note that the NCP is found to depend very sensitively on any residual magnetic field adding to the external field applied in the Voigt geometry. Therefore the residual magnetic fields including the Earth magnetic field were carefully compensated in our experiment by means of Helmholtz coils.
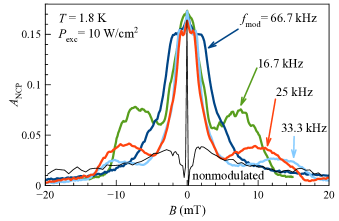
Magnetic-field dependencies of NCP were measured at the PL maximum for different frequencies of polarization modulation of the excitation. All Hanle curves presented in this paper were obtained by scanning the magnetic field in one direction, defined here as from negative to positive values. As an example, the Hanle curves for sample 1 are shown in Fig. 2. The Hanle curve measured with nonmodulated polarization of the excitation (black line) contains the so-called W-structure, which consists of a very narrow central peak and two maxima separated from the peak by dips. The appearance of the W-structure results from polarization of this nuclear spins along the magnetic field PagetPRB77 .
When the polarization of excitation is modulated, the Hanle curve becomes strongly modified. As seen from Fig. 2, the central peak drastically broaden and additional intense maxima appear. They move to higher magnetic fields with increasing modulation frequency. The frequency dependence indicates the resonant nature of the maxima. The rapid decrease of their amplitude at higher frequencies does not allow, however, to observe them in wide frequency range, which aggravates their identification.
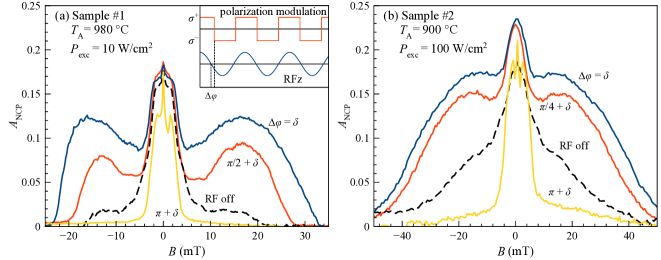
To increase the amplitude of the resonant peaks in the Hanle curves and to extend the range of transverse magnetic fields, in which the peaks can be observed, we applied to the sample an alternating RF magnetic field of small amplitude along the optical axis. The frequency of the alternating field was identical to that of the modulation of the optical excitation. The phase difference, , between the polarization and RF modulations was varied.
The effect of the RF field on the Hanle curve for sample 1 is shown in Fig. 3. Obviously, the effect strongly depends on spuriousdelta . At some optimal , the wings of the Hanle curve are greatly increased and the overall width of the curve is strongly enlarged hysteresis . Phase inversion of the RF field relative to the optimal case results in the opposite effect—the additional wings almost disappear and only the central part of the Hanle curve survives. For intermediate , an additional structure appears in the Hanle curve, indicating asynchronous magnification or suppression of the different resonances. This non-synchronicity facilitates the separation of resonances. Similar experiments were done for sample 2 where the Hanle curves are considerably wider due to the stronger quadrupole interaction. The effect of the RF field for this sample is similar to the one for sample 1.
II.2 Identification of resonance peaks
As seen from Fig. 3, the wings of the Hanle curve in most cases are rather smooth due to the large resonance broadening, whose origin we will discuss below. Therefore, to uniquely identify the position of the NMR resonances for different nuclei isotopes, we measured a set of Hanle curves at different modulation frequencies and phase differences . The amplitude of the RF field has been chosen to be relatively small (fraction of millitesla) and has been optimized for the best separation of the resonances. The experimental data were compared then with the results of theoretical modeling of the Zeeman splittings of the nuclear spin states in the QDs in presence of strain. The analysis of the whole set of Hanle curves measured at different modulation frequencies allowed us to identify the observed resonances, to retrieve the nuclear Zeeman splittings, and to determine the nuclear quadrupole splittings for the studied samples. The results of this analysis are discussed below.
II.2.1 Modeling of the quadrupole-Zeeman splitting of nuclear-spin states
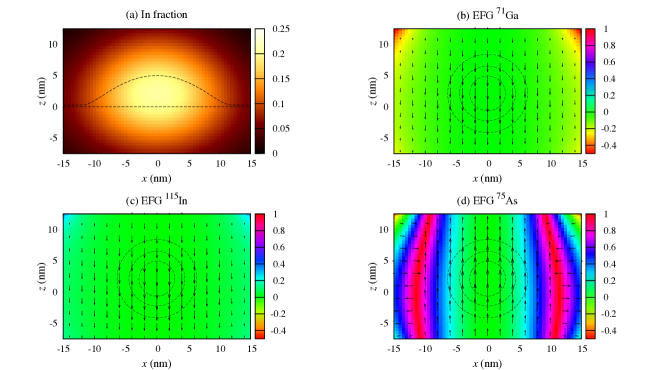
An estimation of the crystal lattice deformation in QDs annealed at different temperatures was given in Ref. FlisinskiPRB10, . Here, we give insight into the modeling of the strain-induced electric field gradient in the annealed QDs. The results are summarized in Fig. 4.
The annealing of the (In,Ga)As/GaAs heterostructure initiates an interdiffusion of In and Ga atoms followed by an increase of the QD size and a decrease of the In dot content. We model this process by solving a diffusion equation for the spatially variable indium fraction, , in the InxGa1-xAs compound (see Ref. PetrovPRB08, for details). Figure 4(a) shows the cross-section of the resulting distribution of for the QD annealed at a temperature above °C. It should be noted that the electron localization volume increases with annealing due to both, the increase of effective size of the dot and the decrease of the potential well depth for the conduction-band electron PetrovPRB08 .
Additionally, the strain in the QD crystal lattice, arising from the lattice mismatch of the QD and barrier materials, also changes with annealing. For modeling the quadrupole-Zeeman splittings of the nuclear sublevels in the QDs, it is important to account for the component of biaxial strain, defined as BulutayPRB12 . This component relaxes from the average value of in the unannealed QD down to (sample 1) and (sample 2) in the annealed QDs, as calculations show. These values agree well with our experimental data as demonstrated below. The calculations of were made for a hat-shaped QD, which we take as characteristic for the dots in the ensemble. Taking advantage of the cylindrical symmetry of our model, the biaxial component of the strain can be rewritten as . As we are interested in ensemble-averaged values of the observables, the strain-tensor components are calculated using continuum elasticity theory using the transverse-isotropic-media approximation EvenAPL07 ; EvenPRB08 , which is valid in our case. To obtain microscopic insight into an individual QD, a more complicated atomistic approach should be taken BulutayPRB12 .
The crystal lattice deformation is enhanced within the QD and causes there the appearance of an electric field gradient (EFG) at nuclear sites. The main origin of the EFG is the strain due to lattice mismatch. There is also a crystal field gradient due to the statistical population of anion sub-lattice sites with In and Ga atoms. This statistics concerns a fraction of the As nuclei and gives rise to such a strong quadrupole splitting that the corresponding resonances can be observed only in very high magnetic fields, which are available in our experiments.
The EFG relates to the elastic strain by a fourth-order tensor ShulmanPR57 , i.e.,
| (1) |
where summation over iterated subscripts is assumed. For compounds, there are only three nonzero components of the -tensor and only two of them are independent SundforsPRB74 , , , and , written in the Voigt notation.
The goal of our modeling is to obtain the principle components of the strain-induced EFG, , , and . In the first step, we calculate all nonzero components of using Eq. (1) and, in the second step, we diagonalize the obtained matrix . By doing this, we find the spatial dependencies of the principal component of the EFG, , and the asymmetry parameter, , for all the nuclei in the dot. The results of these calculations are shown in Figs. 4(b)–4(d) for the 71Ga, 115In, and 75As nuclei, respectively. As one can see from the figures, the principal component of the EFG tensor is directed along the -growth axis of the structure for all the nuclei. Additionally, the EFG direction at the As nuclei is opposite to that for the other nuclei because of the different signs of and for anions and cations (see Ref. SundforsPRB74, for details). Large variations of the parameter are found for the As nuclei located in the barrier to the left and right of the QD. Inside the dot where the ground-state electron density is large, this variation is negligibly small. To illustrate that, we show in Figs. 4(b)–4(d) the isosurfaces of the electron density distribution, calculated in the effective-mass approximation PetrovPRB08 .
At zero magnetic field, the nuclear-spin states are split by the quadrupole interaction into doublets for nuclei with spin , possessing a non-zero quadrupole moment . The magnitude of the splitting, expressed in terms of the frequency , is determined by Slichter92
| (2) |
Since the principal component of EFG is aligned along the axis, we set
| (3) |
As the asymmetry parameter of the quadrupole interaction is neglected, the Hamiltonian describing the splitting of the nuclear-spin states is CommentQZHam
| (4) |
where is the gyromagnetic ratio. The first term of the Hamiltonian describes the Zeeman interaction and the second term is the quadrupole interaction. The matrix of this Hamiltonian using the basis states is diagonalized to obtain the energies of the nuclear spins under the influence of the Zeeman and quadrupole interactions. For the calculations, we use the values of , , and collected in Table 1.
| Isotope | (rad s-1 T-1) | (mbar) | (statC cm-3) | |
|---|---|---|---|---|
| 69Ga | 3/2 | 171 | ||
| 71Ga | 3/2 | 107 | ||
| 75As | 3/2 | 314 | ||
| 113In | 9/2 | 759 | ||
| 115In | 9/2 | 770 |
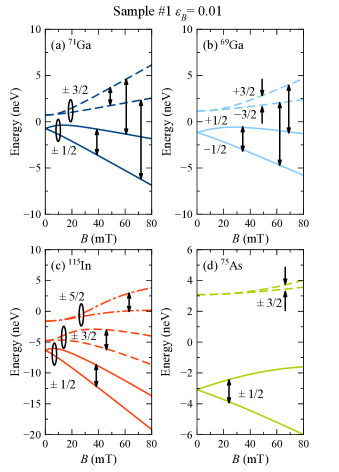
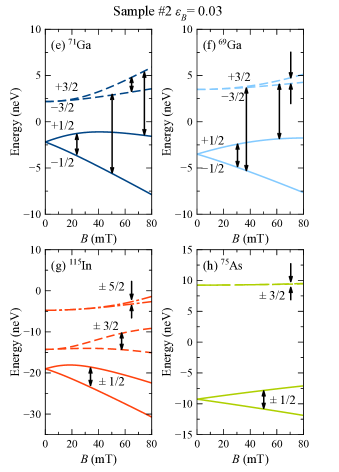
The spin splittings calculated for the Ga, As, and In nuclei in the QDs under study are shown in Fig. 5. One can see that the resonances for transitions between the split-off states are observed at larger magnetic fields than those for the states. Besides, the resonances at a given frequency for the split-off states are shifted to larger magnetic fields in sample 2 relative to those in sample 1 due to the larger .
II.2.2 Fitting of the resonances
The shape of the resonances contributing to the Hanle curves is determined by their physics origin. Under action of optical pumping with non modulated polarization, DNP appears aligned parallel to the external magnetic field. The alternating magnetic field from the radio-frequency excitation close to the resonant frequency of nuclear spin transitions, applied along the optical axis, tilts this nuclear-spin magnetization. When scanning the external field around the resonance, the tilting angle changes from to taking on the value at the resonance. Consequently, the sign of the projection of the nuclear-spin magnetization onto the axis of external magnetic field changes while scanning through the resonance. This results in a dispersion like singularity in the Hanle curve. Such resonant profiles were previously observed in different systems and discussed in literature Paget-OO ; SalisPRL01 ; SalisPRB01 ; EickhoffPRB02 .
In contrast to non modulated excitation, optical pumping with circular polarization modulated at a frequency close to a resonance in a QD ensemble leads to a nuclear-spin magnetization aligned perpendicular to the external magnetic field. This DNP component is created by nuclear spins, which coherently precess in the external magnetic field. Synchronization of the precession of the DNP field with the modulated Knight field maintains the electron-spin polarization. The latter results in positive peaks on the Hanle curve. These resonances can be observed outside the electronic peak ( peak) in the Hanle curve given by pure electronic polarization CherbuninPRB11 . Analysis of our experimental data shows that all the resonances must be modeled by positive peaks rather than the dispersion like curves for which we used Gaussians.
The resonances corresponding to the transitions overlap so that their phenomenological analysis does not allow us to derive definite conclusions about their nature. To simplify the fit of experimental data, we also used Gaussians for their modeling Note-Yugova . So, it is assumed that each Hanle curve is a superposition of Gaussian peaks centered near the NMR positions calculated for each type of nuclei. Besides, the Hanle curve is contributed by an electronic peak ( peak) observed in absence of DNP. The shape of this peak is determined experimentally by measuring the Hanle curve using an amplitude modulation of the excitation with a large ratio of dark to bright intervals. As shown in Ref. CherbuninPRB11, , DNP is strongly suppressed under such experimental conditions.
The calculation of splittings described above allows us to determine the magnetic-field positions of nuclear-spin resonances at each particular modulation frequency and, thus, to fit the Hanle curves. The fitting parameters are the width and the amplitude of the Gaussians. The magnetic-field position of the resonances is taken, at the first step, from the modeling (see Fig. 5) and then slightly varied to obtain the best fit to the experiment. For more precise determination of the resonance positions, a set of Hanle curves measured with different phase shifts between the polarization modulation and the RF field is analyzed. The resonance positions are found to be close to those obtained from the modeling. However, the widths of the resonances are much larger than those typically observed in standard NMR. The origin of this broadening of the resonances will be discussed in the next section.
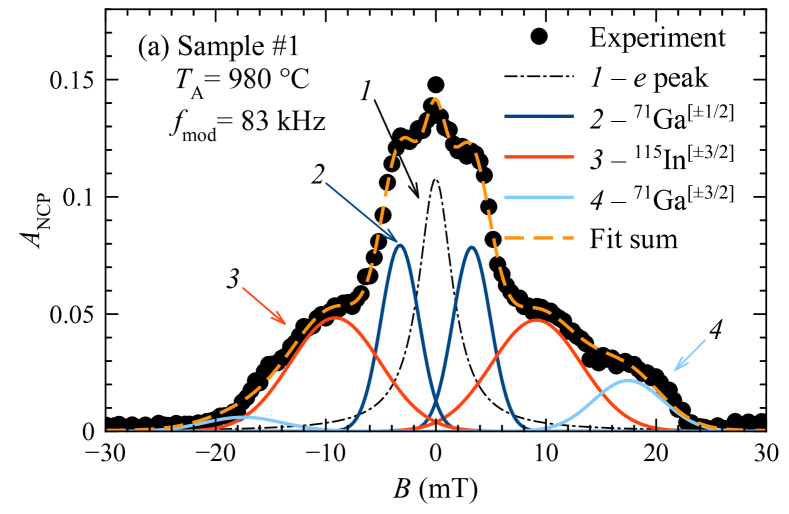
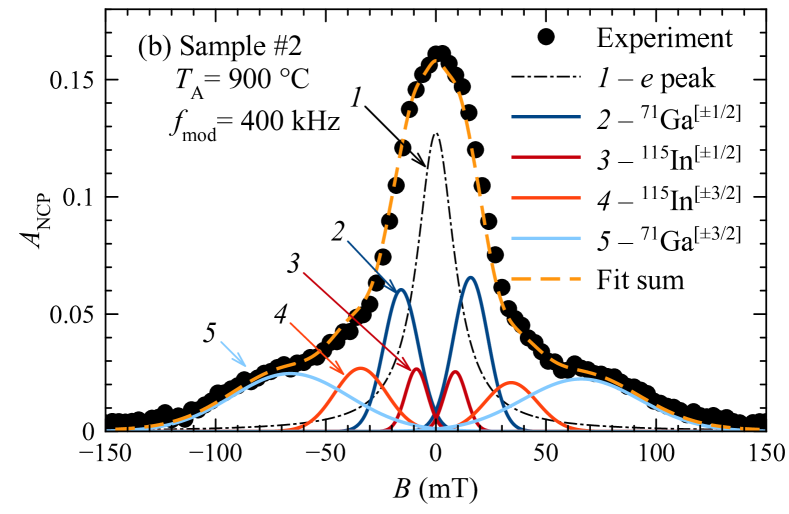
Examples of deconvolutions of the Hanle curves into Gaussian-like resonances are given in Fig. 6. The figure shows the Hanle curves measured at moderate modulation frequencies when only the transitions and contribute to the curves. As one can see, the strongly broadened resonances overlap. The central part of the Hanle curve for sample 1 can be well modeled by the sole contribution of the transitions of 71Ga isotope. In the Hanle curve of sample 2, contributions of transitions in the In nuclei can be also resolved. The wide part of Hanle curves is given by the transitions of the In and Ga nuclei. The relative amplitude of these resonances is found to be very sensitive to the experimental conditions, in particular, to the phase shift and does not reflect the content of In and Ga nuclei in the QDs. For example, although the In content is larger in sample 2, the respective resonance of the In nuclei gives rise to a stronger peak in the Hanle curve of sample 1 for the experimental conditions used for recording the data in Fig. 6.
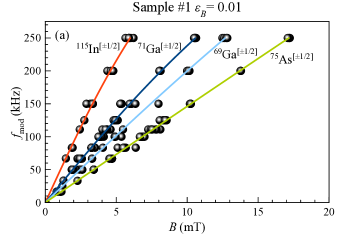
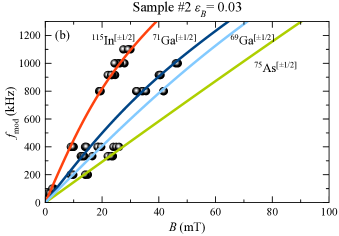
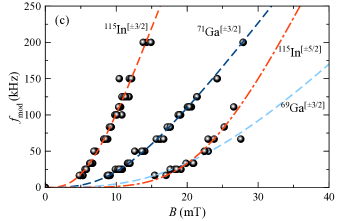
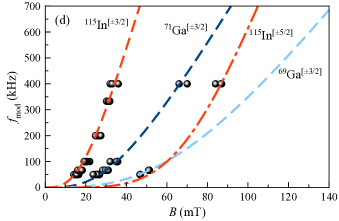
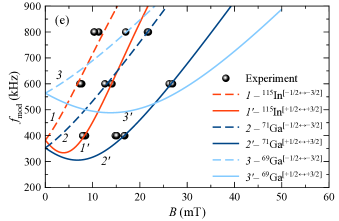
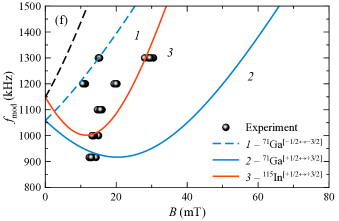
A comparison of the resonance positions obtained from the experiment with those obtained from the calculation of the Zeeman splittings of the nuclear-spin states is shown in Fig. 7. Figures 7(a)–7(d) demonstrate the data for the observed transitions , , and . Variations of the phase shift between the polarization modulation and the RF field slightly change the resonance positions. This is reflected in some horizontal spread of the experimental data in the figures. Figures 7(e) and 7(f) show similar data for the transitions and . The resonance frequencies for these transitions can be determined only with less accuracy. However, the Hanle curve cannot be successfully described if these resonances are neglected.
The results obtained show that, in spite of the large broadening of the resonances, most of them can be identified and their behavior can be described by a simple model containing only one free parameter, . The values of this parameter obtained from experiment for the samples under study are very close to those calculated (see Sec. II.2.1).
II.2.3 Width of resonances and its relation to strain
The fitting of the Hanle curves by sums of resonant peaks (see Figs. 6 and 7) has revealed the large widths of the resonances, which are considerably broader than those observed for quantum wells SalisPRL01 ; SalisPRB01 ; EickhoffPRB02 . Particularly, large widths are observed for the peaks corresponding to the transitions and . These widths are about an order of magnitude larger than those caused by random dipole-dipole fields (fraction of mT) or by the Knight field (of about mT in sample 1, see Ref. [KuznetsovaPRB13, ]). Variation of these fields has been considered in Ref. [UrbaszekRMP13, ] as the origin of broadening the NMR resonances in single QDs.
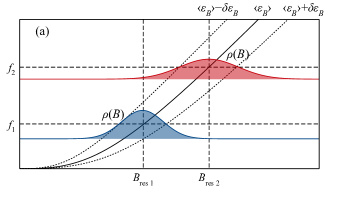
We assume that a more broader effect on the resonance broadening originates from the spread of strain causing a spread of the quadrupole splittings of the nuclear-spin states. The spread can be present in each individual QD [ChekhovichNatNano12 ] and in the QD ensemble as a whole. The Zeeman splitting of the nuclear-spin states strongly depends on the biaxial strain. As one can see from Figs. 7(a)–7(e), the splitting in sample 2 with large strain is smaller than that in sample 1 for the same magnetic field. At a fixed resonance frequency, each particular magnitude of corresponds to a unique magnitude of magnetic field, , at which the resonance is observed. Correspondingly, the spread of strain gives rise to a spread of resonant magnetic fields as illustrated in Fig. 8(a). There examples of resonance profiles, , are shown, which describe the probability of NMR as a function of magnetic field at a given frequency. As seen, the profiles are shifted to higher magnetic fields and become broader with increasing frequency which qualitatively explains the experimental observations.
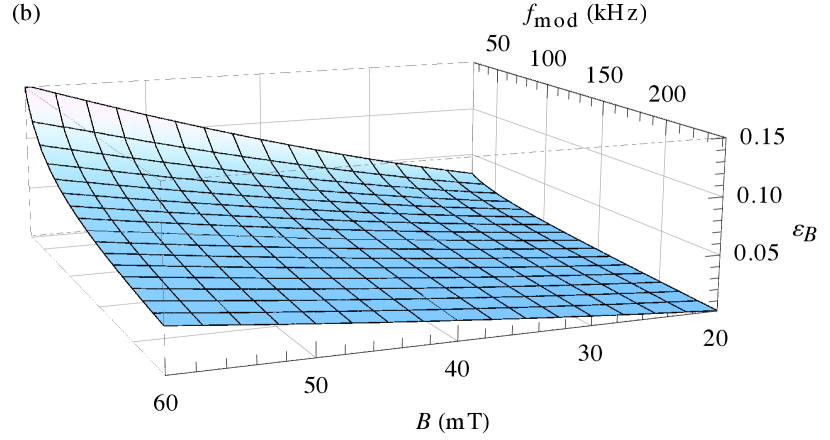
The shape of the resonance profiles should be unambiguously related to the function describing the spread of biaxial strain in the structure. To determine the relation between the functions and ), we have calculated the magnetic-field dependence of the splitting of the nuclear-spin states for the Ga and In nuclei at different values of . Results of these calculations for the 71Ga isotope are shown in Fig. 8(b). As one can see, there is a monotonic, almost linear, dependence, , for modulation frequencies fixed in the range used in experiment. This allows one to interconnect the two probability distributions:
| (5) |
where the derivative can be easily calculated. Figure 8(b) shows that the derivative weakly depends on and is a function of .
The resonance peaks, , obtained from the experiments and modeled by Gaussians, can be treated except for some scaling factor, as the probability distribution of NMR at a given frequency. Using the equation given above one can transform into . Because the spread of strain does not depend on modulation frequency, the resonant peaks measured at different frequencies and transformed into functions of should be very similar to each other, if the broadening is actually due to this spread.
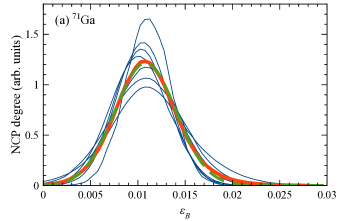
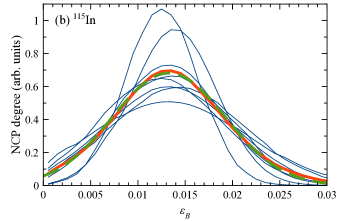
The results of such a processing of our experimental data for the transitions of the 71Ga and 115In nuclei are shown in Fig. 9. As seen, variation of the modulation frequency over a wide range from to kHz weakly affects the positions and the widths of the resonance profiles . Note, that the width of increases several times with the modulation-frequency The relatively small variations of the parameters of the experimentally determined resonance profiles shown in Fig. 9 are probably caused by experimental errors and some uncertainty in the fitting procedure. There is also some difference in the averaged positions and widths of the for the nuclei 71Ga and 115In.
To model the function in a single QD, we perform a simple calculation based on the model described in Sec. II.2.1. Using the distribution of the In fraction, , and the electron density distribution, , one can estimate the distribution of the principal component of the EFG tensor by
| (6) |
To obtain equivalent distributions for the other isotopes one should replace by (for Ga) and by (for As) in Eq. (6).
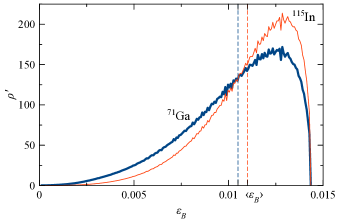
The resulting distributions for the In and Ga nuclei are shown in Fig. 10. As one can see, the distributions are relatively wide, which supports the assumption of strain non-homogeneity within the QD as primary source of the resonance broadening shown in Fig. 9. There is a strong asymmetry of the distribution with an abrupt right edge, which corresponds to the maximal value of in the middle of the QD. The experimentally obtained distribution shown in Fig. 9 is more symmetric, which is possibly due to smoothing of the distribution in the QD ensemble. There is also some difference in the values for 71Ga and 115In averaged over the corresponding statistics. The In content is maximal in the QD middle where the EFG is also maximal so that the distribution for the In nuclei is shifted to larger values of relative to those for the Ga nuclei. This result correlates well with the experimental observations, see Fig. 9.
The broadening of the resonance peaks for the transitions requires some further consideration. This broadening is considerably smaller than that for the transitions . However, it is still much larger than the one typically observed in solid state NMR Abragam . To understand the possible origin of this broadening we should consider the Zeeman splitting of the states in presence of quadrupole splitting. When the magnetic field is small and mostly perpendicular to the principal axis of the EFG, the splitting is given by PoundPR50
| (7) |
where is the Zeeman splitting of the states in absence of strain and is the quadrupole splitting of the nuclear-spin states into doublets corresponding to and . Clearly, when , the splitting is approximately twice larger than the Zeeman splitting and almost independent of the deformation. This means that the spread of cannot be responsible for the observed broadening. We have to assume that the broadening is caused by a deviation of the principle axis of the EFG from the direction orthogonal to the magnetic-field. One possible reason for that is an asymmetry of the QDs in the ensemble due to the statistical nature of the assembly of atoms in the QDs during the growth process. Another reason might be the inclination of the deformation axis at peripheral parts of the QDs BulutayPRB12 . Note that even a relatively small inclination of the axis may cause a remarkable shift of the resonance position. Indeed, when the EFG axis is parallel to the magnetic field (inclination is ), the splitting of the states becomes twice smaller and corresponds to the ordinary Zeeman splitting, . Therefore the spread of inclinations of the EFG axis in the QD ensemble can be responsible for the observed broadening of the resonances .
III Conclusion
To conclude, the obtained results demonstrate that resonant optical pumping of the electron-nuclear spin system in QDs subject to transverse magnetic fields is an efficient tool for studying transition between nuclear spin states split by a magnetic field. Using this method, we managed to experimentally detect a number of resonances of the In, Ga, and As nuclei in an inhomogeneous QD ensemble, namely those corresponding to the transitions between the , , and states as well as to the transitions between the and states.
The comparison of experimental data recorded on (In,Ga)As/GaAs QD samples annealed at different temperatures show that the resonant frequencies strongly depend on the strain of the crystal lattice in the QDs. The strain-induced EFG at the nuclear sites splits the nuclear spin states with non-zero quadrupole moment resulting in a remarkable modification of the NMR spectrum. Our model considering Zeeman splitting of the nuclear states in presence of quadrupolar interaction has been developed. It allows us to identify all the observed resonances. Essentially, the model having only one free parameter, , allows one to satisfactorily describe the magnetic field dependences of the resonant frequencies observed. The obtained values, for sample 1 annealed at °C and for sample 2 annealed at °C, are in good agreement with those obtained theoretically from the QD structure modeling.
We have also found that the resonances are broadened in QDs much stronger than in bulk crystals and quantum wells. In particular, this is valid for the split-off resonances , and . Our analysis shows that the main origin of the resonance broadening is related to the spread of the biaxial strain, . The value of the spread is of the order of itself.
Acknowledgments
This work was supported by the Deutsche Forschungsgemeinschaft, the BMBF QuaHL-Rep 16BQ1035, the EU FET-program SPANGL4Q, and by the Russian Ministry of Education and Science (contract No. 11.G34.31.0067 with SPbSU and leading scientist A. V. Kavokin).
References
- (1) A. Abragam, Principles of Nuclear Magnetism (Oxford University Press, London 1962).
- (2) G. Lampel, Phys. Rev. Lett. 20, 491 (1968).
- (3) V. G. Fleisher and I. A. Merkulov, Ch. 5, D. Paget and V. L. Berkovitz, Ch. 9 in Optical Orientation, ed. by B. P. Zakharchenya and F. Meier (North-Holland, Amsterdam, 1984).
- (4) V. K. Kalevich, K. V. Kavokin, and I. A. Merkulov, Ch. 11 in Spin Physics in Semiconductors, ed. by M. I. Dyakonov (Springer-Verlag, Berlin 2008).
- (5) A. I. Ekimov and V. I. Safarov, Pisma Zh. Eksp. Teor. Fiz. 15, 257 (1972) [Sov. Phys. JETP Lett. 15, 179 (1972)].
- (6) D. Paget, Phys. Rev. B 24, 3776 (1981).
- (7) D. Paget, Phys. Rev. B 25, 4444 (1982).
- (8) G. P. Flinn, R. T. Harley, M. J. Snelling, A. C. Tropper, and T. M. Kerr, J. Lumin. 45, 218 (1990).
- (9) V. K. Kalevich, V. L. Korenev, and O. M. Fedorova, Pisma Zh. Eksp. Teor. Fiz. 52, 964 (1990) [Sov. Phys. JETP Lett. 52, 349 (1990)].
- (10) V. K. Kalevich and V. L. Korenev, Appl. Magn. Res. 2, 397 (1991).
- (11) S. E. Barrett, R. Tycko, L. N. Pfeiffer, and K. W. West, Phys. Rev. Lett. 72, 1368 (1994).
- (12) M. Poggio and D. D. Awschalom, Appl. Phys. Lett. 86, 182103 (2005).
- (13) D. Gammon, S. W. Brown, E. S. Snow, T. A. Kennedy, D. S. Katzer, D. Park, Science 277, 85 (1997).
- (14) R. I. Dzhioev, B. P. Zakharchenya, V. L. Korenev, P. E. Pak, M. N. Tkachuk, D. A. Vinokurov, I. S. Tarasov, Pisma Zh. Eksp. Teor. Fiz. 68, 711 (1998) [JETP Lett. 68, 745 (1998)].
- (15) M. N. Makhonin, E. A. Chekhovich, P. Senellart, A. Lemaître, M. S. Skolnick, and A. I. Tartakovskii, Phys. Rev. B 82, 161309(R) (2010).
- (16) K. Flisinski, I. Ya. Gerlovin, I. V. Ignatiev, M. Yu. Petrov, S. Yu. Verbin, D. R. Yakovlev, D. Reuter, A. D. Wieck, and M. Bayer, Phys. Rev. B 82, 081308(R) (2010).
- (17) M. N. Makhonin, K. V. Kavokin, P. Senellart, A. Lemaître, A. J. Ramsay, M. S. Skolnick, and A. I. Tartakovskii, Nat. Mater. 10, 844 (2011).
- (18) E. A. Chekhovich, K. V. Kavokin, J. Puebla, A. B. Krysa, M. Hopkinson, A. D. Andreev, A M. Sanchez, R. Beanland, M. S. Skolnick, and A. I. Tartakovskii, Nat. Nanotechnol. 7, 646 (2012).
- (19) D. Gammon, Al. L. Efros, T. A. Kennedy, M. Rosen, D. S. Katzer, D. Park, S. W. Brown, V. L. Korenev, and I. A. Merkulov, Phys. Rev. Lett. 86, 5176 (2001).
- (20) P.-F. Braun, B. Urbaszek, T. Amand, X. Marie, O. Krebs, B. Eble, A. Lemaitre, and P. Voisin, Phys. Rev. B 74, 245306 (2006).
- (21) A. I. Tartakovskii, T. Wright, A. Russell, V. I. Fal’ko, A. B. Van’kov, J. Skiba-Szymanska, I. Drouzas, R. S. Kolodka, M S. Skolnick, P. W. Fry, A. Tahraoui, H.-Y. Liu, and M. Hopkinson Phys. Rev. Lett. 98, 026806 (2007).
- (22) P. Maletinsky, C. W. Lai, A. Badolato, and A. Imamoglu, Phys. Rev. B 75, 035409 (2007).
- (23) R. Oulton, A. Greilich, S. Yu. Verbin, R. V. Cherbunin, T. Auer, D. R. Yakovlev, M. Bayer, I. A. Merkulov, V. Stavarache, D. Reuter, and A. D. Wieck, Phys. Rev. Lett. 98,107401 (2007).
- (24) R. V. Cherbunin, S. Yu. Verbin, T. Auer, D. R. Yakovlev, D. Reuter, A. D. Wieck, I. Ya. Gerlovin, I. V. Ignatiev, D. V. Vishnevsky, and M. Bayer, Phys. Rev. B 80, 035326 (2009).
- (25) E. A. Chekhovich, M. N. Makhonin, K. V. Kavokin, A. B. Krysa, M. S. Skolnick, and A. I. Tartakovskii, Phys. Rev. Lett. 104, 066804 (2010).
- (26) O. Krebs, P. Maletinsky, T. Amand, B. Urbaszek, A. Lemaître, P. Voisin, X. Marie, and A. Imamoglu, Phys. Rev. Lett. 104, 056603 (2010).
- (27) B. Urbaszek, X.Marie, T. Amand, O. Krebs, P. Voisin, P. Malentinsky, A. Högele, and A. Imamoglu, Rev. Mod. Phys. 85, 79 (2013).
- (28) R. I. Dzhioev and V. L. Korenev, Phys. Rev. Lett. 99, 037401 (2007).
- (29) P. Maletinsky, M. Kroner and A. Imamoglu, Nat. Phys. 5, 407 (2009).
- (30) V. K. Kalevich, Fiz. Tverd. Tela (Leningrad) 28, 3462 (1986) [Sov. Phys. Solid State 28, 1947 (1986)].
- (31) J. M. Kikkawa and D. D. Aweschalom, Science 287, 473 (2000).
- (32) M. I. Dyakonov and V. I. Perel, Zh. Eksp. Teor. Fiz. 65, 362 (1973) [Sov. Phys. JETP 38, 177 (1974)].
- (33) V. K. Kalevich, V. D. Kulkov, and V. G. Fleisher, Fiz. Tverd. Tela (Leningrad) 22, 1208 (1980) [Sov. Phys. Solid State 22, 1208 (1980)].
- (34) V. K. Kalevich, V. D. Kulkov, and V. G. Fleisher, Fiz. Tverd. Tela (Leningrad) 23, 1524 (1981) [Sov. Phys. Solid State 23, 1524 (1981)].
- (35) V. K. Kalevich and V. G. Fleisher, Izv. Acad. Nauk. (USSR) 46, 498 (1982) [Bull. Acad. Sci. USSR Phys. Ser. 47, 5 (1983)].
- (36) V. K. Kalevich, B. P. Zakharchenya, Fiz. Tverd. Tela (St. Petersburg) 37, 3525 (1995) [Phys. Solid State 37, 1938 (1995)].
- (37) G. Salis, D. T. Fuchs, J. M. Kikkawa, D. D. Awschalom, Y. Ohno, and H. Ohno, Phys. Rev. Lett. 86, 2677 (2001).
- (38) G. Salis, D. D. Awschalom, Y. Ohno and H. Ohno, Phys. Rev. B 64, 195304 (2001).
- (39) M. Eickhoff, B. Lenzman, G. Flinn, and D. Suter, Phys. Rev. B 65, 125301 (2002).
- (40) R. V. Cherbunin, K. Flisinski, I. Ya. Gerlovin, I. V. Ignatiev, M. S. Kuznetsova, M. Yu. Petrov, D. R. Yakovlev, D. Reuter, A. D. Wieck, and M. Bayer, Phys. Rev. B 84, 041304 (2011).
- (41) W. Langbein, P. Borri, U. Woggon, V. Stavarache, D. Reuter, and A. D. Wieck, Phys. Rev. B 69, 161301(R) (2004).
- (42) S. Cortez, O. Krebs, S. Laurent, M. Senes, X. Marie, P. Voisin, R. Ferreira, G. Bastard, J.-M. Gérard, and T. Amand, Phys. Rev. Lett. 89, 207401 (2002).
- (43) A. Shabaev, E. A. Stinaff, A. S. Bracker, D. Gammon, Al. L. Efros, V. L. Korenev, and I. Merkulov, Phys. Rev. B 79, 035322 (2009).
- (44) I. V. Ignatiev, S. Yu. Verbin, I. Ya. Gerlovin, R. V. Cherbunin, and Y. Masumoto, Opt. Spektrosk. 106, 427 (2009); [Opt. Spektrosc. 106, 375 (2009)].
- (45) M. S. Kuznetsova, K. Flisinski, I. Ya. Gerlovin, I. V. Ignatiev, K. V. Kavokin, S. Yu. Verbin, D. R. Yakovlev, D. Reuter, A. D. Wieck, and M. Bayer Phys. Rev. B 87, 235320 (2013).
- (46) D. Paget, G. Lampel, B. Sapoval, and V. I. Safarov, Phys. Rev. B 15, 5780 (1977).
- (47) The magnetic component of the RF field is phase-shifted by some value relative to the phase of the RF generator. This shift is found to be dependent on the radio frequency.
- (48) The asymmetry of the Hanle curves, which is seen in Fig. 3, is a result of the well-known effect of hysteresis observed for the electron-nuclear spin system in bulk crystals Paget-OO as well as in QDs UrbaszekRMP13 .
- (49) M. Yu. Petrov, I. V. Ignatiev, S. V. Poltavtsev, A. Greilich, A. Bauschulte, D. R. Yakovlev, and M. Bayer, Phys. Rev. B 78, 045315 (2008).
- (50) C. Bulutay, Phys. Rev. B 85, 115313 (2012).
- (51) J. Even, F. Doré, C. Cornet, L. Pedesseau, A. Schliwa, and D. Bimberg, Appl. Phys. Lett. 91, 122112 (2007).
- (52) J. Even, F. Doré, C. Cornet, and L. Pedesseau, Phys. Rev. B 77, 085305 (2008).
- (53) R. G. Shulman, B. J. Wyluda, and P. W. Anderson, Phys. Rev. 107, 953 (1957).
- (54) R. K. Sundfors, Phys. Rev. B 10, 4244 (1974).
- (55) C. P. Slichter, Principles of Magnetic Resonance, 3rd ed. (Springer-Verlag, New York, 1992).
- (56) The Hamiltonian of the quadrupole interaction has a simple form in the intrinsic coordinate system of the EFG tensor. Since the principal axis of the EFG coincides with the structural axis, the quadrupole part of the total Hamiltonian written in the coordinate frame has the same form as in the intrinsic coordinate system.
- (57) P. Pyykkö, Mol. Phys. 106, 1965 (2008).
- (58) R. K. Harris, E. D. Becker, S. M. Cabral de Menezes, R. Goodfellow, and P. Granger, Pure Appl. Chem. 73, 1795 (2001).
- (59) I. A. Yugova (private communication). A theoretical analysis shows that, under strong enough optical pumping, the shape of the resonances for the transitions deviates from the dispersion like curve and resembles a Gaussian peak.
- (60) R. V. Pound, Phys. Rev. 79, 685 (1950).