Parkes full polarization spectra of OH masers - II. Galactic longitudes 240∘ to 350∘
Abstract
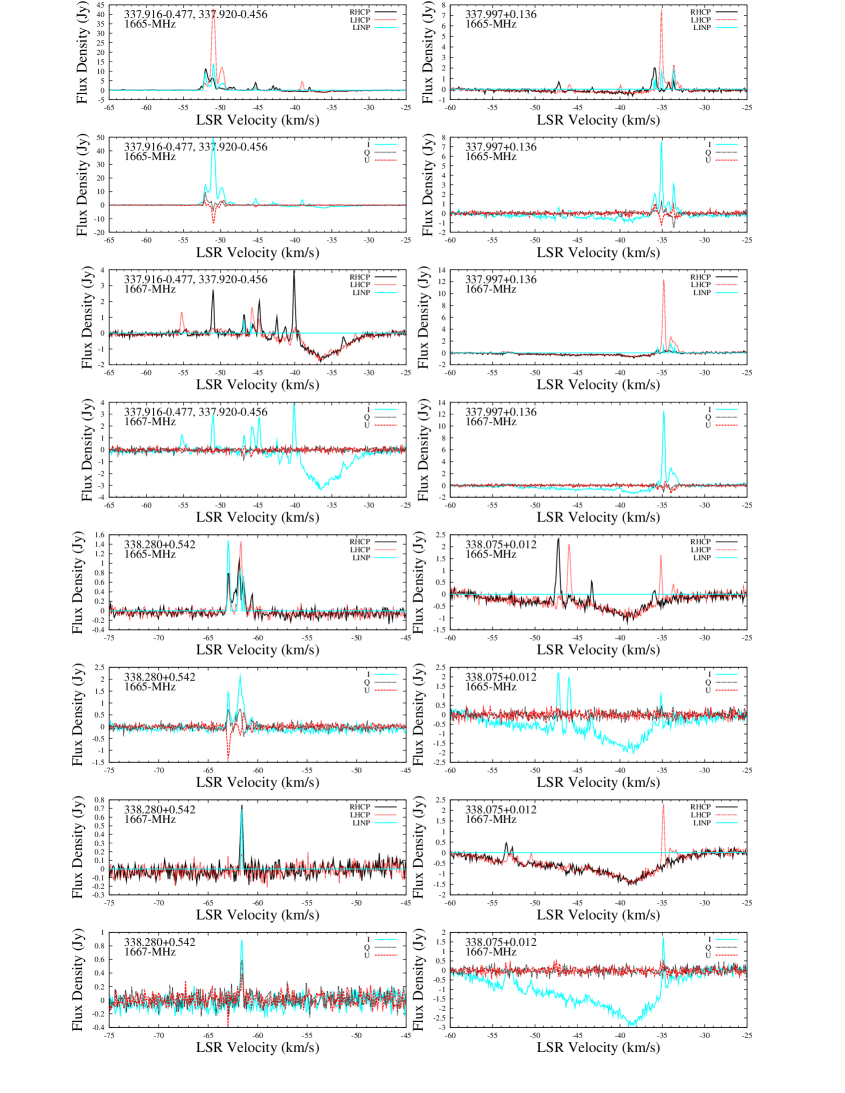
Full polarization measurements of 1665 and 1667-MHz OH masers at 261 sites of massive star formation have been made with the Parkes radio telescope. Here we present the resulting spectra for 157 southern sources, complementing our previously published 104 northerly sources. For most sites, these are the first measurements of linear polarization, with good spectral resolution and complete velocity coverage.
Our spectra exhibit the well-known predominance of highly circularly polarized features, interpreted as components of Zeeman patterns. Focusing on the generally weaker and rarer linear polarization, we found three examples of likely full Zeeman triplets (a linearly polarized component, straddled in velocity by components), adding to the solitary example previously reported. We also identify 40 examples of likely isolated components, contradicting past beliefs that components might be extremely rare. These were recognised at 20 sites where a feature with high linear polarization on one transition is accompanied on the other transition by a matching feature, at the same velocity and also with significant linear polarization.
Large velocity ranges are rare, but we find eight exceeding 25 , some of them indicating high velocity blue-shifted outflows. Variability was investigated on timescales of one year and over several decades. More than 20 sites (of 200) show high variability (intensity changes by factors of four or more) in some prominent features. Highly stable sites are extremely rare.
keywords:
masers - polarization - stars: formation - stars: massive - ISM: magnetic fields - ISM: molecules.1 Introduction
This paper completes a project to obtain full polarization spectra, at high velocity resolution, of masers at the 1665- and 1667-MHz transitions of OH in the southern sky accessible to the Parkes telescope. We focus exclusively on maser sites believed to be in star formation regions (SFRs), associated with high-mass young stellar objects (YSOs). We present the results for sources in the southern Galactic longitude range 240∘ to 350∘, thus complementing the previously published northern range 350∘ through the Galactic Centre to 40∘ (Caswell, Green & Phillips 2013, hereafter Paper I).
OH masers play a very special role in star formation studies by virtue of their remarkable polarization properties. The multiple narrow features commonly display prominent circular and linear polarization, sometimes approaching 100 per cent; this has long been recognised as the signature of magnetic fields where the masers arise, primarily caused by the Zeeman effect in fields of several milliGauss.
Catalogued OH masers in star formation regions now exceed several hundred, with especially good coverage in the southern sky, Our target list for the current Parkes observations is primarily the catalogue of Caswell (1998), supplemented by a few southern sources discovered since 1998. The catalogued positions, to arcsecond accuracy, were obtained with the Australia Telescope Compact Array (ATCA), mostly more than a decade ago. At that time, limited spectropolarimetric capability on the ATCA did not allow corresponding high quality spectra characterising each source. For some of our targets, known for several decades, Parkes spectra have been published, but limited to circular polarization (notably, with no linear polarization measurements), and dating from 25 years ago. Improved spectropolarimetric capabilities on the Parkes telescope now allow the present study with high spectral resolution and full polarization (simultaneous circular and linear) spectra at each catalogued OH position.
Based on the large sample of full polarization spectra obtained from combining our present results for 157 sources with the 104 northern sources from Paper I, we are able to make a good assessment of the incidence of linear polarization, enlightening us as to whether the occasional instances of extremely high linear polarization are explicable by the Zeeman effect. The results also cast light on more general puzzles of the physics of astronomical masers, including the relevance of magnetic beaming (Sections 6, 7) and the existence of co-propagation for the 1665 and 1667-MHz transitions (Sections 4.1, 6.1, 6.3).
Our long term objectives are to conduct detailed study of maser emission at each site, which can reveal not only remarkable clues to the kinematics and magnetic field structure around each newly formed massive star, but also the physical properties of density, molecular abundances, and temperature implied by the masing of the OH molecules. Such studies ultimately require the high spatial resolution provided by long baseline arrays (e.g. Wright et al. 2004a, b), and these will require large dedicated programs in the future. However, the present data allow selection of high priority sites that will most benefit from these studies. More readily achievable in the short term are measurements with shorter baseline arrays with superb spectropolarimeters that have recently become available. Notably, the ATCA in combination with CABB (Compact Array Broadband Backend) has recently demonstrated its capability (Green et al. 2012b) and will be a major contributor to follow-up of the present observations of southern sources. The reliability of magnetic field measurements from interpretation of Zeeman splitting will be improved relative to single dish measurements, and will be a focus of such studies. Complementing these with ATCA studies of 6-GHz transitions of excited-state OH will further strengthen these interpretations.
2 Observations and data reduction
Paper I gave full details of the observing and reduction procedure. Here we summarize the key features. The observations were made with the Parkes 64-m radio telescope in two observing periods, 2004 November 23-27 and 2005 October 26-30 (project p484). The receiver accepted two orthogonal linear polarizations, followed by digital filters that restrict the processed signal to a 4-MHz bandpass before entering a correlator. The ‘Parkes multibeam correlator’ was used in a non-standard configuration, with the 32 x 1024 spectral channels concatenated to provide single-beam full Stokes polarimetry yielding four polarization products: auto-correlations from the orthogonal linear feeds, XX and YY, and real and imaginary parts of the cross-correlations, ReXY and ImXY, each with 8192 channels.
For each target, an observation of 10 min was made in most cases, but reduced to 4 min for some strong sources, and increased to 20 min for several weak sources.
Improved position determinations for two sources (298.262+0.739 and 326.780-0.241) were made with the ATCA 2005 March 28, conducted in a 6-km configuration, yielding position accuracy of 0.4 arcsec.
2.1 Spectral line reduction in asap
The ATNF program asap (ATNF Spectral line Analysis Package) was used for data reduction. The intensity calibration is relative to the source 1934-638, for which a total intensity at 1666 MHz of 14.16 Jy has been adopted, essentially the same scale as used in earlier work (Caswell & Haynes 1987a and references therein) where Hydra A was used as a calibrator with assumed flux density 36 Jy.
As described in Paper I, the recorded correlator outputs were
combined to generate
the Stokes parameters I (total intensity), Q and U (components of linear
polarization), and V (net circular polarization). For some purposes,
different representations of polarization are more illuminating, so we
also generated the two individual right and left hand circular
polarization components, RHCP and LHCP, (I+V)/2 and
(IV)/2 respectively; total linearly polarized intensity, subsequently
abbreviated to LINP when used quantitatively, where
LINP =; and linear polarization position angle
(ppa), where ppa = .
For graphical display of full polarization spectral data we present
the results as two panels of spectra for each transition, showing:
1. Spectra of RHCP and LHCP, overlaid with LINP.
2. Overlaid spectra of I with Q and U.
The presence of linear polarization is most readily seen on the Q and U
spectra. The value of LINP (derived from Q
and U as noted above) has a positive noise bias; for display
purposes, we have chosen to clip it at five times the rms
noise level, so that features with significant linear polarization are
clearly evident from comparing this plot with the plot of total
intensity.
The polarization position angle is a noisy quantity which we have chosen
not to show, but the plots of Q and U indicate it qualitatively,
noting that ppa = .
3 Results
| Source Name | Equatorial Coordinates | Refpos | Vel. range | Lin(5,7) | Refpol | m/OH | ||||||
| ( l, b ) | RA(2000) | Dec(2000) | ||||||||||
| ( ∘ ∘ ) | (h m s) | ( ∘ ’ ”) | () | (Jy) | (Jy) | (Jy) | (Jy) | |||||
| 240.316+0.071 | 07 44 51.98 | 24 07 42.4 | C98 | 62.5 | 69 | 1.0 | 0.27 | 1.0 | 0.27 | |||
| 263.250+0.514 | 08 48 47.80 | 42 54 28.8 | C98 | 6 | 16 | 0.5 | 0.5 | 0.5 | 0.55 | 176 | ||
| 284.3510.418 | 10 24 10.73 | 57 52 33.3 | C98, G12 | 4 | 9 | 1.5 | 1.2 | 2.0 | 1.3 | 5p | M | |
| 285.2630.050 | 10 31 29.87 | 58 02 18.0 | C98, G12 | 2 | 15 | 34 | 1.7 | 80 | 2.9 | Mc | ||
| 287.371+0.644 | 10 48 04.45 | 58 27 01.2 | C98, G12 | 5 | 1 | 1.5 | 2.3 | M | 45 | |||
| 290.374+1.661 | 11 12 18.10 | 58 46 20.3 | C98, G12 | 24.5 | 12 | 3.4 | 0.3 | 3.7 | 0.4 | 5p | M | 1/1.8 |
| 291.2740.709 | 11 11 53.44 | 61 18 23.4 | C04, G12 | 25 | 23.5 | 0.45 | M | 155 | ||||
| 291.5790.431 | 11 15 05.74 | 61 09 40.7 | C98, G12 | 10.5 | 16.5 | 1.4 | 1.2 | M | 1/1.4 | |||
| 291.6100.529 | 11 15 02.59 | 61 15 49.5 | C98, G12 | 16 | 22 | 10 | 2.7 | 10 | 2.7 | Mc | ||
| 291.6540.596 | 11 15 10.74 | 61 20 32.3 | G12 | 14 | 23 | 2.0 | 2.0 | M | ||||
| 294.5111.621 | 11 35 32.22 | 63 14 42.6 | C98, G12 | 20.5 | 9 | 37 | 0.85 | 32 | 0.85 | 5p; 7p | M | 1/4.5 |
| 297.6600.973 | 12 04 08.99 | 63 21 36.0 | C98 | 22 | 33 | 4.5 | 0.6 | 4.2 | 0.55 | 5P | c | |
| 298.262+0.739 | 12 11 47.74 | 61 46 20.6 | text | 29 | 26.5 | 1.2 | 1.3 | 0.15 | 11.2 | |||
| 299.013+0.128 | 12 17 24.66 | 62 29 03.7 | C98 | 19.5 | 24 | 1.0 | 1.0 | 5p | c | 8.0 | ||
| 300.5040.176 | 12 30 03.49 | 62 56 49.8 | C98 | 2 | 24 | 0.45 | 0.4 | c | 11.1 | |||
| 300.969+1.147 | 12 34 53.24 | 61 39 40.3 | C98 | 44.5 | 34.5 | 13.5 | 3.3 | 16 | 3.9 | Lc | 1/3.3 | |
| 301.1360.226 | 12 35 35.07 | 63 02 32.4 | C98 | 64 | 33 | 17 | 6.2 | 17 | 6.5 | 5p; 7p | c | 1/11 |
| 305.200+0.019 | 13 11 16.90 | 62 45 54.7 | C98 | 35 | 29 | 1.5 | 1.6 | 31 | ||||
| 305.202+0.208 | 13 11 10.61 | 62 34 37.8 | C98 | 43 | 42 | 1.5 | 1.5 | c | 60 | |||
| 305.208+0.206 | 13 11 13.78 | 62 34 41.1 | C98 | 44.5 | 32 | 21 | 33 | 30 | 27 | v | 13.3 | |
| 305.362+0.150 | 13 12 35.87 | 62 37 17.9 | C98 | 42 | 32 | 15 | 8.5 | 17 | 8.5 | 5p; 7p | c | 1/3.4 |
| 305.7990.245 | 13 16 43.32 | 62 58 32.9 | C98 | 37 | 32 | 2.7 | 1.2 | 3.0 | 1.3 | 5p; 7p | c | 1/5.4 |
| 306.3220.334 | 13 21 23.00 | 63 00 30.4 | C98 | 25 | 20 | 0.15 | 0.15 | 3.3 | ||||
| 307.8050.456 | 13 34 27.40 | 62 55 13.8 | C98 | 19 | 13 | 4.5 | 0.55 | 5.0 | 0.57 | 5P | ||
| 308.754+0.549 | 13 40 57.56 | 61 45 42.9 | C04 | 51 | 43 | 0.5 | 0.5 | 24 | ||||
| 308.918+0.123 | 13 43 01.67 | 62 08 51.9 | C98 | 70 | 47.5 | 42 | 8 | 51 | 8.8 | 5p; 7p | c | 1/1.2 |
| 309.3840.135 | 13 47 24.10 | 62 18 12.5 | C98 | 55.5 | 49 | 1.1 | 0.95 | 5P | c | 1.3 | ||
| 309.921+0.479 | 13 50 41.73 | 61 35 09.8 | C98 | 64 | 58 | 83 | 8.8 | 75 | 10 | 5p; 7P | c | 12 |
| 310.144+0.760 | 13 51 58.26 | 61 15 39.5 | C98 | 60 | 50 | 0.3 | 0.25 | 0.28 | 0.22 | 267 | ||
| 311.6430.380 | 14 06 38.76 | 61 58 24.0 | C98 | 15 | 50 | 8 | 4.4 | 8.9 | 4.7 | 5P; 7p | c | 1.2 |
| 311.94+0.14 | 14 07 48.7 | 61 23 22 | text | 42 | 40 | c | 1.0 | |||||
| 312.598+0.045 | 14 13 15.01 | 61 16 53.6 | C98 | 72 | 58 | 2.4 | 1.8 | 2.5 | 1.6 | 5p | c | 8.4 |
| 313.469+0.190 | 14 19 40.98 | 60 51 47.1 | C98 | 11 | 6 | 2.7 | 0.35 | 2.7 | 0.3 | 5p | c | 11 |
| 313.577+0.325 | 14 20 08.70 | 60 41 59.9 | C98 | 48 | 41 | 0.55 | 0.27 | 0.45 | 0.2 | 5P | 200 | |
| 313.7050.190 | 14 22 34.72 | 61 08 27.4 | C98 | 46 | 35.5 | 2.6 | 0.25 | 2.9 | 0.2 | 5p | 1/1.7 | |
| 313.7670.863 | 14 25 01.63 | 61 44 58.1 | C98 | 57 | 49 | 7 | 0.27 | 7.5 | 0.25 | 5P | 1.4 | |
| 314.320+0.112 | 14 26 26.34 | 60 38 31.6 | C98 | 75 | 44 | 0.5 | 0.35 | 0.65 | 0.3 | 5P | 57 | |
| 316.3590.362 | 14 43 11.00 | 60 17 15.3 | C98 | 4 | 5 | 0.95 | 0.75 | 111 | ||||
| 316.4120.308 | 14 43 23.34 | 60 13 00.0 | C98 | 9 | 7 | 0.4 | 0.5 | c | 20 | |||
| 316.6400.087 | 14 44 18.35 | 59 55 11.3 | C98 | 35 | 15 | 2.4 | 1.3 | 2.0 | 1.5 | 5p | c | 40 |
| 316.7630.012 | 14 44 56.34 | 59 48 00.8 | C98 | 40 | 35 | 0.8 | 0.8 | c | ||||
| 316.8110.057 | 14 45 26.34 | 59 49 15.4 | C98 | 46 | 40 | 27 | 0.7 | 30 | 0.7 | c | 1.7 | |
| 317.4290.561 | 14 51 37.62 | 60 00 20.2 | C98 | 22 | 26.5 | 6.7 | 3.7 | 7 | 3.9 | |||
| 318.0441.405 | 14 59 08.74 | 60 28 25.7 | C98 | 35 | 46 | 0.3 | 0.21 | 23 | ||||
| 318.050+0.087 | 14 53 42.69 | 59 08 52.6 | C98 | 54.5 | 49.5 | 7.8 | 5.6 | 6.6 | 10.5 | 5P; 7p | c | 1.7 |
| 318.9480.196 | 15 00 55.36 | 58 58 52.8 | C98 | 41.5 | 23 | 38 | 14 | 40 | 13 | 5p | c | 15 |
| 319.3980.012 | 15 03 17.41 | 58 36 12.2 | C98 | 14.5 | 1 | 0.45 | 0.2 | 0.4 | 0.25 | c | ||
| 319.8360.196 | 15 06 54.57 | 58 32 57.1 | C98 | 13 | 5 | 0.9 | 1.3 | 1.0 | 0.9 | c | 1/2.0 | |
| 320.1200.440 | 15 09 43.85 | 58 37 05.8 | C98 | 58 | 54 | 0.2 | ||||||
| 320.2320.284 | 15 09 51.96 | 58 25 38.3 | C98 | 70 | 59 | 9.7 | 6.8 | 10.8 | 7.0 | 5p; 7p | c | 4.6 |
| 321.0300.485 | 15 15 51.67 | 58 11 18.0 | C98 | 77 | 65 | 0.6 | 0.85 | 0.6 | 0.9 | 33 | ||
| 321.1480.529 | 15 16 48.39 | 58 09 50.2 | C98 | 67 | 60.5 | 1.7 | 1.7 | 5P | c | 5.3 | ||
| 322.158+0.636 | 15 18 34.62 | 56 38 25.6 | C98 | 65 | 43 | 35 | 36 | 0.4 | 5p | c | 8.3 | |
| 323.4590.079 | 15 29 19.36 | 56 31 21.4 | C98 | 72 | 64 | 12 | 5.8 | 12 | 5.5 | 5p | c | 1.4 |
| Source Name | Equatorial Coordinates | Refpos | Vel. range | Lin(5,7) | Refpol | m/OH | ||||||
| ( l, b ) | RA(2000) | Dec(2000) | ||||||||||
| ( ∘ ∘ ) | (h m s) | ( ∘ ’ ”) | () | (Jy) | (Jy) | (Jy) | (Jy) | |||||
| 323.7400.263 | 15 31 45.49 | 56 30 50.7 | C98 | 80.5 | 37 | 1.9 | 3.3 | 4.2 | 3.5 | 5P; 7p | 762 | |
| 324.200+0.121 | 15 32 52.92 | 55 56 07.5 | C98 | 94 | 83.5 | 12.5 | 12.5 | 15 | 14 | 5P; 7p | c | |
| 324.716+0.342 | 15 34 57.42 | 55 27 24.0 | C98 | 56 | 44 | 2.7 | 2.2 | 5P | 3.7 | |||
| 326.670+0.554 | 15 44 57.21 | 54 07 12.7 | C98 | 41 | 40 | 1.4 | 1.8 | 5p | ||||
| 326.7800.241 | 15 48 55.16 | 54 40 37.9 | text | 66 | 57 | 3.0 | 2.5 | 5p | c | |||
| 327.120+0.511 | 15 47 32.82 | 53 52 39.4 | C98 | 88 | 80 | 14 | 2.8 | 14 | 3.1 | 5P; 7p | c | 3.9 |
| 327.2910.578 | 15 53 07.78 | 54 37 06.8 | C98 | 72.5 | 37.5 | 7.5 | 2.0 | 8 | 1.8 | 5P | c | 1/2.7 |
| 327.402+0.444 | 15 49 19.68 | 53 45 14.3 | C98 | 86 | 73 | 2.9 | 0.45 | 1.7 | 0.45 | 5P; 7P | c | 34 |
| 328.2370.547 | 15 57 58.26 | 53 59 22.5 | C98 | 47 | 23 | 7.5 | 0.4 | 8 | 0.4 | 5p | c | 175 |
| 328.2540.532 | 15 57 59.80 | 53 57 59.6 | C98 | 58 | 31 | 15 | 9.5 | 15 | 9.2 | 5p | c | 27 |
| 328.307+0.430 | 15 54 06.48 | 53 11 40.3 | C98 | 94 | 88.5 | 22 | 0.35 | 22 | 0.35 | 5p | c | |
| 328.809+0.633 | 15 55 48.55 | 52 43 05.6 | C98 | 49.5 | 33.5 | 110 | 8.5 | 110 | 7.8 | 5p; 7p | c | 3.2 |
| 329.0290.205 | 16 00 31.79 | 53 12 49.8 | C98 | 42 | 36 | 18.5 | 5.0 | 19 | 5.9 | 5p; 7p | c | 6.3 |
| 329.0290.200 | 16 00 30.38 | 53 12 35.5 | C98 | 40 | 37 | 3.3 | 3.3 | c | ||||
| 329.0310.198 | 16 00 30.32 | 53 12 27.8 | C98 | 48 | 45 | 1.0 | 1.0 | c | 30 | |||
| 329.0660.308 | 16 01 09.94 | 53 16 02.9 | C98 | 44 | 42.5 | 5.3 | 1.7 | 4.3 | 1.7 | ”5p, 7p” | c | 3.5 |
| 329.1830.314 | 16 01 47.02 | 53 11 43.7 | C98 | 58 | 46.5 | 5.9 | 3.0 | 6.5 | 3.4 | 5p | c | 1.7 |
| 329.339+0.148 | 16 00 33.15 | 52 44 39.8 | C01 | 108 | 97 | 0.25 | 0.25 | 100 | ||||
| 329.4050.459 | 16 03 32.15 | 53 09 31.0 | C98 | 76 | 67 | 9.4 | 14.2 | 8.8 | 14.2 | 5p; 7p | c | 3.6 |
| 330.8780.367 | 16 10 20.01 | 52 06 07.7 | C98 | 74.5 | 50 | 440 | 82 | 530 | 88 | 5p; 7p | c | 1/500 |
| 330.9530.182 | 16 09 52.38 | 51 54 57.3 | C98, text | 90 | 87 | 7.3 | 7.3 | 5P | Lc | 1.0 | ||
| 330.9540.182 | 16 09 52.60 | 51 54 53.7 | C98, text | 102 | 80 | 43 | 22 | 45 | 23 | 5p; 7p | Lc | 1/64 |
| 331.1320.244 | 16 10 59.72 | 51 50 22.7 | C98 | 95 | 88 | 15 | 2.3 | 15 | 3.4 | 5p; 7p | c | 2.0 |
| 331.2780.188 | 16 11 26.57 | 51 41 56.5 | C98 | 92 | 78.5 | 75 | 5.0 | 100 | 4.8 | 5p; 7p | c | 1.3 |
| 331.3420.346 | 16 12 26.46 | 51 46 16.3 | C98 | 67.5 | 64 | 8.0 | 4.6 | 10.5 | 5.5 | 5p; 7P | c | 10 |
| 331.4420.186 | 16 12 12.41 | 51 35 09.5 | C98 | 84 | 82 | 0.8 | 0.8 | 87 | ||||
| 331.5120.103 | 16 12 10.12 | 51 28 37.7 | C98 | 94 | 85 | 82 | 17 | 98 | 17 | 5p | c | |
| 331.5420.066 | 16 12 09.05 | 51 25 47.2 | C98 | 87 | 81.5 | 4 | 4 | c | 1.75 | |||
| 331.5430.066 | 16 12 09.16 | 51 25 45.3 | C98 | 86 | 85 | c | ||||||
| 331.5560.121 | 16 12 27.19 | 51 27 38.1 | C98 | 103 | 96 | 0.9 | 67 | |||||
| 332.295+2.280 | 16 05 41.72 | 49 11 30.5 | C98 | 41.5 | 6 | 1.6 | 2.4 | 1.6 | 2.2 | 5p; 7P | 61 | |
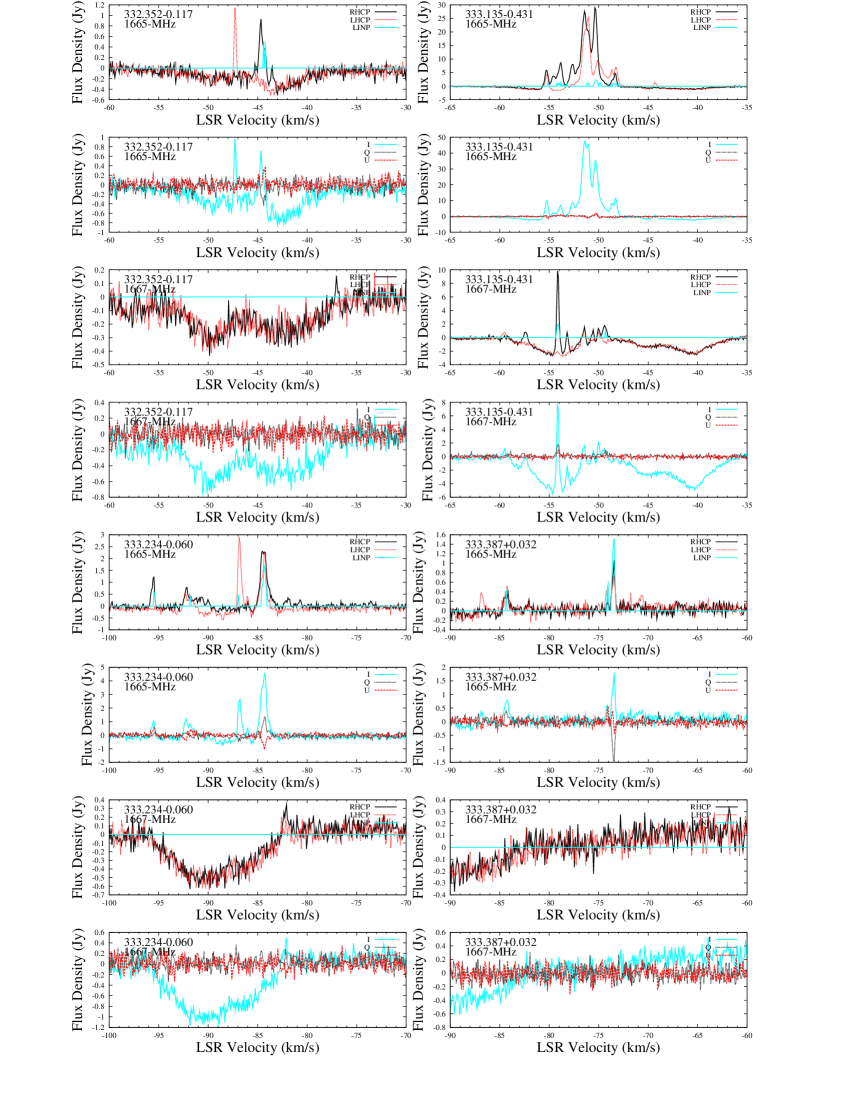
| 332.3520.117 | 16 16 07.16 | 50 54 30.4 | C98 | 52 | 42 | 1.7 | 1.3 | 5p | 3.9 | |||
| 332.7260.621 | 16 20 03.02 | 51 00 32.1 | C98 | 50 | 44 | 1.2 | 2.3 | 0.9 | 2.1 | 7p | c | 2.6 |
| 332.8240.548 | 16 20 10.23 | 50 53 18.1 | C98 | 59 | 52.5 | 1.6 | 1.7 | |||||
| 333.1350.431 | 16 21 02.97 | 50 35 10.1 | C98 | 60 | 44 | 29 | 12.5 | 30 | 13 | 5p | c | 1/30 |
| 333.2340.060 | 16 19 50.90 | 50 15 10.0 | C98 | 96 | 80.5 | 3.0 | 0.4 | 3.3 | 0.4 | 5P | c | 1/3.0 |
| 333.315+0.105 | 16 19 29.00 | 50 04 41.2 | C98 | 48 | 45 | 0.9 | 0.2 | 0.9 | 0.2 | 5P | 20 | |
| 333.387+0.032 | 16 20 07.58 | 50 04 47.4 | C98 | 75 | 70.5 | 1.0 | 1.0 | 5P | 3.0 | |||
| 333.4660.164 | 16 21 20.19 | 50 09 48.2 | C98 | 46 | 36.5 | 2.8 | 1.5 | 2.7 | 1.5 | 5p | c | 12 |
| 333.6080.215 | 16 22 11.06 | 50 05 56.3 | C98 | 57.5 | 46 | 11 | 5 | 14 | 6 | c | ||
| 335.0600.427 | 16 29 23.13 | 49 12 26.9 | C98 | 48 | 32.5 | 0.7 | 0.5 | 0.8 | 0.3 | 5P; 7P | 62 | |
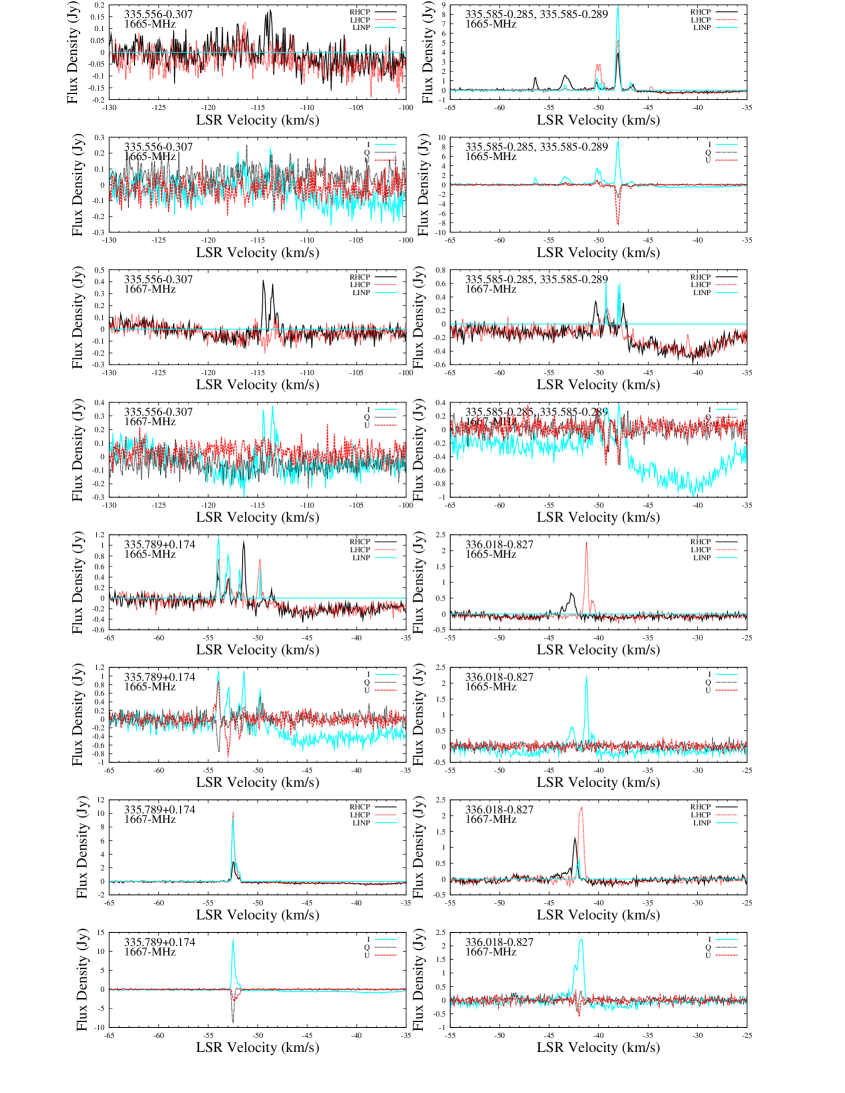
| 335.5560.307 | 16 30 56.00 | 48 45 51.0 | C98 | 115 | 113 | 0.2 | 0.4 | 0.25 | 0.4 | 62 | ||
| 335.5850.285 | 16 30 57.33 | 48 43 39.9 | C98 | 49 | 40.5 | 5.2 | 0.7 | 5.5 | 0.7 | 5P; 7P | c | 7.3 |
| 335.5850.289 | 16 30 58.63 | 48 43 50.8 | C98 | 59 | 49 | 2.6 | 0.5 | 2.6 | 0.5 | 5p | c | 27 |
| 335.789+0.174 | 16 29 47.37 | 48 15 51.1 | C98 | 55 | 45 | 1.2 | 10.0 | 1.1 | 10.1 | 5P; 7P | c | 20 |
| 336.0180.827 | 16 35 09.35 | 48 46 47.1 | C98 | 49 | 36 | 2.0 | 2.5 | 2.4 | 2.4 | 7p | 42 | |
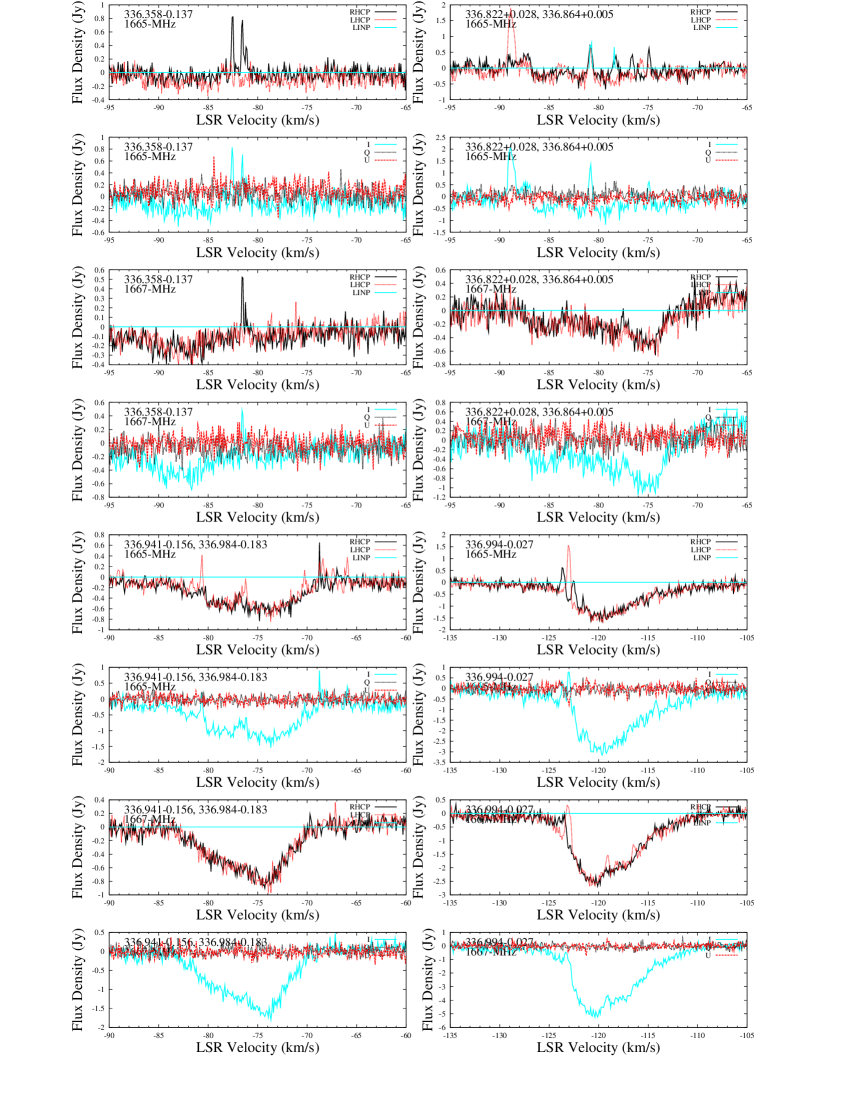
| 336.3580.137 | 16 33 29.16 | 48 03 43.7 | C98 | 84 | 80 | 0.8 | 0.6 | 0.7 | 0.55 | c | 16 | |
| 336.822+0.028 | 16 34 38.26 | 47 36 33.0 | C98 | 79 | 74 | 1.2 | 0.8 | c | 21 | |||
| 336.864+0.005 | 16 34 54.39 | 47 35 37.2 | C98 | 90 | 80 | 1.9 | 1.6 | 5p | 32 | |||
| 336.9410.156 | 16 35 55.22 | 47 38 45.7 | C98 | 71 | 65 | 0.6 | 0.5 | 0.7 | 0.4 | 33 | ||
| 336.9840.183 | 16 36 12.46 | 47 37 55.0 | C98 | 82 | 76 | 0.7 | 0.2 | 0.7 | 0.2 | 20 | ||
| 336.9940.027 | 16 35 33.95 | 47 31 11.4 | C98 | 125 | 114 | 1.7 | 1.3 | 2.0 | 1.3 | 5p | c | 15 |
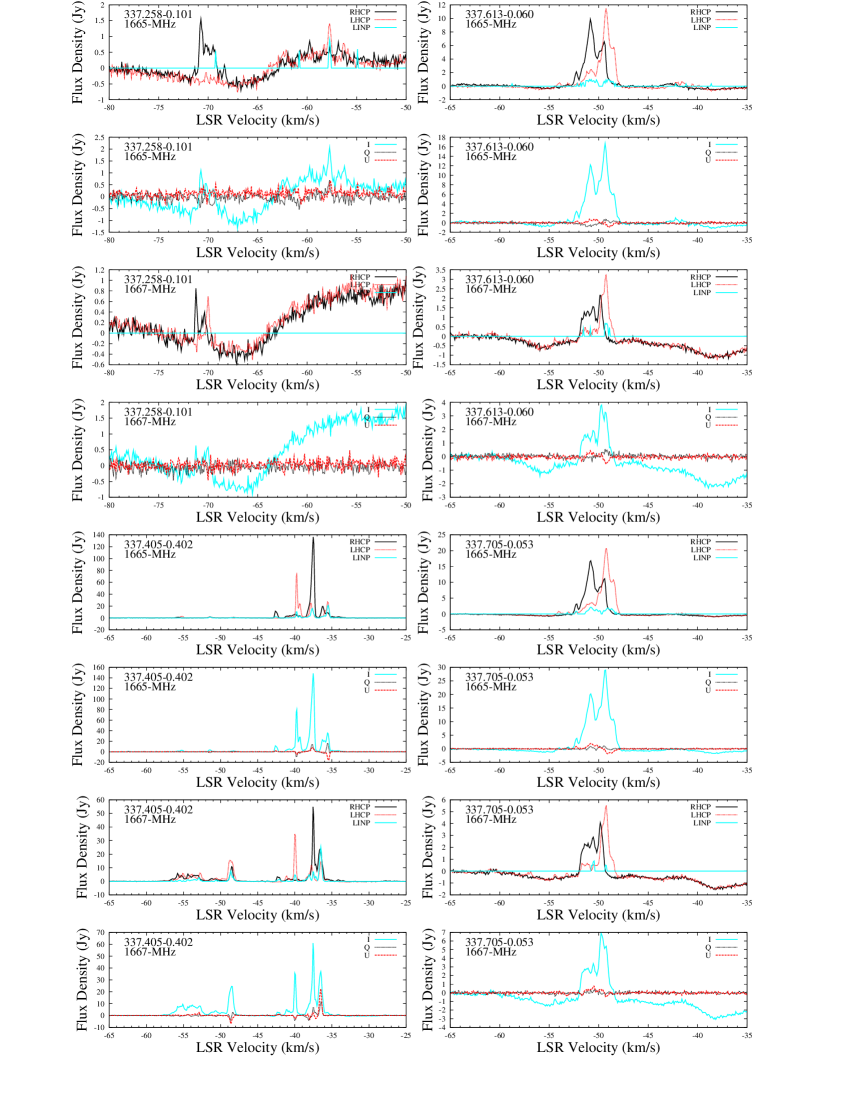
| 337.2580.101 | 16 36 56.36 | 47 22 26.8 | C98 | 72 | 55 | 2.0 | 1.0 | 1.9 | 1.1 | 4.0 | ||
| 337.4050.402 | 16 38 50.57 | 47 27 59.3 | text | 58.5 | 33 | 140 | 55 | 140 | 58 | 5P; 7P | c | 1/1.9 |
| 337.6130.060 | 16 38 09.50 | 47 04 59.8 | C98 | 45 | 39 | 0.8 | 0.8 | c | 25 | |||
| 337.7050.053 | 16 38 29.68 | 47 00 35.2 | C98 | 55 | 47.5 | 20 | 5.6 | 21 | 5.6 | Lcv | 8.1 | |
| 337.9160.477 | 16 41 10.43 | 47 08 03.1 | C98 | 63.5 | 31 | 36 | 4.0 | 43 | 4.0 | 5p | c | |
| 337.9200.456 | 16 41 06.07 | 47 07 02.4 | C98 | 40 | 38.5 | 3.0 | 5 | c | 6.0 | |||
| 337.997+0.136 | 16 38 48.48 | 46 39 57.6 | C98 | 41 | 32.5 | 7.0 | 13.0 | 7.5 | 12.5 | 5P; 7p | c | 1/2.2 |
| 338.075+0.012 | 16 39 39.05 | 46 41 28.0 | C98 | 54 | 43 | 2.9 | 0.9 | 2.9 | 0.9 | c | 4.5 | |
| Source Name | Equatorial Coordinates | Refpos | Vel. range | Lin(5,7) | Refpol | m/OH | ||||||
| ( l, b ) | RA(2000) | Dec(2000) | ||||||||||
| ( ∘ ∘ ) | (h m s) | ( ∘ ’ ”) | () | (Jy) | (Jy) | (Jy) | (Jy) | |||||
| 338.280+0.542 | 16 38 09.05 | 46 11 03.1 | C98 | 63.5 | 60 | 1.5 | 0.65 | 1.5 | 0.75 | 5P; 7P | c | 4.0 |
| 338.4610.245 | 16 42 15.53 | 46 34 18.7 | C98 | 61 | 53 | 7.4 | 2.1 | 8 | 2.1 | 5p; 7p | c | 8.7 |
| 338.472+0.289 | 16 39 58.88 | 46 12 35.7 | C98 | 41.5 | 31 | 3.0 | 0.9 | 2.9 | 0.75 | 5P | c | 1/3.3 |
| 338.6810.084 | 16 42 23.99 | 46 17 59.4 | C98 | 23.5 | 19 | 5.4 | 5.4 | 5P | c | |||
| 338.8750.084 | 16 43 08.23 | 46 09 12.8 | C98 | 43 | 33.5 | 2.3 | 4.5 | 2.4 | 5.3 | 5P; 7p | c | 3.8 |
| 338.925+0.557 | 16 40 33.57 | 45 41 37.2 | C98 | 65 | 55.5 | 17.5 | 0.9 | 19 | 1.0 | 5P; 7p | c | 1/2.4 |
| 339.0530.315 | 16 44 49.16 | 46 10 14.4 | C98 | 122 | 109 | 0.85 | 0.22 | 0.95 | 0.25 | 137 | ||
| 339.282+0.136 | 16 43 43.12 | 45 42 08.4 | C98 | 74 | 66.5 | 1.5 | 1.3 | 1.0 | 1.6 | 5p; 7P | 4.0 | |
| 339.6220.121 | 16 46 06.03 | 45 36 43.7 | C98 | 41 | 30 | 28 | 6.0 | 30 | 7.5 | 5P; 7P | c | 2.9 |
| 339.6821.207 | 16 51 06.21 | 46 15 57.8 | C98 | 27.5 | 22 | 2.9 | 3.8 | 2.6 | 3.9 | 7p | c | 18 |
| 339.8841.259 | 16 52 04.67 | 46 08 34.7 | C98 | 40.5 | 26.5 | 110 | 160 | 59 | 140 | 5P; 7p | c | 11 |
| 340.0540.244 | 16 48 13.88 | 45 21 45.1 | C98 | 59 | 48 | 37 | 30 | 38 | 47 | 5P; 7P | c | 1.0 |
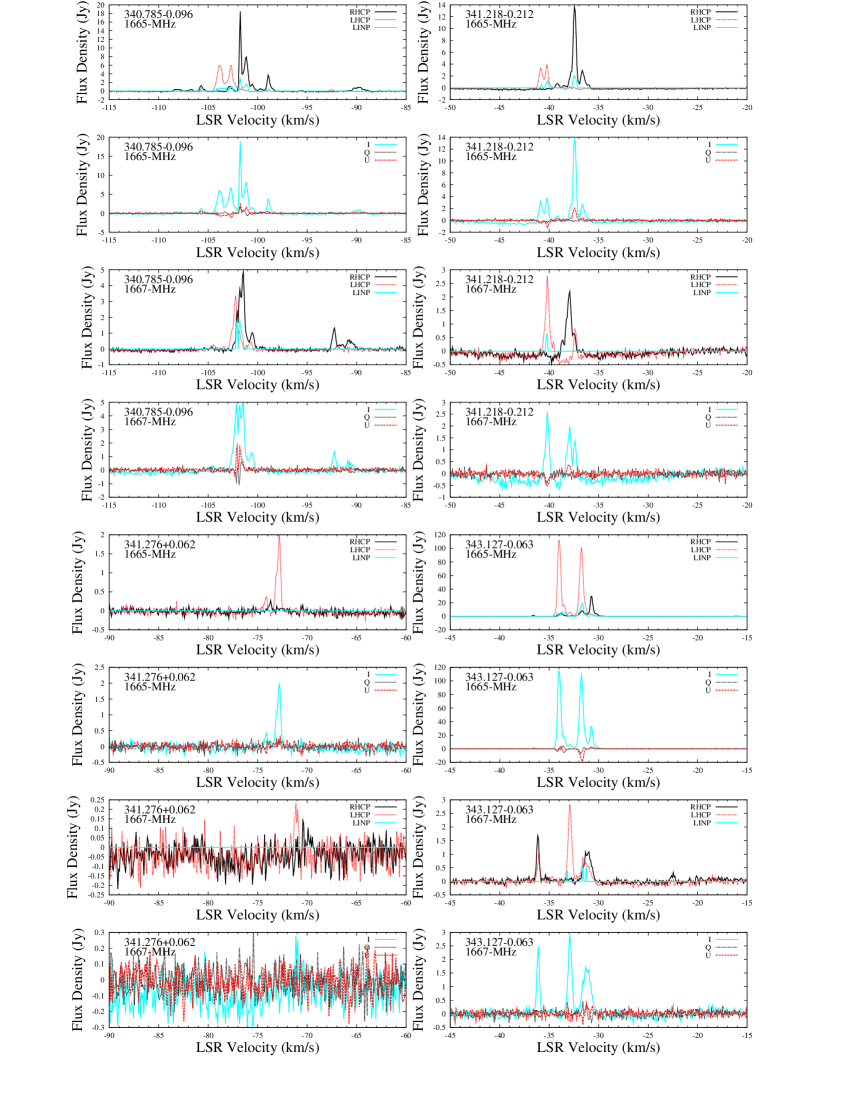
| 340.7850.096 | 16 50 14.81 | 44 42 26.9 | C98 | 108.5 | 88.5 | 17 | 4.7 | 19 | 5 | 5p; 7p | cv | 7.9 |
| 341.2180.212 | 16 52 17.84 | 44 26 52.5 | C98 | 41.5 | 35.5 | 12 | 2.0 | 14 | 2.8 | 5p; 7p | cv | 14 |
| 341.276+0.062 | 16 51 19.43 | 44 13 44.5 | C98 | 75 | 69 | 1.75 | 0.2 | 2.0 | 0.3 | c | 3.5 | |
| 343.1270.063 | 16 58 17.19 | 42 52 08.4 | C98 | 37 | 22 | 105 | 2.7 | 112 | 2.9 | 5p | cv | |
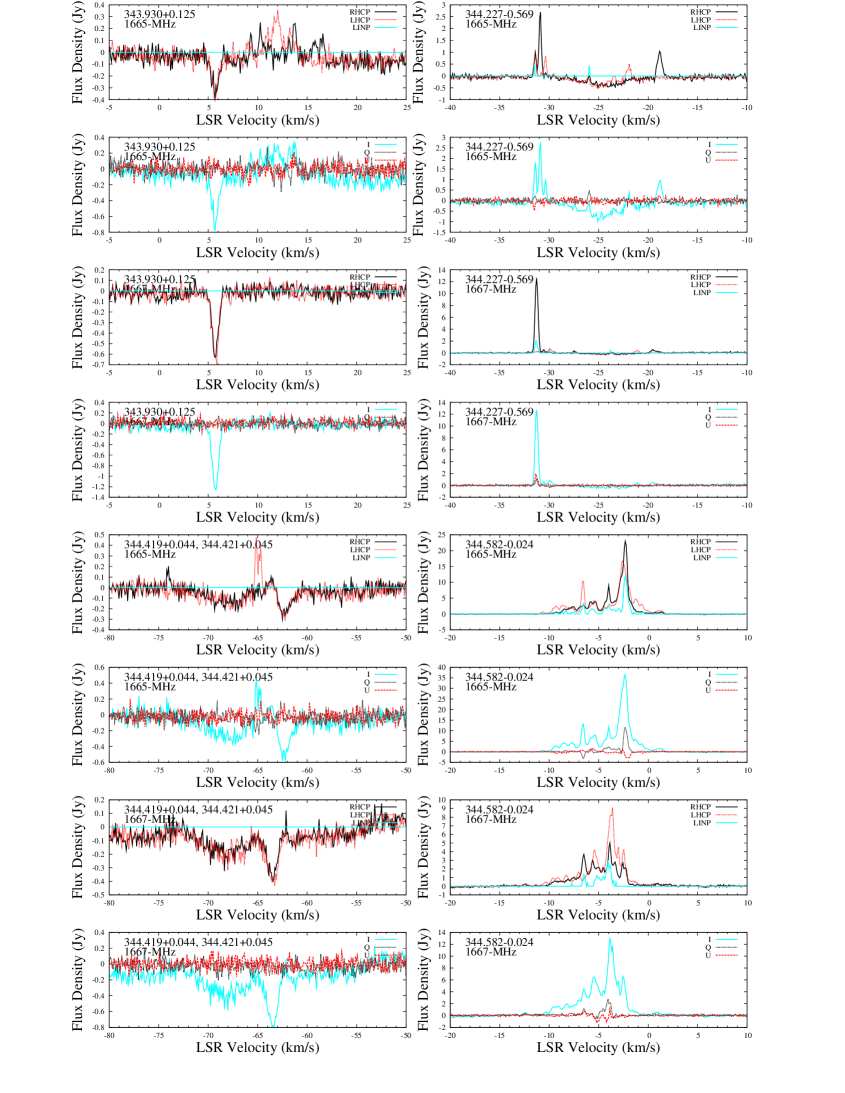
| 343.930+0.125 | 17 00 10.92 | 42 07 18.7 | C98 | 8 | 17 | 0.35 | 0.35 | c | 26 | |||
| 344.2270.569 | 17 04 07.81 | 42 18 40.2 | C98 | 32 | 18 | 1.8 | 8.8 | 2.7 | 12.5 | 5p; 7p | cv | 7.2 |
| 344.419+0.044 | 17 02 08.67 | 41 47 08.6 | C98 | 66 | 62 | 0.55 | 0.2 | 0.55 | c | 4.2 | ||
| 344.421+0.045 | 17 02 08.77 | 41 46 58.5 | text | 74.5 | 73.5 | 0.2 | c | 84 | ||||
| 344.5820.024 | 17 02 57.75 | 41 41 53.4 | C98 | 13 | 2 | 24 | 9.5 | 28 | 9.5 | 5p; 7p | cv | 1/8 |
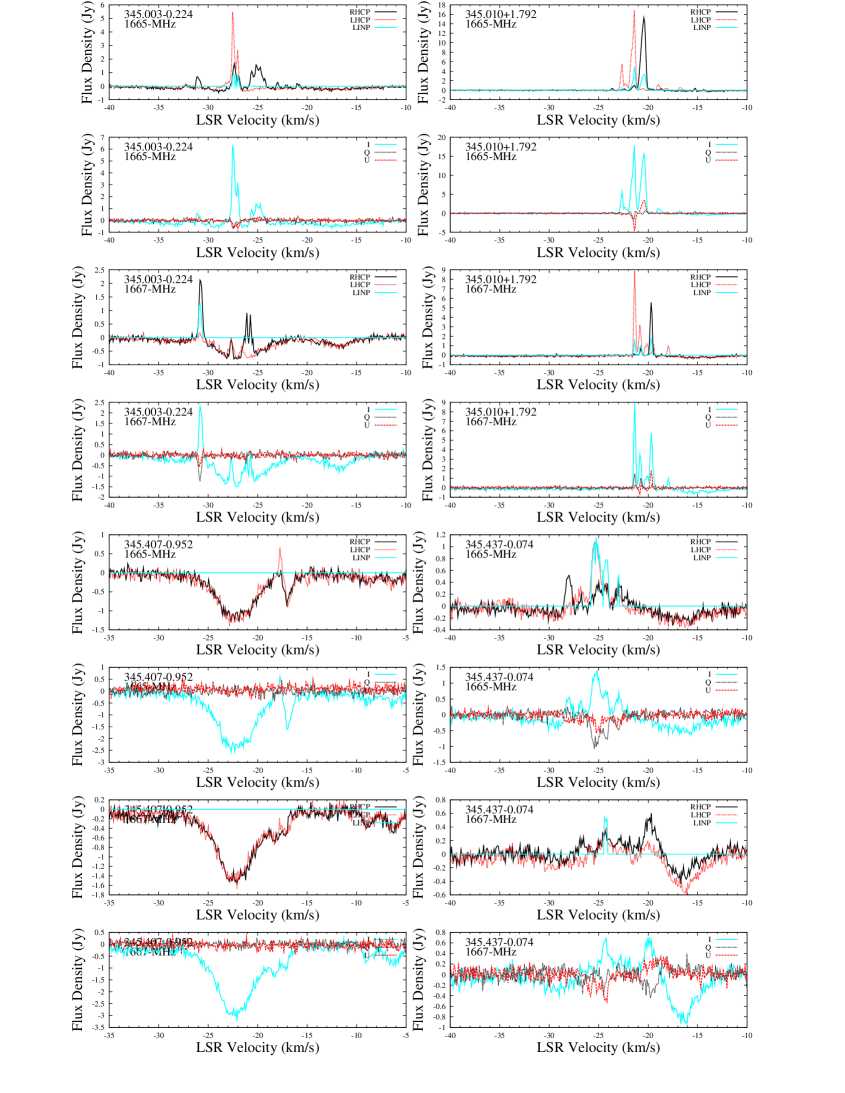
| 345.0030.224 | 17 05 11.26 | 41 29 06.7 | C98 | 32.5 | 20.5 | 7.5 | 2.4 | 5.5 | 2.2 | 5p; 7P | cv | 27 |
| 345.010+1.792 | 16 56 47.58 | 40 14 25.2 | C98 | 31 | 15 | 16 | 8 | 17 | 9 | 5p; 7p | cv | 15 |
| 345.4070.952 | 17 09 35.45 | 41 35 57.3 | C98 | 20 | 16.5 | 0.7 | 0.25 | 0.7 | 0.3 | c | 2.9 | |
| 345.4370.074 | 17 05 56.59 | 41 02 55.6 | C98 | 35 | 19 | 0.65 | 0.5 | 1.1 | 0.6 | 5P; 7P | ||
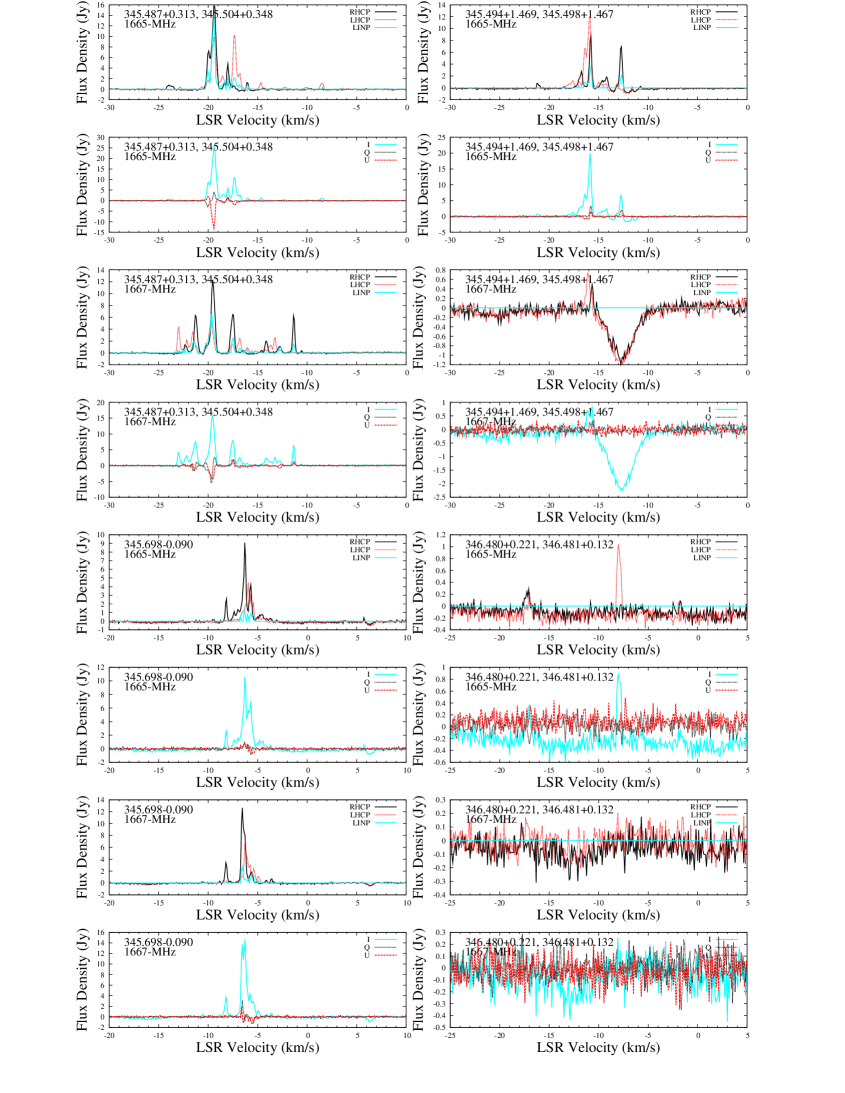
| 345.494+1.469 | 16 59 41.61 | 40 03 43.3 | C98 | 22 | 7 | 10 | 8 | 5p | ||||
| 345.498+1.467 | 16 59 42.81 | 40 03 36.2 | C98 | 17 | 13 | 12 | 0.75 | 12 | 0.8 | 5p | 1/10 | |
| 345.487+0.314 | 17 04 28.13 | 40 44 25.5 | A00 | 23.5 | 22.5 | 0.5 | 0.5 | v | ||||
| 345.504+0.348 | 17 04 22.87 | 40 44 22.9 | C98 | 24.5 | 8 | 16 | 12.5 | 14 | 10.5 | 5P; 7P | cv | 19 |
| 345.6980.090 | 17 06 50.62 | 40 50 59.4 | C98 | 11 | 3 | 9 | 12 | 9 | 12.5 | 5p; 7p | cv | |
| 346.480+0.221 | 17 08 00.11 | 40 02 15.9 | text | 18 | 16 | 0.4 | 0.2 | 0.4 | 0.2 | 75 | ||
| 346.481+0.132 | 17 08 22.76 | 40 05 25.8 | C98 | 9 | 1.5 | 1.2 | 1.4 | c | 1.4 | |||
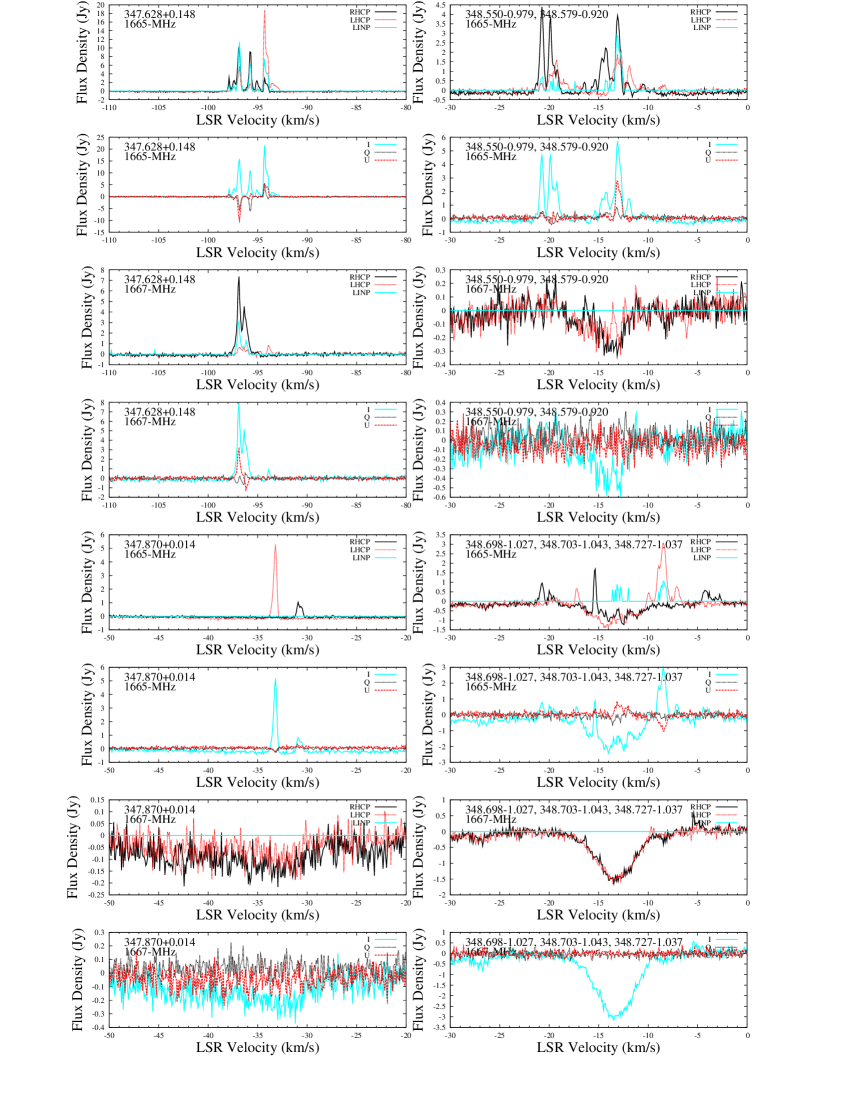
| 347.628+0.148 | 17 11 51.02 | 39 09 29.3 | C98 | 99 | 92.5 | 19 | 7 | 19 | 7.5 | 5P; 7p | cv | 1.0 |
| 347.870+0.014 | 17 13 08.80 | 39 02 29.5 | C98 | 34 | 30 | 5.2 | 4.9 | c | ||||
| 348.5500.979 | 17 19 20.39 | 39 03 51.8 | C98 | 22 | 10 | 4.5 | 0.3 | 4.9 | 0.25 | 5p | cv | 8.2 |
| 348.5790.920 | 17 19 10.56 | 39 00 24.5 | C98 | 28 | 26 | 1/2.8 | ||||||
| 348.6981.027 | 17 19 58.91 | 38 58 14.1 | C98 | 16 | 15 | 2.0 | 2.0 | cv | ||||
| 348.7031.043 | 17 20 03.96 | 38 58 31.3 | C98 | 18 | 11 | 0.6 | 0.6 | 108 | ||||
| 348.7271.037 | 17 20 06.55 | 38 57 08.2 | C98 | 12 | 2 | 3.5 | 0.5 | 3.3 | 0.6 | 5p | c | 23 |
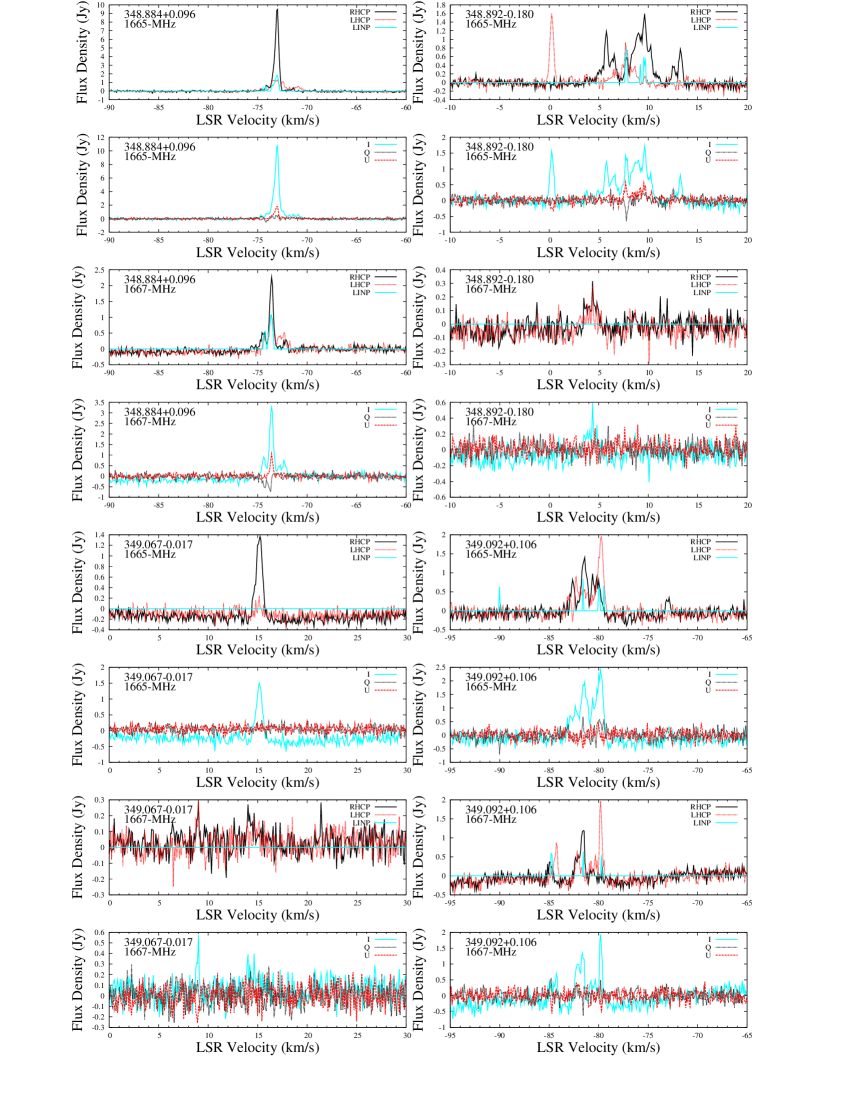
| 348.884+0.096 | 17 15 50.15 | 38 10 12.5 | C98 | 75 | 70 | 11.5 | 2.6 | 9.6 | 2.4 | 5p; 7p | c | 1.1 |
| 348.8920.180 | 17 17 00.21 | 38 19 27.9 | C98 | 0.5 | 14 | 1.45 | 0.2 | 1.6 | 0.35 | 5P | c | 1.6 |
| 349.0670.017 | 17 16 50.74 | 38 05 14.4 | C98 | 8.5 | 16 | 1.4 | 0.3 | 1.8 | 0.3 | c | 1.3 | |
| 349.092+0.106 | 17 16 24.59 | 37 59 45.5 | C98 | 90.5 | 72.5 | 2.1 | 1.6 | 2.0 | 2.0 | 5p; 7p | c | 4.8 |
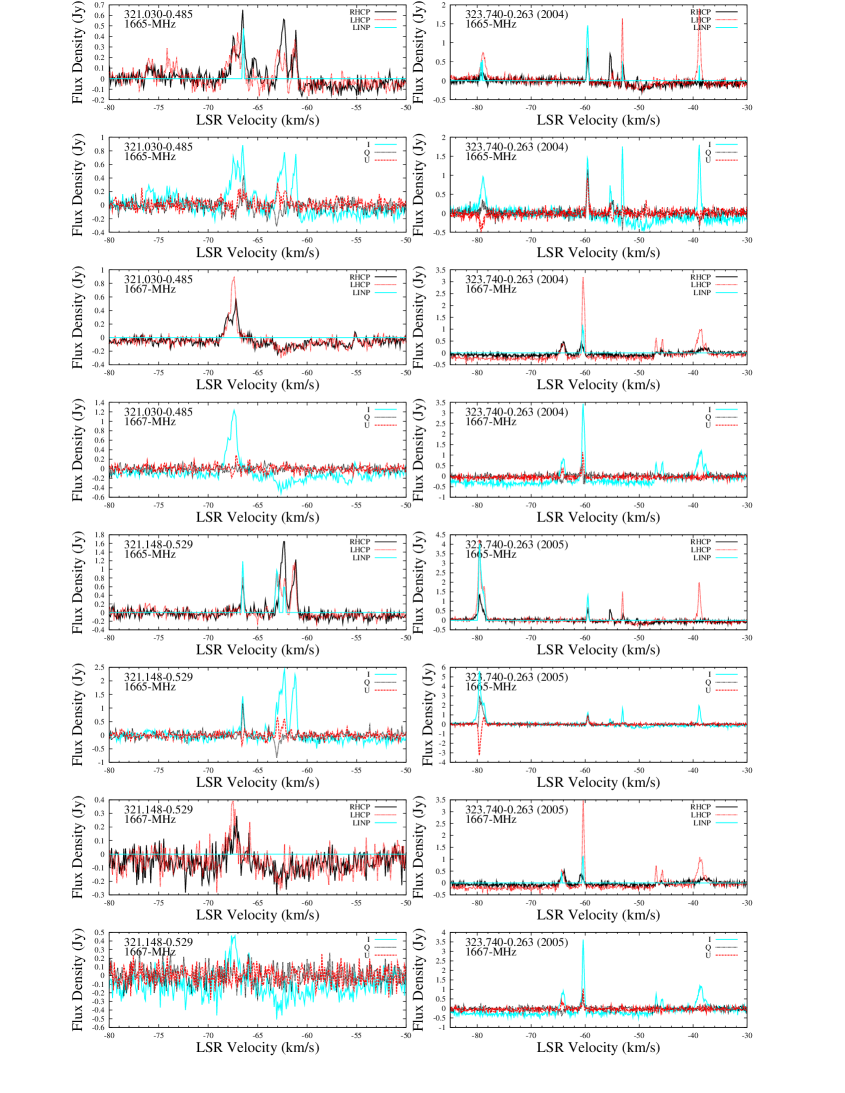
Source parameters are listed in Table 1. Column 1 gives the Galactic coordinates, used as a source name, and derived from the more precise equatorial coordinates given in columns 2 and 3. Column 4 gives a reference to a position measurement for the OH emission, with ‘text’ referring to the text of Section 3.3. The velocity range of emission is given in columns 5 and 6, and in a few cases is larger than currently detectable since it encompasses features at outlying velocities that have been prominent in the past but subsequently weakened. The values of peak intensity of emission, for epochs 2004 and 2005, at both 1665 and 1667, are given in columns 7-10, listing the highest peak seen in the circular polarization spectra; non-detections are given as upper limits, for example, if no feature exceeds 0.2 Jy, we list as ; a dash indicates no measurement available. Boldface font identifies the epoch of the spectra selected for display in Fig. 1.
Linear polarization detectability from the present spectra is summarised in column 11, with 5P and 7P (upper case P) indicating the presence of a feature with more than 50 per cent at 1665 and 1667 MHz respectively, and 5p and 7p (lower case p) indicating our clear detection of linear polarization, but not above 50 per cent in any feature. References to past published polarization spectra with comparable sensitivity are given in column 12.
Column 13 refers to the relative prominence of maser emission at the 6.6-GHz methanol transition and the stronger of the ground-state 1665 or 1667-MHz OH transitions. The ratio has been evaluated from the highest peak spectral intensity from a methanol spectrum and the highest peak of OH emission (generally taken from the circularly polarized spectrum displayed here). Methanol values for these comparisons were taken from the Methanol Multibeam survey (Caswell et al. 2010b, 2011c; Green et al. 2012c; see also Caswell 2009). The comparison of methanol to OH intensity is superior to earlier investigations (e.g. Caswell 1998), owing to many improved methanol positions and some improved positions of OH in the present paper, allowing confirmation or rejection of some earlier apparent associations. The ratio is believed to be an indicator of the evolutionary stage of the high-mass star formation maser site (Caswell 1997; 1998) and is discussed further in Section 4.2.
There are two sources tentatively listed in Table 1 that have not previously been reported as OH maser sites. They correspond to features newly detected towards known targets, but which we suggest arise from an offset position that we think likely to be at a methanol maser site. These sites (344.421+0.045 346.480+0.221) will require future confirmation. We also note, at a less confident level (and thus with a remark in the source notes, but with no entry in Table 1) that some OH emission seen towards 333.234-0.060 may be from the location of methanol maser 333.234-0.062.
In a few cases, we list an OH source, with a previously measured precise position, which in the present observations was close to our detection limit or not detected. 331.543-0.066 and 348.579-0.920 are confused, but the positive OH detections of the past are supported by the fact that the measured precise position in each case coincides with a methanol maser; 320.120-0.440 is an OH site barely detectable, with no corresponding methanol maser,
Our listing of 311.94+0.14 deserves special attention; not only does it have a large position uncertainty of several arcminutes, but we were unable to detect it in either 2004 or 2005. We regard it as an interesting OH maser which has been variable, as detailed in the source notes. With the inclusion of this source, Table 1 is a complete list of main-line ground-state OH SFR masers, in this region of sky, known up until 2005.
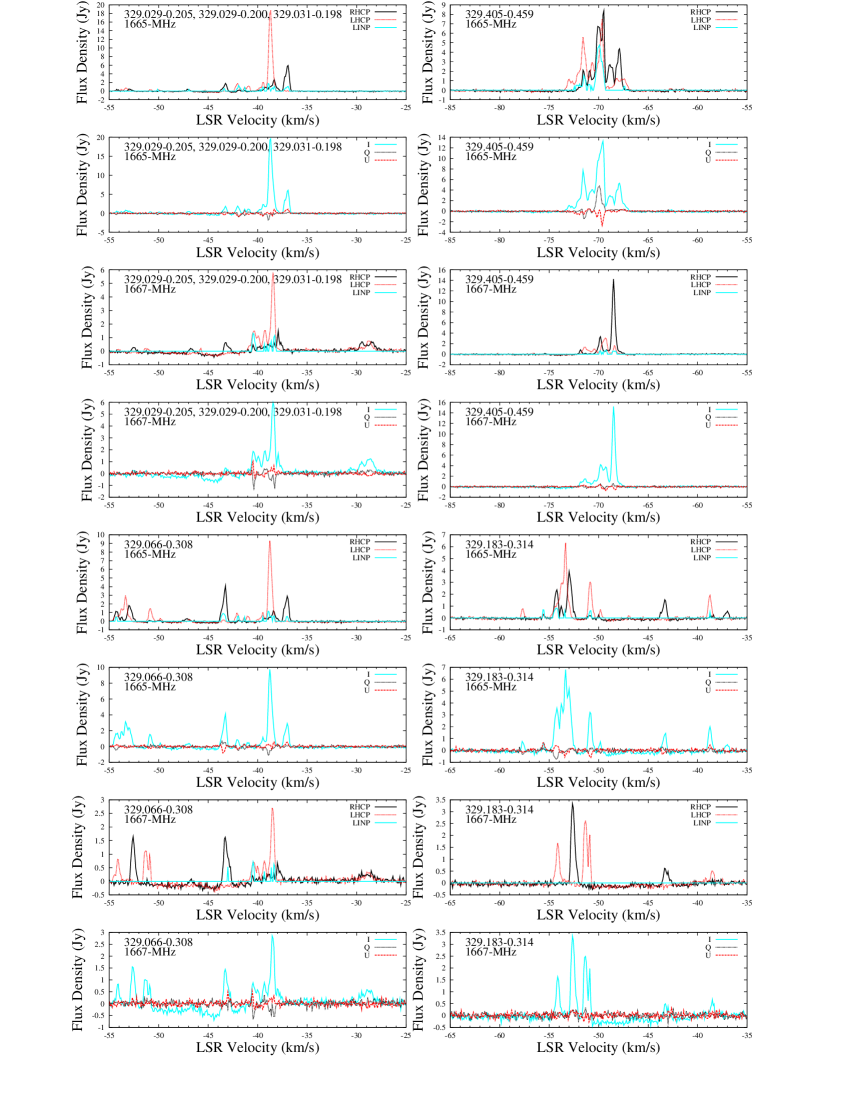
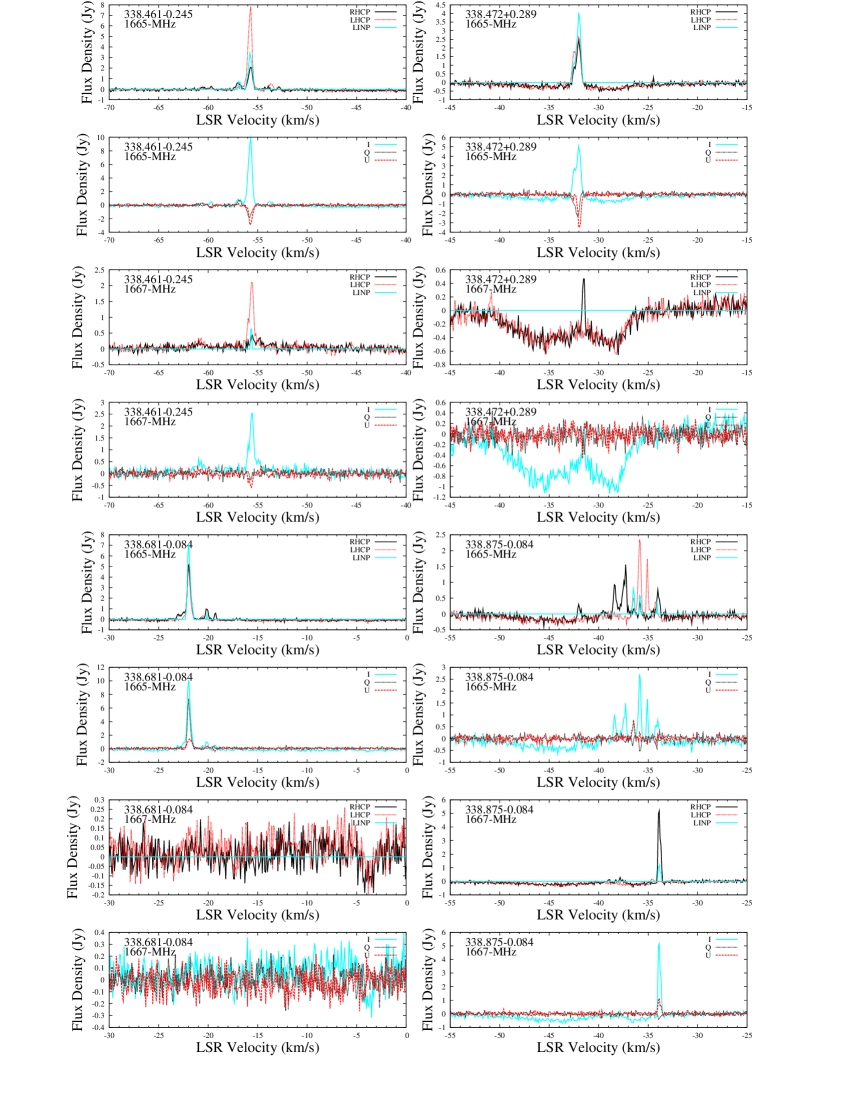
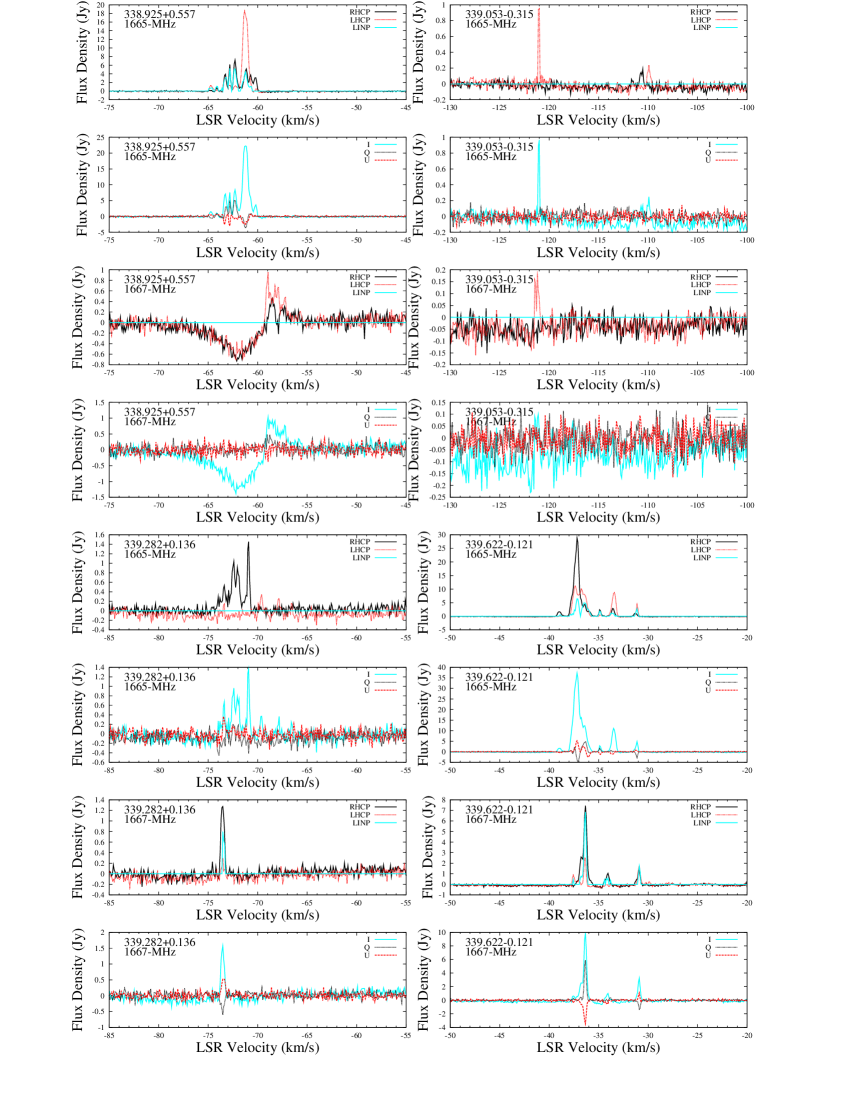
3.1 Spectra
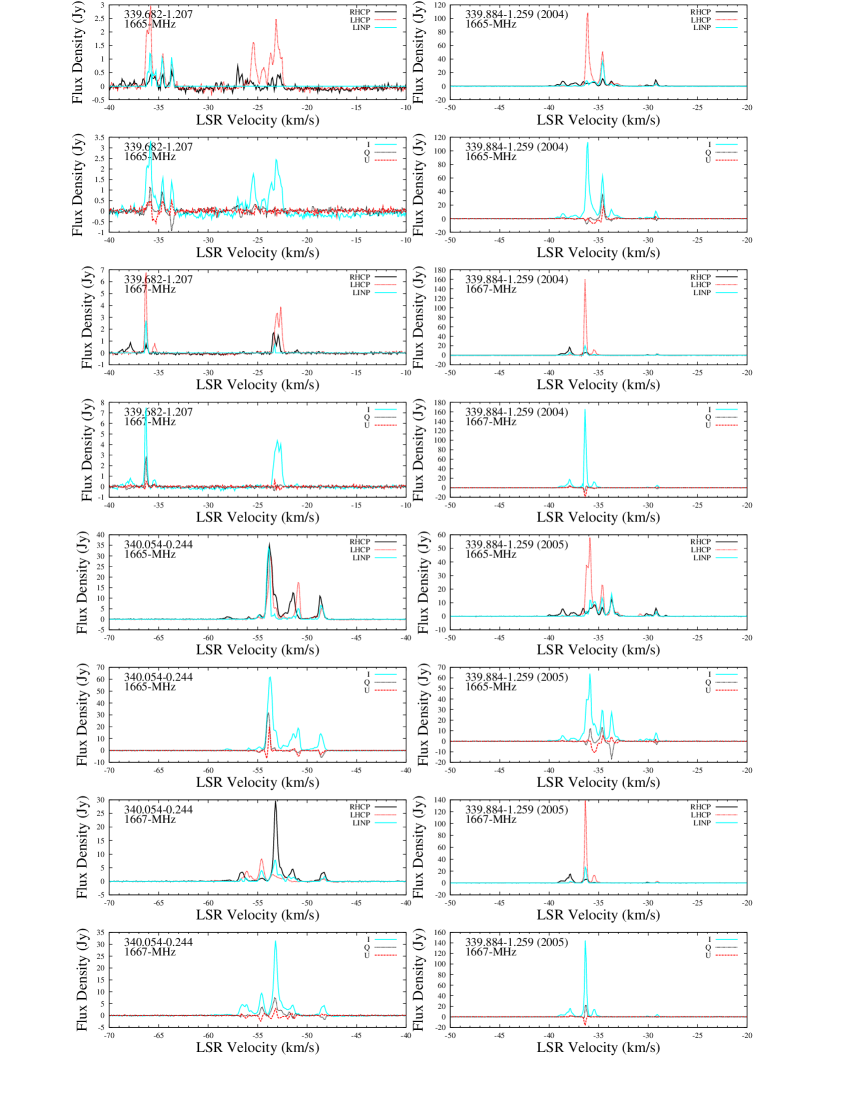
Spectra of the 157 maser sites are presented in Figure 1, and these are displayed in just 140 panels since, in some instances, plots at a single position are sufficient for several adjacent sites that are in closely spaced clusters. The ordering of the panels follows that of the Table, with minor deviations to allow nearby sources that are confused by each other to be shown on the same page, usually aligned in velocity. The remarkable source 330.878-0.367 is the persistently strongest source known (although flares on other sources have surpassed it briefly). For this source we show a second set of plots at an expanded intensity scale to reveal the weak features extending over the wide velocity range from -50 to -74 , approximately symmetrical about the most prominent emission. For two other sources we also show a second set of plots, spectra at both the 2004 and 2005 epochs, as a demonstration of strong variability: 323.740-0.263 where a highly blue-shifted feature has flared more than a factor of five to 4 Jy, with more than 50 per cent polarization; and 339.884-1.259, which includes a feature that has flared from 12 Jy to 28 Jy, with more than 50 per cent linear polarization.
For the majority (128) of the 140 plots, a velocity range of 30 is sufficient to show all detected features, and display the fine detail present. Larger ranges are used for a few sources with large velocity extents, the most extreme being 323.740-0.263 (55 ) and 332.295+2.280 (60 ).
Spectra have a channel separation of 0.488 kHz (equivalent to 0.088 ) and have not been smoothed, so the ‘resolution’, full-width to half-maximum (FWHM), is 1.21 times the channel separation.
For a typical source observed with integration time of 10 min, our rms noise level on a spectrum at full spectral resolution is 0.05 Jy. Longer integration times of up to 20 min were used towards some targets where the background sky noise is high. The most extreme background noise was towards 291.610-0.529 (system noise 110 Jy compared with a typical value of less than 20 Jy), and the rms noise is 0.25 Jy despite the slightly longer integration time. Towards 291.274-0.709 with system noise of 55 Jy, the integration time was increased to 120 min so as to reduce the rms noise sufficiently below the typical value to allow measurements on the weak maser known to be present. There is no detectable interference on any of the spectra presented here.
3.2 Other OH data sets consulted for comparison
Compilation of source notes has included comparisons with several earlier data sets. Most sources studied here lie south of Declination -38∘ and thus very few can be observed with northern hemisphere instruments.
3.2.1 VLA comparisons
The VLA dataset of Argon et al. (2000) provides good spectral resolution for northerly sources. Although limited to the two circular polarizations, the VLA observations allow comparisons at both 1665 and 1667 MHz with the Parkes data for five sources. Comparisons for a further nine sources are useful, but limited, owing to either the absence from the VLA dataset of 1667-MHz observations, or incomplete velocity coverage. VLA observations of these southern sources are necessarily made at low elevation near the VLA southern horizon. As remarked by Caswell, Vaile and Forster (1995b), the VLA declination errors can then be quite large, and Argon et al. (2000) note that in the most extreme example of their dataset, the error reached 8 arcsec.
3.2.2 Earlier Parkes data
Many of the subsequent comparisons regarding variability relate to earlier Parkes data, with spectra from 1978 onwards (Caswell, Haynes & Goss 1980 and later citations) displaying good sensitivity and spectral resolution in the two circular polarizations especially useful.
3.2.3 LBA
The southern Long Baseline Array (LBA) has been used in studies of the 1665 and 1667-MHz transitions towards four of the sources studied here (Caswell, Kramer & Reynolds 2011b and references therein). The beamsize was approximately 100 mas, but only the two circular polarizations were computed. Successful pilot observations computing all four Stokes parameters were made more recently, of 340.054-0.244 (Bains et al. 2007), and we are now using this mode in newer LBA observations.
3.2.4 ATCA data from the MAGMO survey
The installation of CABB on the ATCA now allows excellent spectropolarimetry suitable for OH masers, as first demonstrated by Caswell & Green (2011). Using this new capability, a large-scale study of OH masers (the ‘MAGMO’ survey) is now underway, with observations of a pilot region already available (Green et al. 2012b). There are nine sources in the pilot region (longitude range 280∘ to 295∘) with excellent ATCA data suitable for comparison with the corresponding Parkes spectra in the present survey.
3.3 Source notes
The following source notes discuss comparisons with earlier data, and variability, and draw attention to unusual features such as large velocity widths, unusual ratio of 1665 to 1667-MHz intensity, and exceptionally high linear polarization. We also remark on the upper limit of methanol emission in those cases where methanol is absent. Thus the notes are a foundation and foretaste of future detailed studies of individual sources, and a guide to those which are most urgent.
For an evaluation of ppa from our displayed values of Q and U, it is useful to recall that the relative values of Q and U as a function of ppa are: ppa 0∘ (Q=+1); 45∘ (U=+1); 90∘ (Q=); 135∘ (U=).
The notes include remarks on a few sources that appear to be currently in a quiescent mode (not detected in the present observations) but have been listed in Table 1.
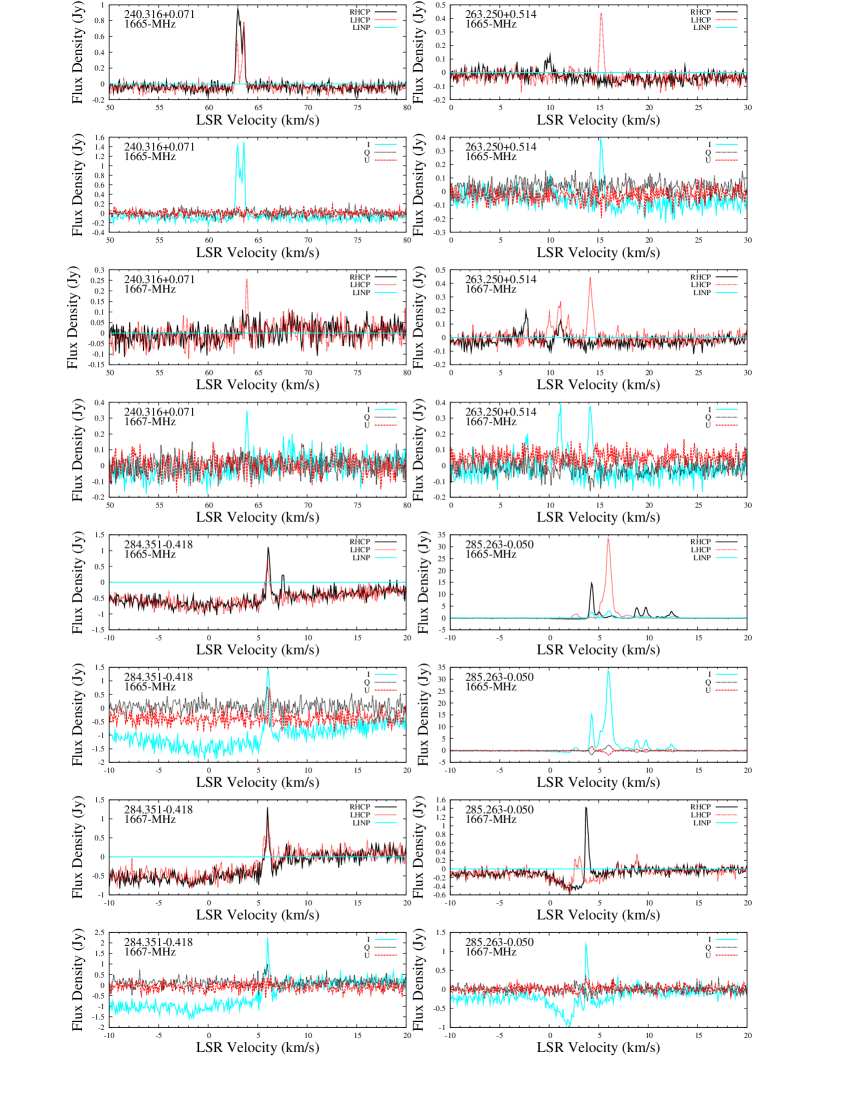
240.316+0.071
The current peak of 1 Jy is comparable to epoch 1993 (Parkes archival data); we see for the first time 1667-MHz emission of 0.27 Jy.
Unusually, OH emission in the excited-state at 6035 MHz is stronger than the 1665-MHz ground-state maser, and there is no associated methanol maser (Caswell et al. 1995).
263.250+0.514
1665-MHz emission remains similar to 1993, and comparable emission is present at 1667 MHz (as previously noted with the ATCA), with more features.
284.351-0.418
This is the first of nine sources for which new ATCA polarimetric data have been obtained in the pilot phase of the MAGMO project (Green et al. 2012b). Continuing the variability that occurred since 1992 and 1995, we now also see significant changes between 2005 and 2011, despite a superficial similarity. Most notably, MAGMO (epoch 2011) shows weakening of 1665-MHz emission at 6.1 , predominantly RHCP, (from 1.6 Jy 2004; 2.0 Jy 2005 to 0.25 Jy), but a flare of RHCP at velocity +5.36 to 1.26 Jy, and of a likely LHCP Zeeman partner at +5.71 to 0.55 Jy.
285.263-0.050
Many features seen in 1982 are still recognisable, despite some variability. Between 2004 and 2005 there was a doubling of the peak 1665-MHz feature. Green et al. (2012b) show that differences continue with the 2011 epoch observations of MAGMO, but there is generally clear recognition and persistence of many features. Zeeman patterns corresponding to magnetic fields of approximately +10 mG, for emission centred near velocity +9 , were most evident from past spectra at both 6035 MHz and 1665 MHz (Caswell & Vaile 1995). Green et al. (2012b) demonstrate that some 1665-MHz and 1667-MHz features centred near velocity +3.3 reveal Zeeman pattern fields of approximately +3 mG. Our 2004 spectra displayed here also support the +3 mG field, based on features between +2 and +5 at 1667-MHz (the main features), and 1665-MHz (secondary features). However, our 1665-MHz main LHCP features between +5 and +7 have matching RHCP features that are weaker and less obvious, and at a much larger shift of +5.5 , to between +10 and +13 , and correspond to a field of approximately +9 mG (as was more clearly evident in the 1665-MHz spectra from 1993 shown by Caswell & Vaile 1995).
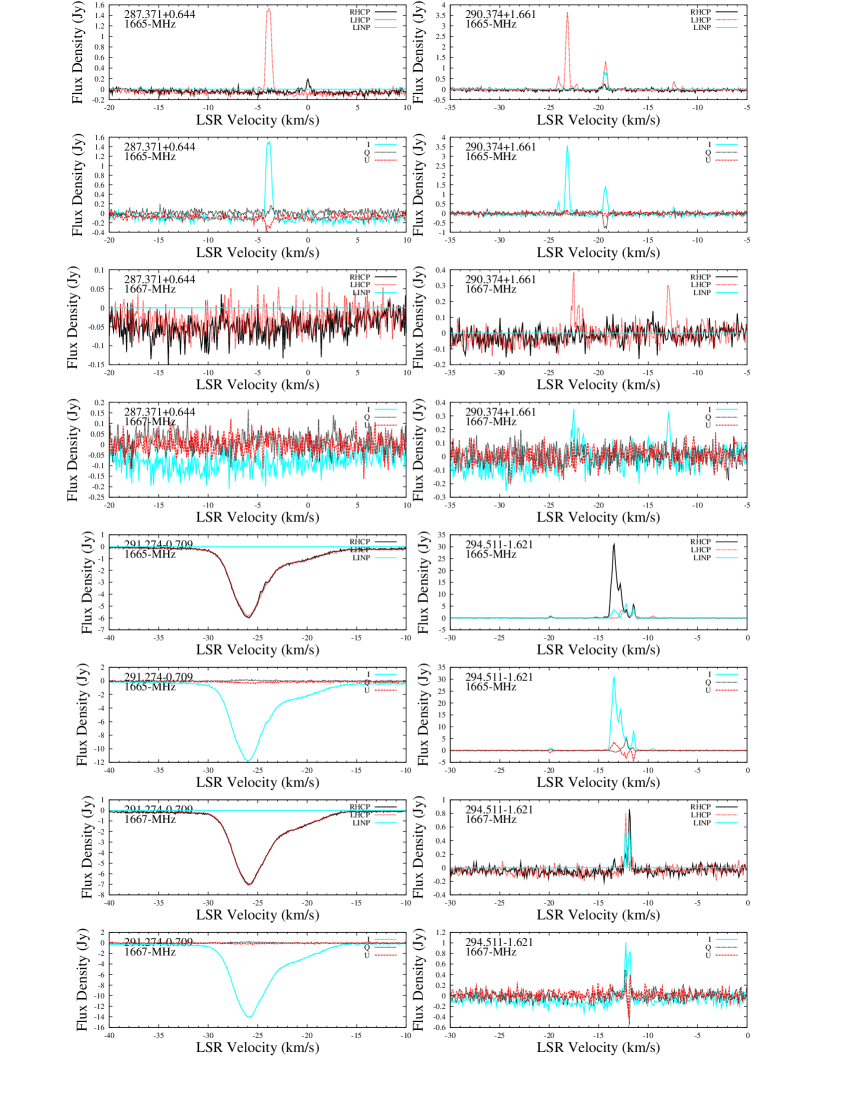
287.371+0.644
Emission only at 1665 MHz, with no detection at 1667 MHz, is similar to 1993 (LHCP at -4, RHCP at 0 ) but LHCP is now twice as strong; the weak RHCP feature of 0.2 Jy (displayed for 2004) faded to 0.15 Jy (2005) and 0.1 Jy in 2011 (MAGMO). The features appear to be a likely Zeeman pair, indicating a field of +7 mG.
290.374+1.661
The secondary 1665-MHz feature at -19.4 flared in 2005 (as displayed) by a factor of three but decayed again in MAGMO observations (2011); MAGMO spectra also showed a similar decrease at -24 , but a continuing increase of 1667-MHz emission, at just the peak, at -23.6 .
291.274-0.709
This source, at 1665 MHz, was first reported by Bourke et al. (2001) from Parkes observations in 1995 and 1996. Its precise position was determined with the ATCA (Caswell 2004c) and confirmed by MAGMO observations (Green et al. 2012b). Bourke et al. showed the total intensity and V spectra. Our observations with similar sensitivity and spectral resolution (with a 2-hour integration taken in 2004, and not observed 2005) yielded similar spectra for I and V but, as with our other spectra, we choose to show RHCP and LHCP; these emphasise that the double peaked RHCP polarized emission (evident from close comparison of RHCP and LHCP spectra) is dwarfed by the absorption of strong continuum background emission. Our total intensity spectrum shows the amplitude of the narrow features to be the same as seen in RHCP-LHCP (i.e. V) and thus no evidence of LHCP emission. The ATCA spectra from MAGMO show the maser very clearly, and also show that the absorption minimum is offset from the maser, approximately located at the peak of extended continuum background emission.
All three data sets indicate that the maser emission remains similar at epochs 1995, 2004 and 2011, with peak flux density approximately 0.4 Jy.
291.579-0.431, (291.579-0.434), 291.610-0.529 and 291.654-0.596
Targeted observations were made towards both 291.579-0.431 and 291.610-0.529 and, since their separation is only 6 arcmin, each is seen with half intensity at site of the other. The aligned spectra demonstrate this.
Following detections with peak flux density of 8.5 Jy in 1970 and 1976, 291.579-0.431 was not detectable in 1982 (Caswell & Haynes 1987a) but in 1988 was dominated by RHCP emission of 2 and 1.5 Jy at 14.5 and 16.2 . LHCP emission was a single feature of 1 Jy at 13.45 . The latter was still present in 2004 and 2005, at about 0.7 Jy, with a stronger feature of 1.3 Jy at 12.2 ; both features are also present in 2011 (MAGMO). RHCP emission has weakened since 1988, with a single feature at 16.2 clearly detected and a likely feature at 15.7 . The 2005 appearance suggests two Zeeman pairs with RHCP at velocity more positive than LHCP by 3.1 . No significant 1667-MHz emission was seen in 2004 or 2005 (apparent 1667-MHz emission is 291.610-0.529).
A nearby source 291.579-0.434 (offset 10 arcsec from 291.579-0.431) was recognised from the MAGMO 2011 data as a 1665-MHz RHCP feature of 0.7 Jy at 18.8 ; MAGMO shows that a 1667-MHz RHCP 0.9-Jy feature at 13.6 also originates from this site. 291.579-0.434 was not detected in 1982 (Caswell & Haynes 1987a), but showed strong emission of 4 Jy at 1665 MHz in 1988, although not then recognised as distinct from 291.579-0.431. We do not list the source in Table 1 since it is not detectable on our spectra of 2004 or 2005, or earlier archival spectra (e.g. 1982). Both 291.579-0.431 and 291.579-0.434 are sites of water maser emission (Breen et al. 2010b), and 291.579-0.431 is a site of methanol maser emission.
291.610-0.529 has remained remarkably stable over several decades, as noted by Caswell & Haynes (1987a) from their 1982 spectra and earlier comparisons, and continuing through 1988 and 2004, 2005 into 2011 (MAGMO). 1665-MHz emission is dominated by LHCP emission but accompanied by weaker RHCP emission; 1667-MHz emission shows a weaker, equal amplitude, RHCP and LHCP pair of features.
MAGMO shows an additional source, 291.654-0.596, offset by nearly 6 arcmin from 291.610-0.529 (and 11 arcmin from 291.579-0.431 and thus absent from that spectrum), with strongest emission of 0.8 Jy at 1665 MHz, velocity 16.1 , RHCP. With hindsight, 291.654-0.596 is recognisable in the 1982 spectrum (Caswell & Haynes 1987a) and, more clearly, in an unpublished Parkes 1988 spectrum, with peak flux density of 2 Jy. It is also seen in our 2004 data, with peak of nearly 2 Jy again (after correction accounting for its offset to the halfpower point of the targeted position).
No methanol maser has been detected at either site, but 291.610-0.529 has associated water maser emission.
294.511-1.621
The peak 1665-MHz feature, RHCP, remained between 32 and 37 Jy from 1989 through 2004 to 2005; the 2011 spectrum showed a decrease of this feature to 20 Jy, and the reduction of a feature at -9.5 to 0.2 Jy. But increases occurred in blue-shifted features at -19.5 (0.4, 1.0, 4.0 Jy), and -15.84 (0.3, 0.3, 0.8 Jy), both with strong linearly polarized emission. Close Zeeman pairs centred near -12 are evident at both 1665 and 1667 MHz as reported from MAGMO. This is the ninth (final) of our targets that were later observed in the MAGMO pilot survey. MAGMO demonstrated that, for sources between Galactic longitudes 284.5∘ and 295∘, Zeeman patterns indicate a persistent positive magnetic field (RHCP at velocity more positive than LHCP), consistent with a coherent field over many kpc of the Carina-Sagittarius arm, where we view it along a tangent.
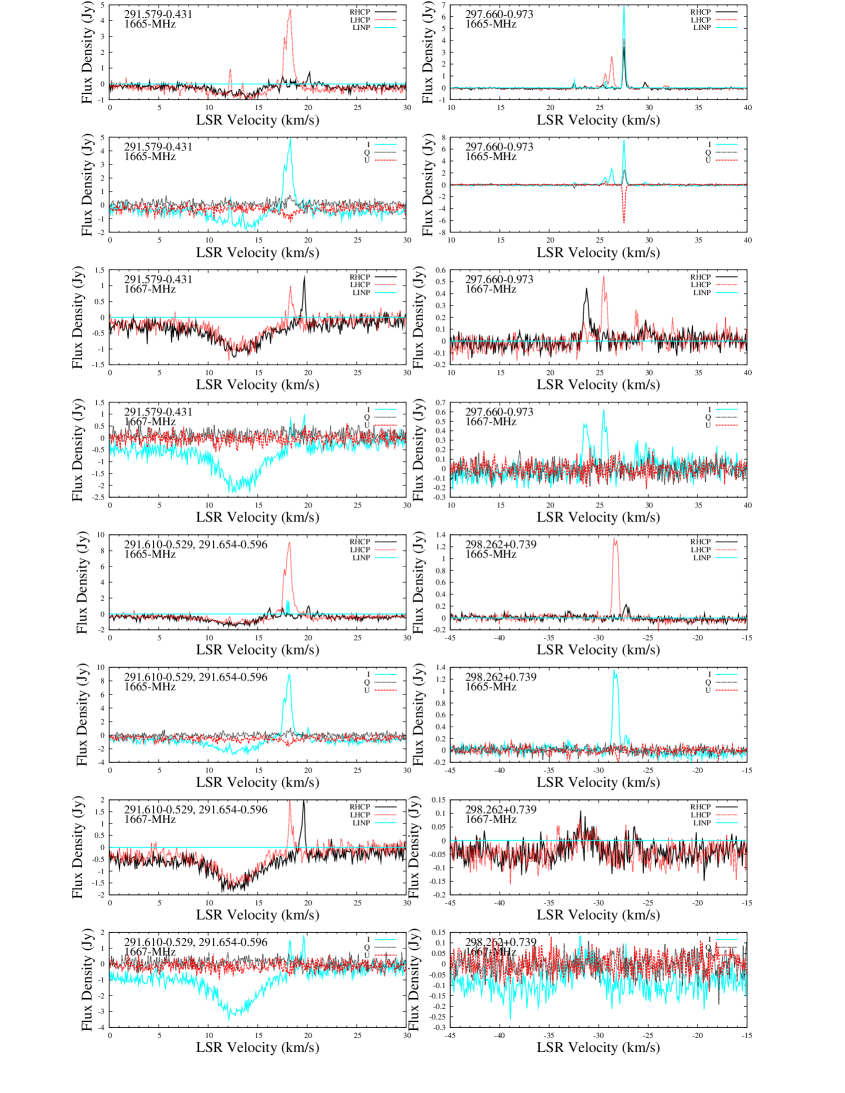
297.660-0.973
Some 1665-MHz features are comparable with 1982, especially at +27.6 , now seen to display linear polarization greater than 90 per cent (consistent with 1982 no net circular). In Section 6.1 and 6.2 we suggest that it is part of a previously unrecognised Zeeman triplet.
298.262+0.739
The source was first reported (as 298.262+0.740) by MacLeod et al. (1998) and a precise position was measured in new ATCA observations. Current emission is not distinguishably different from the discovery observation pre-1998.
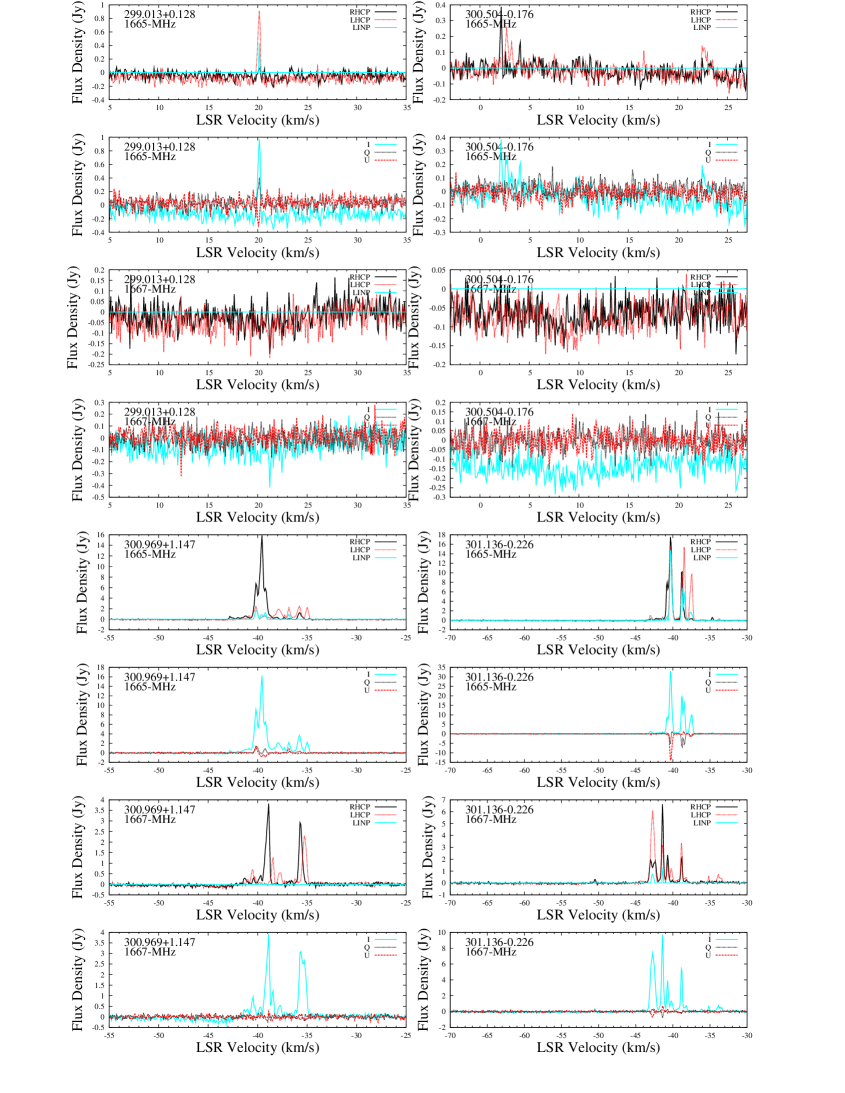
299.013+0.128
The major feature, 1665-MHz LHCP (but with 30 per cent linear polarization) at +20.1 , although similar to its epoch 1982 appearance, flared by a factor of three in 1990 and 1992 archival observations. Our current good sensitivity now allows weak RHCP 0.1 Jy at +23.3 to be seen.
300.504-0.176
The original detection of this source in 1982 was merely 1665-MHz RHCP emission of 0.6 Jy near +22.5 (Caswell & Haynes 1987a). By 1990, a possible LHCP feature of less than 0.4 Jy was all that remained, but in 1992 a flare of 1.4 Jy in both RHCP and LHCP emission (separated by 1 in velocity) had occurred near +22.5 , and weak emission of 0.2 Jy was detectable between +3 and +7 . The position determined with the ATCA in 1995 was based on the +22.5- feature. Emission at epoch 2005 (displayed), and epoch 2004, is now strongest between +2 and +4 , but with weak LHCP emission seen at +22.5 . OH absorption at 1667 MHz is centred at +8 , with a hint of emission LHCP at +7.7 and RHCP at +8.8 . The associated methanol maser has a peak at +7.5 , and range +2.5 to +10 , and associated water has features between -37 and +14 ; a nearby water maser (300.491-0.190, offset 1 arc min) has a peak at +23 (Breen et al. 2010b). We regard the systemic velocity of these masers as not reliably determined.
300.969+1.147
The spectra remain similar to epoch 1982 for both 1665 and 1667 MHz. Observations with high spatial resolution are presented by Caswell, Kramer & Reynolds (2009), and confirm clear Zeeman patterns and a consistent magnetic field direction. From this Galactic longitude onwards, it may be the first of several sources showing a magnetic field opposite to the persistent field seen between longitudes 284.5∘ and 295∘ in the MAGMO pilot sample.
301.136-0.226
Emission has remained strong at 1665 and 1667 MHz over several decades. Its very wide velocity range extends from -64 where there used to be (1982) 1665-MHz RHCP emission, and certainly -51 where there is currently a 1667-MHz feature (and formerly a 1665-MHz feature), to at least -33 (currently at 1665 and 1667 MHz) An accompanying methanol maser has a velocity range of only 4 , mid-range -39 (the likely systemic velocity), and thus indicative of the OH showing an extra blue-shifted outflow.
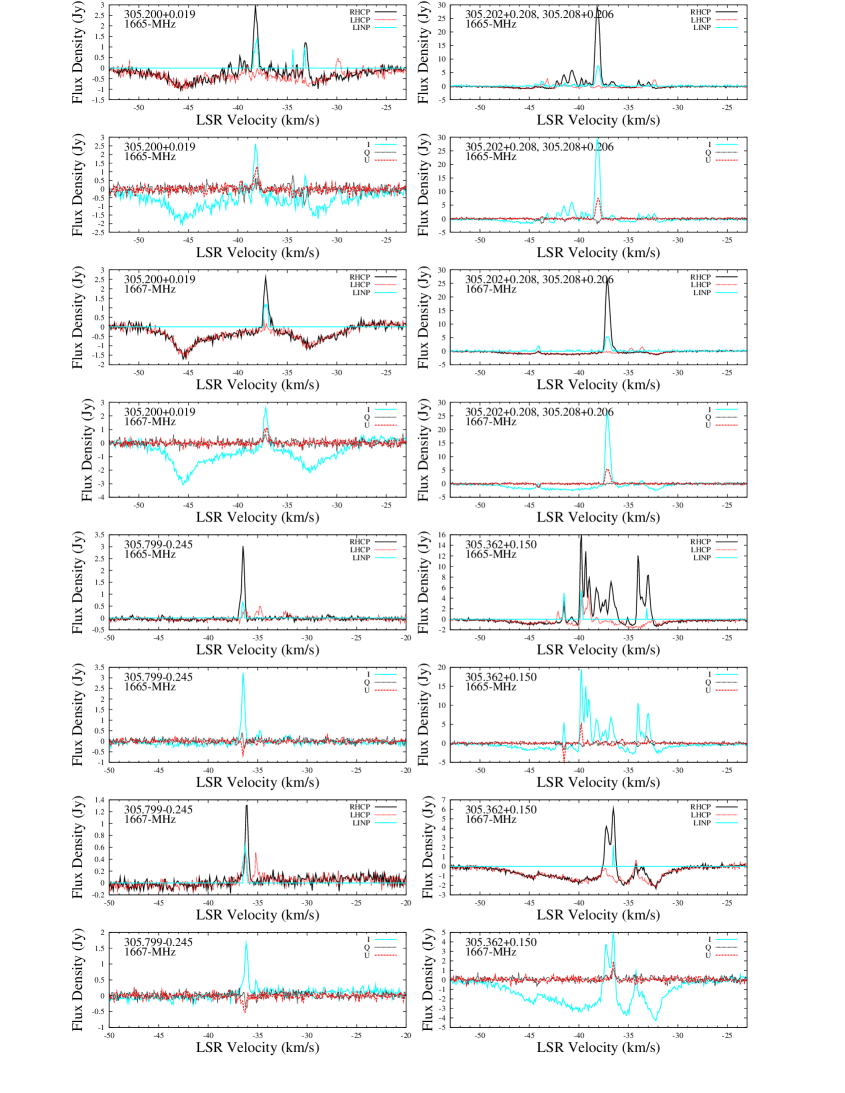
305.200+0.019
There is some confusion from 305.362+0.150 and 305.208+0.206, causing 7 and 10 per cent sidelobe responses respectively. Genuine features are only at 1665 MHz: 1.5 Jy RHCP at -33 and probably 0.4 Jy LHCP at -30 .
305.202+0.208, 305.208+0.206 and 305.362+0.150
We display a shared spectrum for the first two (separation less than 30 arcsec), with an additional spectrum for the third, offset nearly 10 arcmin, but strong enough to be seen as a 10 per cent sidelobe at the other position. The last of these, 305.362+0.150, is strongest and, with the exception of 6-Jy RHCP features at -38.1 (1665 MHz) and -37.1 (1667 MHz), all features seen when targeting 305.362+0.150 do indeed arise here: mainly RHCP, but with linear polarization exceeding 50 per cent for the 3-Jy 1665-MHz feature at -41.6 . 1667 and 1665-MHz features are all recognisably similar to their 1982 appearance, with amplitude variations by a factor of two.
305.202+0.208 may be merely a 1665-MHz 6-Jy feature near velocity -40.8 .
The remainder of the first spectrum, with the exception of the weak sidelobes from 305.362+0.150, arises from 305.208+0.206. RHCP features dominate at both 1665 and 1667 MHz, at -38.1 and -37.1 respectively, and a LHCP 1665-MHz feature at -32.5 . Linear polarization exceeds 50 per cent at the isolated 2-Jy 1667-MHz feature at -44 .
305.799-0.245
The spectrum remains the same as in 1982, with plausible Zeeman pairs at 1665 and 1667 MHz, with LHCP at more positive velocity. There is a coincident very weak methanol maser, and weak (1 mJy) compact continuum emission, weaker at 4.8 than 8.6 GHz, and thus most likely an ultra- or hyper-compact H ii region (Guzman et al. 2012).
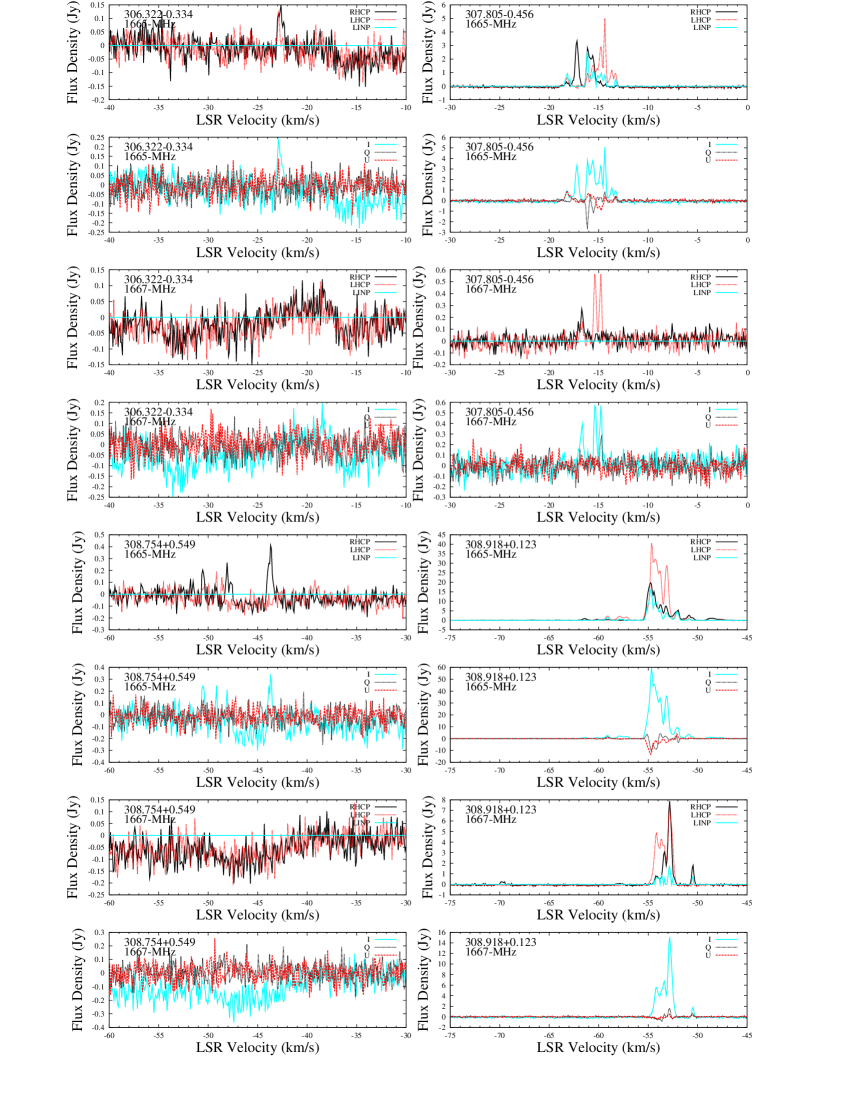
306.322-0.334
An emission peak of 1.0 Jy LHCP was present in 1992, but is now very weak, 0.15 Jy, mainly RHCP. Weaker 1667-MHz emission may be present.
307.805-0.456
Generally similar to 1993. In addition to highly circularly polarized features, there is also strong linear polarization: 80 per cent for 1665-MHz 1 Jy at -18.1 , 60 per cent -16.2 ; 40 per cent at 1667 MHz -14.8 .
308.754+0.549
First reported by Caswell (2004c) as a maser site towards the optical HII nebula RCW 79. Our 2005 polarization spectrum, displayed here, shows just 1665-MHz emission, mainly RHCP for several features.
308.918+0.123
1665-MHz LHCP features are similar to 1982, but RHCP emission is now weaker. 1667-MHz emission remains generally similar. Note a quite wide velocity range of 22.5 , with 1665-MHz emission extending to -47.5 , and 1667-MHz emission to -70 , beyond the range of archival data, and also quite weak. Since the accompanying methanol maser velocity range is -56 to -52.5 , the wide range seems to be caused by a blue-shifted outflow.
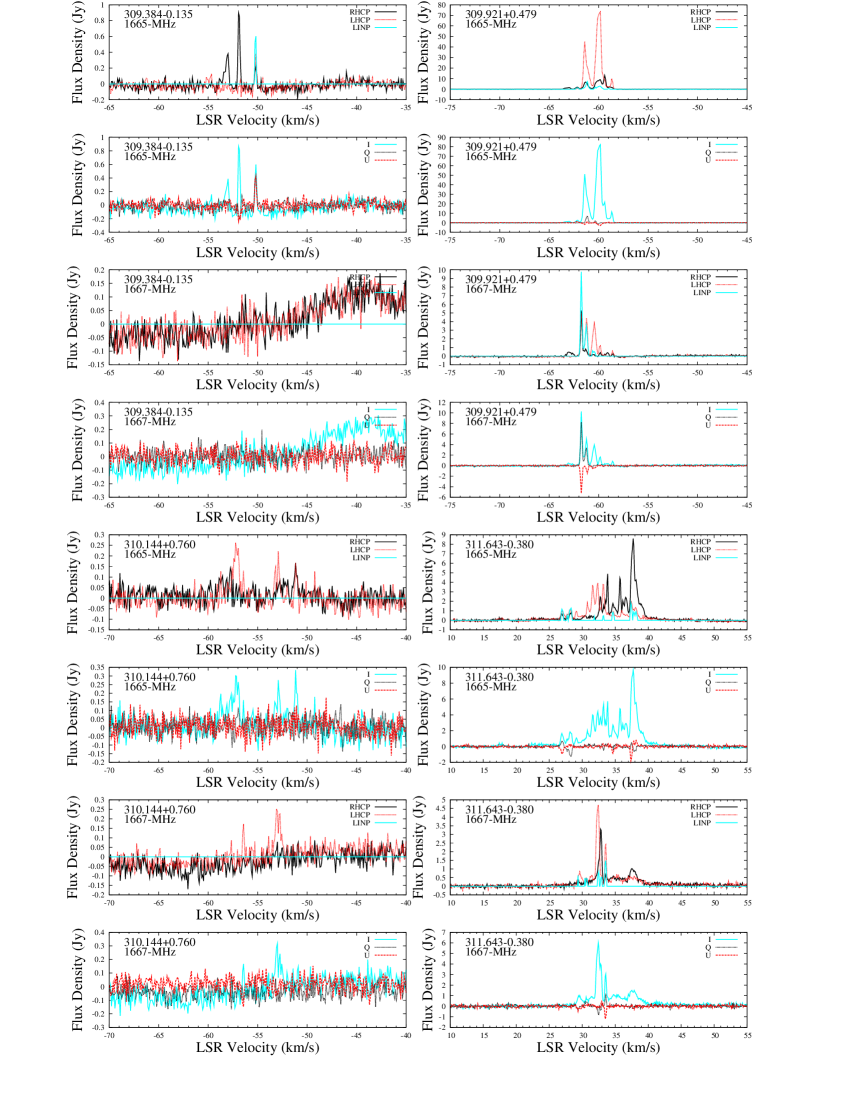
309.384-0.135
Emission at 1665 MHz remains similar to 1990; linear polarization of 80 per cent is now seen at -50.1 .
309.921+0.479
A strong source with long history, remaining generally similar to spectra in 1982, but the LHCP 1665-MHz feature at -60 has flared from 28 Jy to 80 Jy (now the strongest feature). At 1665 MHz there is only weak linear polarization. A new 1667-MHz feature, the strongest in 2004 and 2005, with total intensity peak of 10 Jy at -61.8 displays essentially 100 per cent linear polarization. In Section 6.1 and 6.2 we suggest that it is part of a Zeeman triplet.
310.144+0.760
The features of this weak source at 1665 and 1667 MHz are mainly LHCP, similar in 2005 and 2004.
311.643-0.380
Still fairly similar to 1982 for both 1665 and 1667 MHz. Linear polarization is especially high at 1665 MHz for 1.5-Jy features at 26.9 and 28.1 . We note that weak features over a large velocity range were reported by Caswell (1998), and are confirmed in the present spectra.
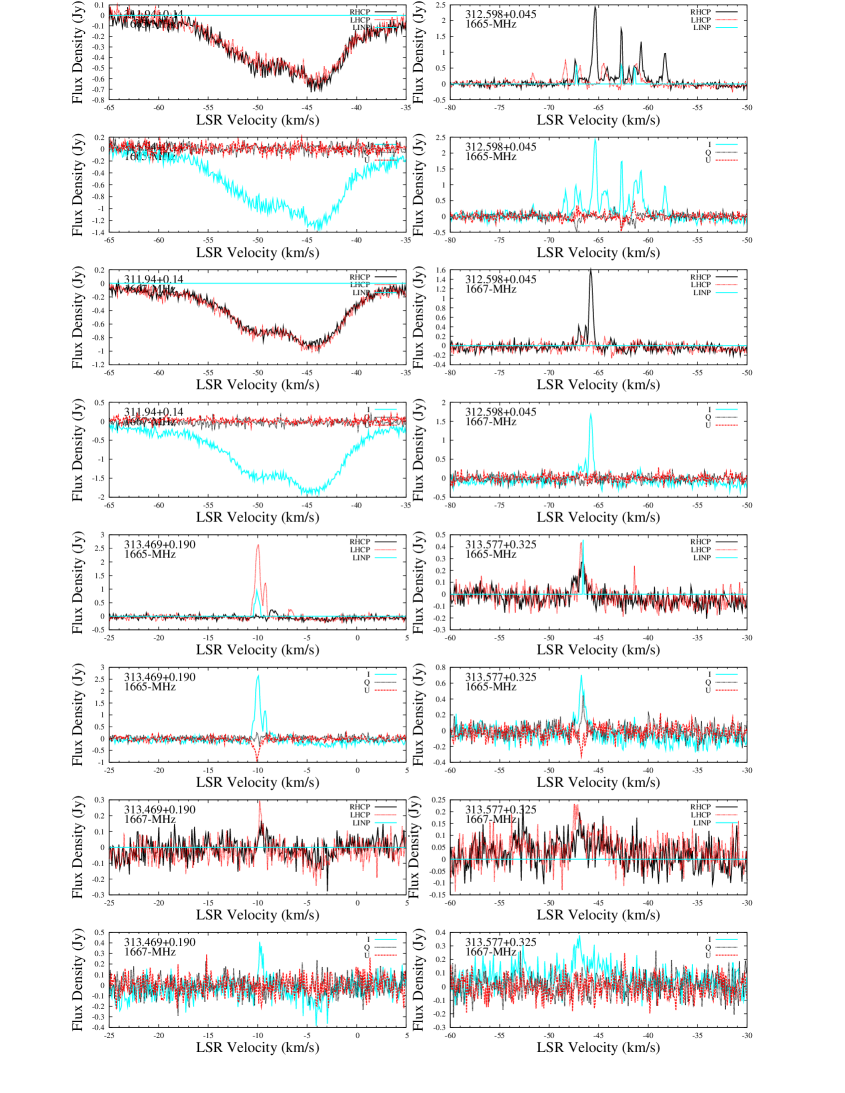
311.94+0.14
We note that the position of 311.94+0.14, has a large uncertainty of several arminutes; we were unable to detect it in either 2004 or 2005 and a detailed discussion follows.
The site was first reported by Caswell & Haynes (1987a) from a Parkes observation in 1982, citing the target position where it was discovered but with no refinement except to note its undetectability from positions 6 arcmin away. The 1982 spectrum is poor, but archival spectra from Parkes in 1990 January and 1992 August with much lower noise level gave clear detections confirming a LHCP feature with peak of 0.5 Jy and width nearly 1 . However no detection was present in our current spectra in 2004 (as displayed) or 2005, with upper limit 0.2 Jy, and clearly indicating variability since 1992. A weak methanol maser (Caswell et al. 1995a, Caswell 2009, Green et al. 2012c) is at the precise position 311.947+0.142 (), and this may be the location of the OH site. We report the current OH non-detection as a record of its variability should it be successfully measured in future. We note that likely associated H ii region emission is estimated to be at the far kinematic distance (Caswell & Haynes 1987b; Caswell et al. 1975), 8.5 kpc (using current Galactic size parameters). The report of a water maser at this site prompted the first detection of the OH, and the OH and water reports prompted the detection of the methanol. It is ironic that the water and OH have faded and prevented precise position measurements, and only the methanol has a precisely known position, but it seems likely that the other species are at this same position.
312.598+0.045
The weak features seen in 1982 at both 1665 and 1667 MHz remain similar, but the strongest 1665-MHz feature at -61.5 has fallen dramatically, from 12 Jy to less than 1 Jy. 1665-MHz weak linear polarization is seen, corroborated 2004 and 2005.
313.469+0.190
Very little change since 1982 or 1989. Weak 1667-MHz emission is now seen, and linear polarization at 1665 MHz.
313.577+0.325
Weak emission is present at both 1665 and 1667 MHz, and linear polarization is seen at 1665 MHz.
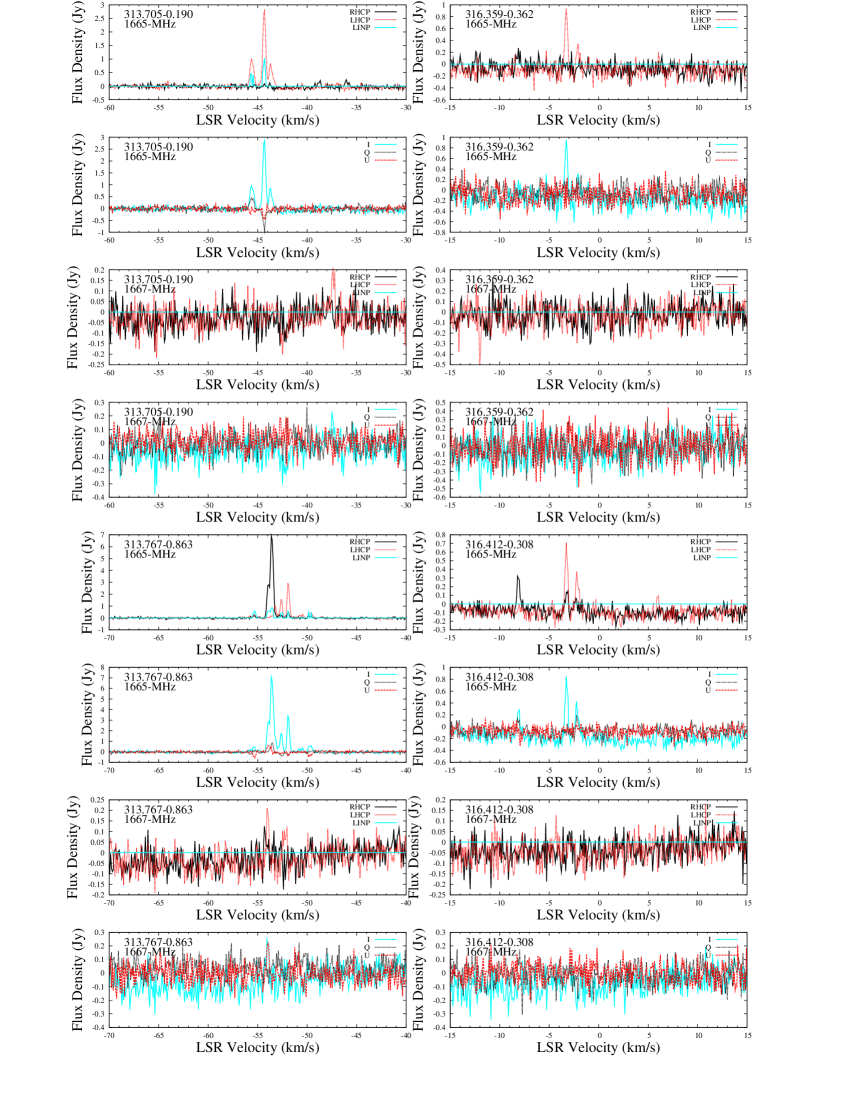
313.705-0.190
LHCP emission dominates both the strong 1665-MHz emission, and the weak 1667-MHz emission, with some linear polarization now seen at 1665 MHz.
313.767-0.863
Significant variability at 1665 MHz has occurred since 1993, and linear polarization is seen in weak features; weak emission is seen at 1667 MHz.
314.320+0.112
A 1665-MHz feature at -45 remains the same as in 1993, and is now seen to display high linear polarization. The 1667-MHz Q and U spectra show a strong hint of similar linear polarization at the same velocity. If future more sensitive observations confirm this, it will be another candidate for a Zeeman pattern isolated component of the variety discussed in Sections 6.1 and 6.3. A prominent blue-shifted emission peak at -72 (seen with the ATCA epoch 1996 and shown by Caswell (1998)) is not evident in 2004 or 2005, but weak broad emission extends from -45 to -60 at both 1665 and 1667 MHz, as noticed in 1993 spectra. Spectra of methanol and water (Breen et al. 2010b) similarly suggest a blue-shifted outflow in all three maser species, with the strongest methanol peak (rather than the mid-range) perhaps indicative of the systemic velocity.
316.359-0.362 and 316.412-0.308
The sources are separated by 4 arcmin and their spectra have been aligned to better distinguish them. The second source, 316.412-0.308, has been known since 1987, remaining similar, with 0.3 Jy RHCP at -8 , and 0.4 Jy LHCP at -2 . 316.359-0.362 emission was at +4.5 (1993) and -0.5 (ATCA in 1996), but is now mainly a new LHCP feature at -3.1 , of about 1 Jy. A +6- feature is present at both positions, with similar low amplitude at both epochs and might arise from the location of methanol maser 316.381-0.379 (velocity range -6 to +1.5 ) which lies between the OH target pair.
316.640-0.087
Rich spectra at 1665 and 1667 MHz extend from to . There has been much variation since 1982 and 1989 and, notably, a 1665-MHz feature at in 2004 (displayed spectrum) disappeared 2005. At 1667 MHz there are persistent features from to , blue-shifted relative to the OH peak, and the methanol peak and to the methanol median velocity near .
316.763-0.012 and 316.811-0.057
Features are seen between -47 and -35 , within deep absorption. ATCA observations (Caswell 1998) show the two sources separated by only 4 arcmin, A single spectra is shown, at 316.763-0.012, and thus emission from 316.811-0.057 is reduced by the offset, and its tabulated peaks have been corrected from the measured peaks by a factor of 1.3. Most of the emission between -47 and -40 is from the second position. Only the 1665-MHz emission -37 to -35 LHCP is from the first position. Amongst the features ascribed to 316.811-0.057, we note that the strongest current feature of 30 Jy at -43.2 was only 2 Jy in 1982,
317.429-0.561
The positive velocity indicates an unambiguous large kinematic distance outside the solar circle, beyond 15 kpc. Coincident with the OH maser, there is a ucH ii region with flux density nearly 20 mJy at 8.6 GHz, and weaker at 4.8 GHz (Guzman et al. 2012). There is no methanol maser reported at this location. The OH intensity at both 1665 and 1667 MHz remains comparable to values measured with the ATCA, epoch 1996, and the corresponding luminosity at the large distance is notably high.
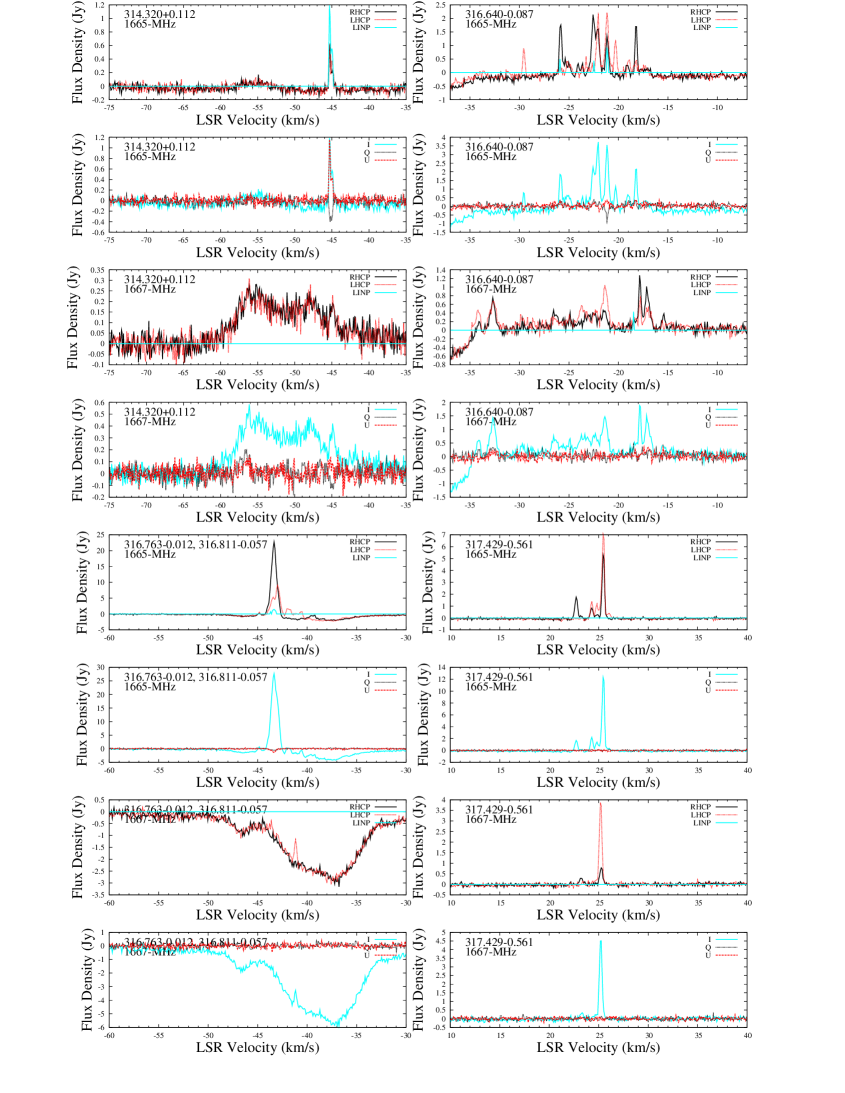
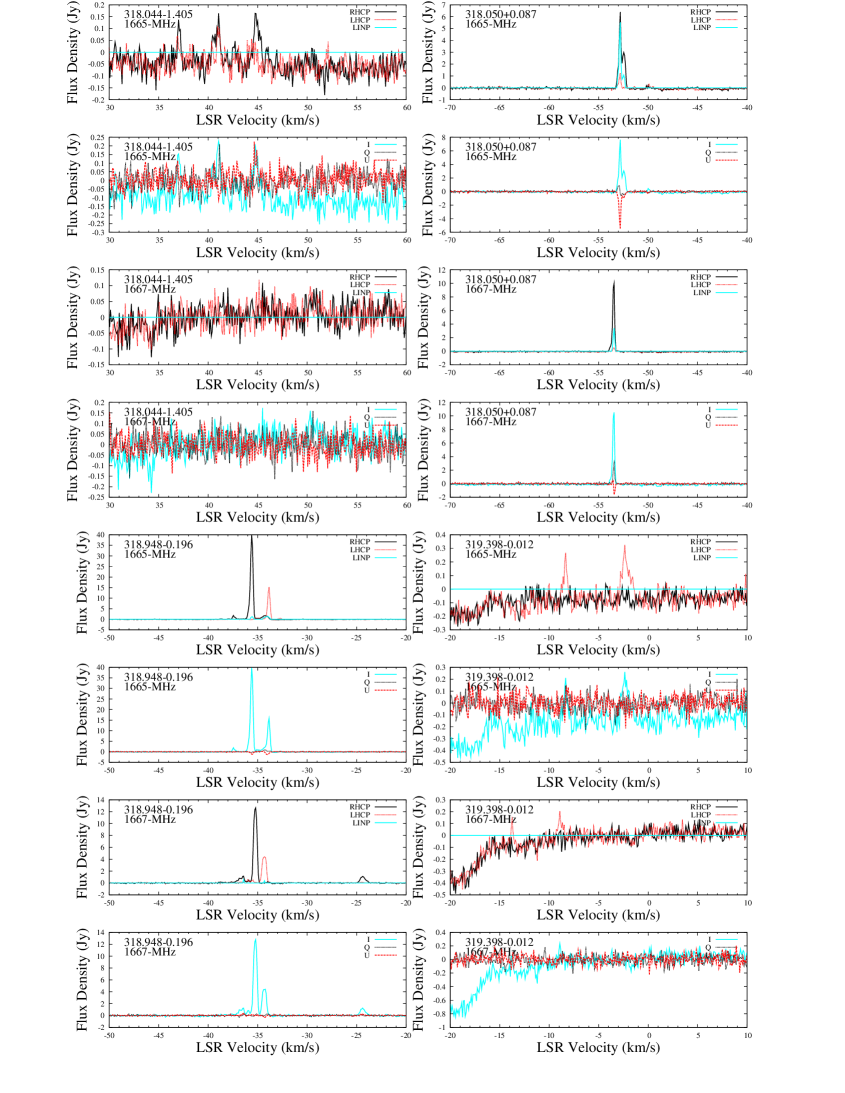
318.044-1.405
The spectral shape is similar to 1993 but weakened to half the intensity.
318.050+0.087
Since 1982, the 1665-MHz peak at has decreased from 57 (30 in 1990) to 7 Jy, but at 1667 MHz, increased from 1 to 5.6 Jy (2004) and to 10.5 Jy (2005), and thus now exceeds the 1665-MHz peak intensity.
At both 1665 and 1667 MHz, RHCP is stronger but with significant linear polarization in some features.
318.948-0.196
Hugely variable since 1982 and less so since 1989. At 1665 MHz, the peak has increased from 1 Jy to 40 Jy; at 1667 MHz, increased from 1.5 Jy to 13 Jy. The main features at 1665 and 1667 MHz resemble matching Zeeman pairs, with LHCP at higher velocity. Also, 1667-MHz emission now has an outlying feature at -24 , with peak of 3 Jy (2004) and 1 Jy (2005).
319.398-0.012
The peak in 1982 exceeded 1 Jy at both 1665 and 1667 MHz, and has subsequently weakened, although the higher sensitivity of current observations reveal additional features over a larger velocity range.
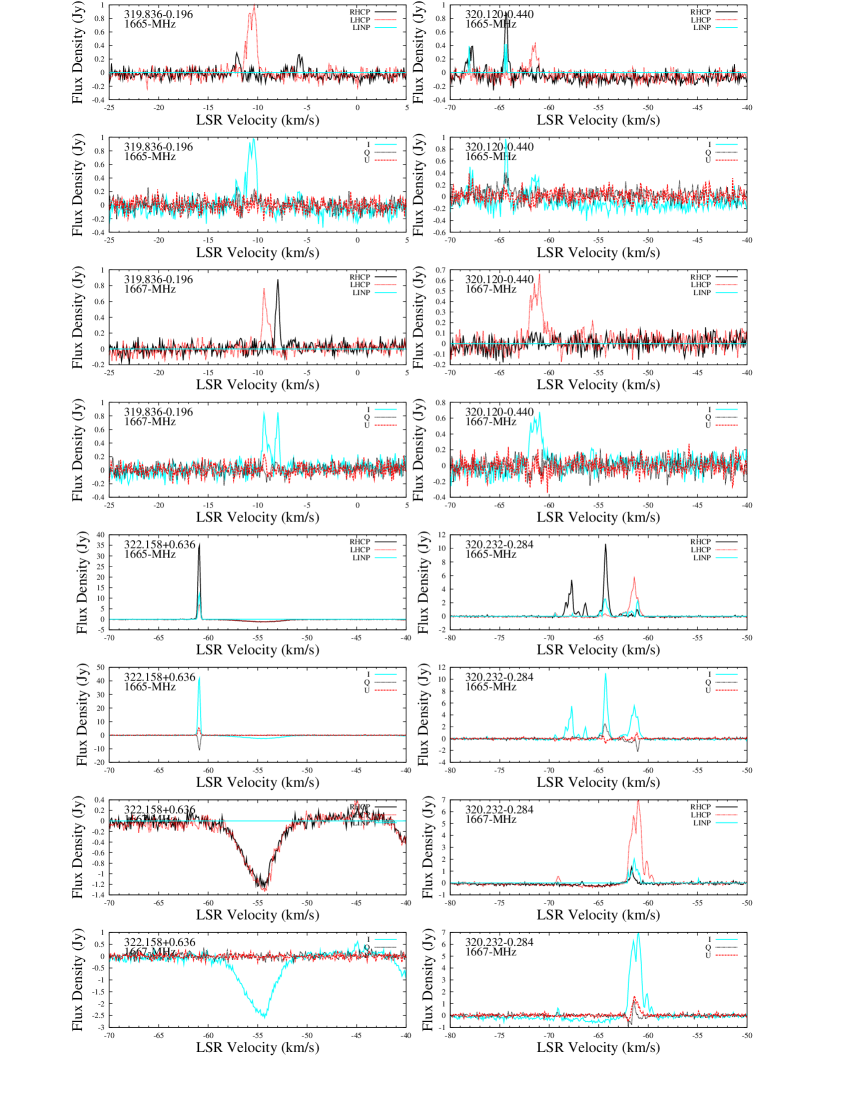
319.836-0.196
1665-MHz features remain similar to epoch 1982, although a flare of 5 Jy occurred at -10.1 in 1989. 1667-MHz emission is now stronger and comparable to 1665 MHz.
320.120-0.440
In 2004 and 2005, the only distinguishable feature here is a very weak 1667-MHz 0.2-Jy LHCP feature near -55.5 . All remaining emission on the displayed spectra is a sidelobe response to 320.232-0.284 (see following source note).
320.232-0.284
1665-MHz emission has shown persistent features over many decades, but with strong intensity variations since 1982 and 1989. In particular, the strongest 1665-MHz feature in 1982 exceeded 20 Jy at -67.9 (now fallen to 9 Jy 2004 and 5 Jy 2005), and the strongest feature in 2005 and 2004 is 10.5 Jy at -64.2 , previously 2 Jy. 1667-MHz emission has shown no obvious change since 1982. At each transition, there is significant linear polarization, mostly in features that are predominantly circularly polarized.
321.030-0.485
Strongest at 1667 MHz. A 0.5-Jy RHCP feature at -55 was present in 1993 at 1665 MHz, and at this velocity there is now a weak 1667-MHz feature. At 1665 MHz there is some confusion from the following source, 321.148-0.529, whose spectrum is aligned beneath it to make this clear. Features in the range -77 to -65 are not affected, apart from the 0.9-Jy (total intensity) peak at -66.5 which is blended with a 0.45-Jy sidelobe contribution from a narrow linearly polarized feature of 321.148-0.529.
321.148-0.529
Note that, at 1667 MHz, only the narrow feature at -65.9 is from this site, and the remainder from the previous source. The 1665-MHz emission remains remarkably similar to 1982 with total velocity range -67 to -60.5 . Note that the -66.5 feature of 1.45-Jy peak total intensity includes a small 0.15-Jy contribution of unpolarized emission from the previous source; the residual emission of 1.3 Jy is thus essentially 100 per cent linearly polarized.
322.158+0.636
In 1982, 1989, 1996, 1665-MHz emission comprised a single feature near -61 varying between 3 and 1 Jy; it has now flared to more than 30 Jy, with linear polarization, but ppa changed from 30∘ to 70∘ 2004 to 2005. Methanol at this site is also strongly variable. Weak 1667-MHz emission is seen, for the first time, between -45 to -43 , apparently red-shifted relative to systemic, but no check has yet been made to verify its precise position, and we suspect that it arises from water maser site 322.165+0.625 (Breen et al. 2010b), offset nearly one arcminute, close to a compact H ii region but with no methanol maser.
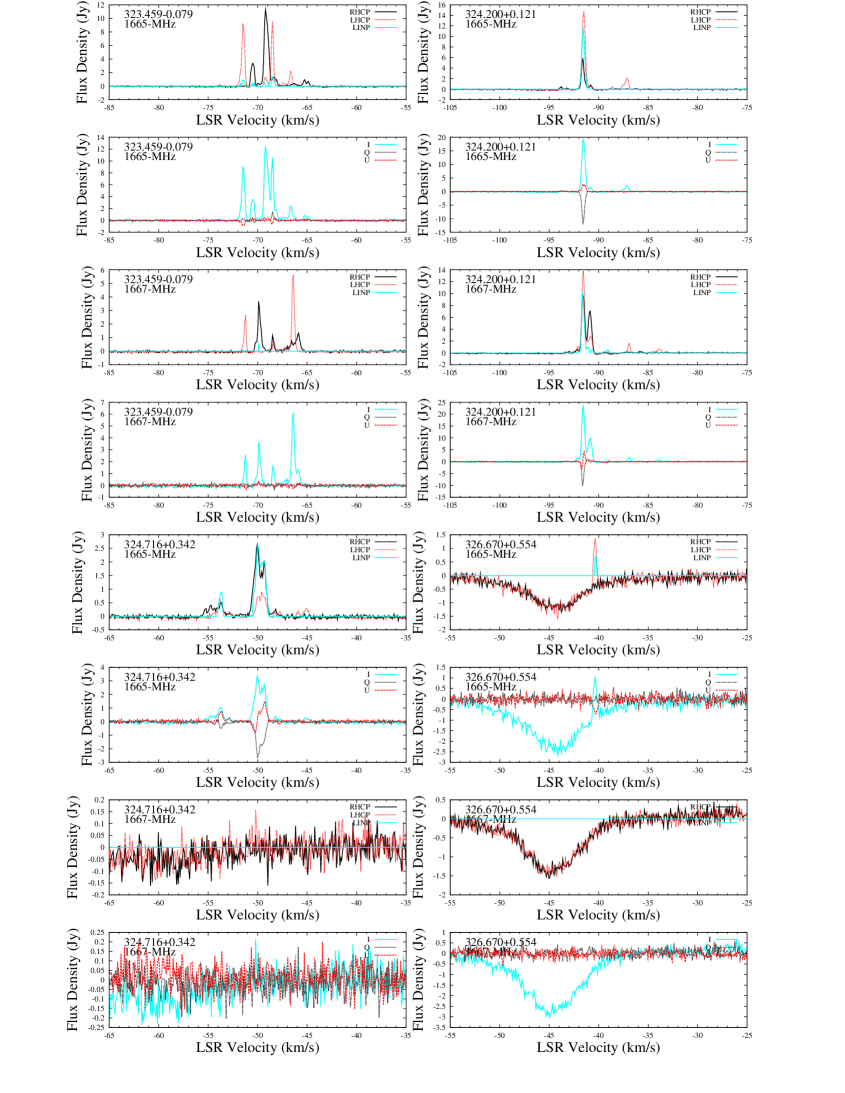
323.459-0.079
In LBA 1998 measurements (Caswell & Reynolds 2001), only circular polarization could be analysed, but features could be distinguished spatially as well as by frequency. Most features were highly circularly polarized, many of them in identifiable Zeeman pairs. The present single dish spectra still closely resemble the 1998 spectra (and also earlier Parkes spectra of 1982 and 1990), and reveal that linear polarization is, indeed, low.
323.740-0.263
OH multiple features from -60 to -37 at both 1665 and 1667 MHz are present with comparable strength. Accompanying methanol is strong, and confined to the range -59 to -42 , i.e. midrange -50.5 , which is also the peak of emission, and the likely systemic velocity. However 1665-MHz emission, with a flaring feature at -79 , extends to -80 , blue-shifted -29.5 from the systemic velocity. For this source we show spectra at both the 2004 and 2005 epochs, as a demonstration of strong variability: the highly blue-shifted 1665-MHz feature at -79.5 has flared from 0.7 to 4 Jy, with more than 50 per cent linear polarization. Other features also show strong linear polarization.
324.200+0.121
Most features at 1665 and 1667 MHz remain similar to 1982.
The strongest feature is at -91.6 for both 1665 and 1667-MHz transitions; it is highly linearly polarized, more than 50 per cent at 1665 MHz and almost 50 per cent at 1667 MHz, with comparable ppa. The feature is discussed later (Sections 6.1 and 6.3), along with several other sources, in the context of Zeeman pattern isolated components.
324.716+0.342
Only 1665-MHz emission is confidently detected; it is similar to 1982, but twice as strong, and very high linear polarization is present.
326.670+0.554
A single 1665-MHz feature remains similar to the earliest known spectrum (1993, Parkes archival), and is now (2004, 2005) seen to display 40 per cent linear polarization as well as LHCP.
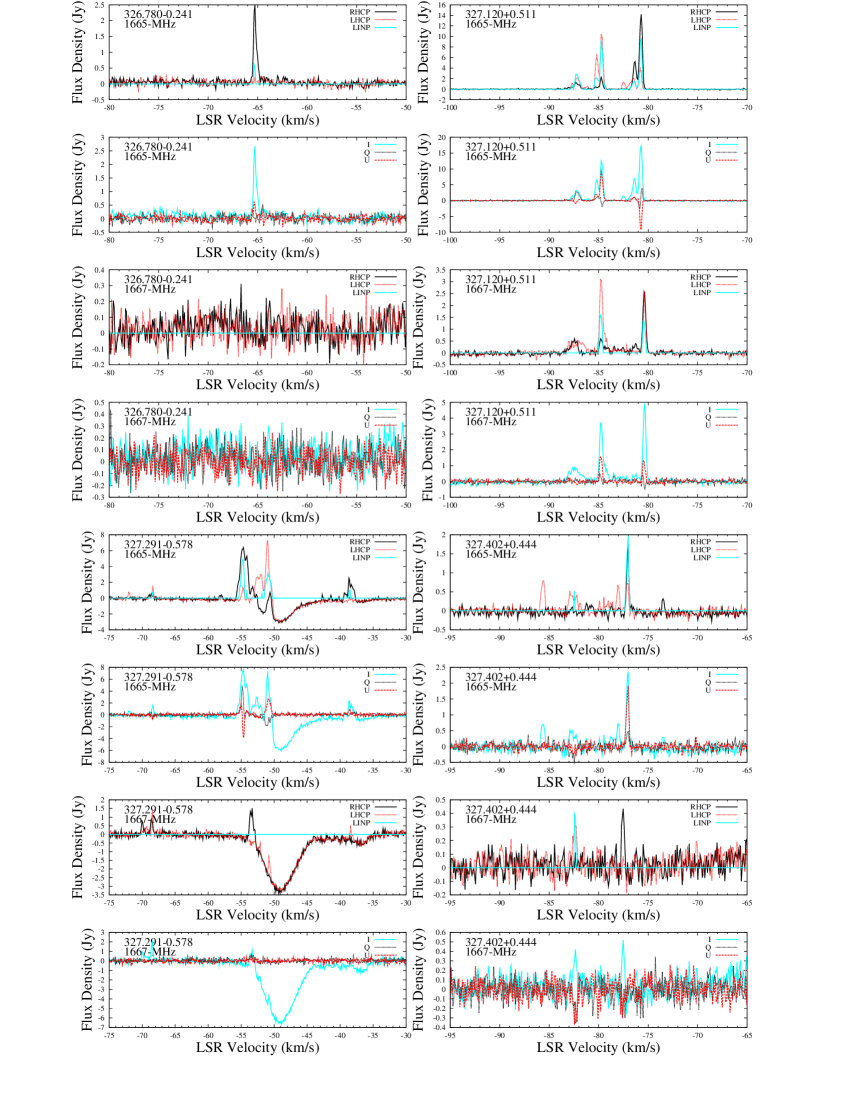
326.780-0.241
The earliest spectrum in 1978 (at 326.77-0.26) showed 1665-MHz emission LHCP of 2 Jy at -58 ; no emission was subsequently detectable for several years until 2004 November, as 2.5 Jy 1665-MHz RHCP at -65.2 . It was again detected, 2005 March with the ATCA, near -65 , and an accurate position measured.
It coincides with a water maser (with slightly worse position uncertainty, 0.04 s and 1 arcsec), 16 Jy at -64 (Breen et al. 2010b). The site is assumed to be the ‘lost’ OH site 326.77-0.26. No methanol maser has been detected here.
327.120+0.511
Slowly varying, with little change from 2004 to 2005, and still generally similar to 1982 and 1989, but with intensity changes greater than factors of 2. Linear polarization of more than 50 per cent is present at 1665 MHz in 3 features, and is accompanied also at 1667 MHz by nearly 50 per cent polarization in one of them, at -84.80 (see Sections 6.1 and 6.3).
327.291-0.578
Highly variable by factors of more than 5 between successive observations 1976 and 1978 (Caswell et al. 1980), 1993 and subsequently, and with large velocity range from -72.5 to -37.5 . Emission near the extremities of the velocity range are currently seen at both 1667 MHz and 1665 MHz. Accompanying methanol maser emission over the range -49 to -36 indicates a systemic velocity near -42.5 . Thus the wide OH range arises predominantly from highly blue-shifted emission.
327.402+0.444
Highly variable 1978 through 1989 to 2004 and 2005, but still with features over the range -86 to -73 . 2004 and 2005 data concur on the high linear polarization, at both 1667 and 1665 MHz, for two features; notably at -82.5 , where a 0.5-Jy feature at both 1665 and 1667 MHz is more than 50 per cent linearly polarized (see Sections 6.1 and 6.3).
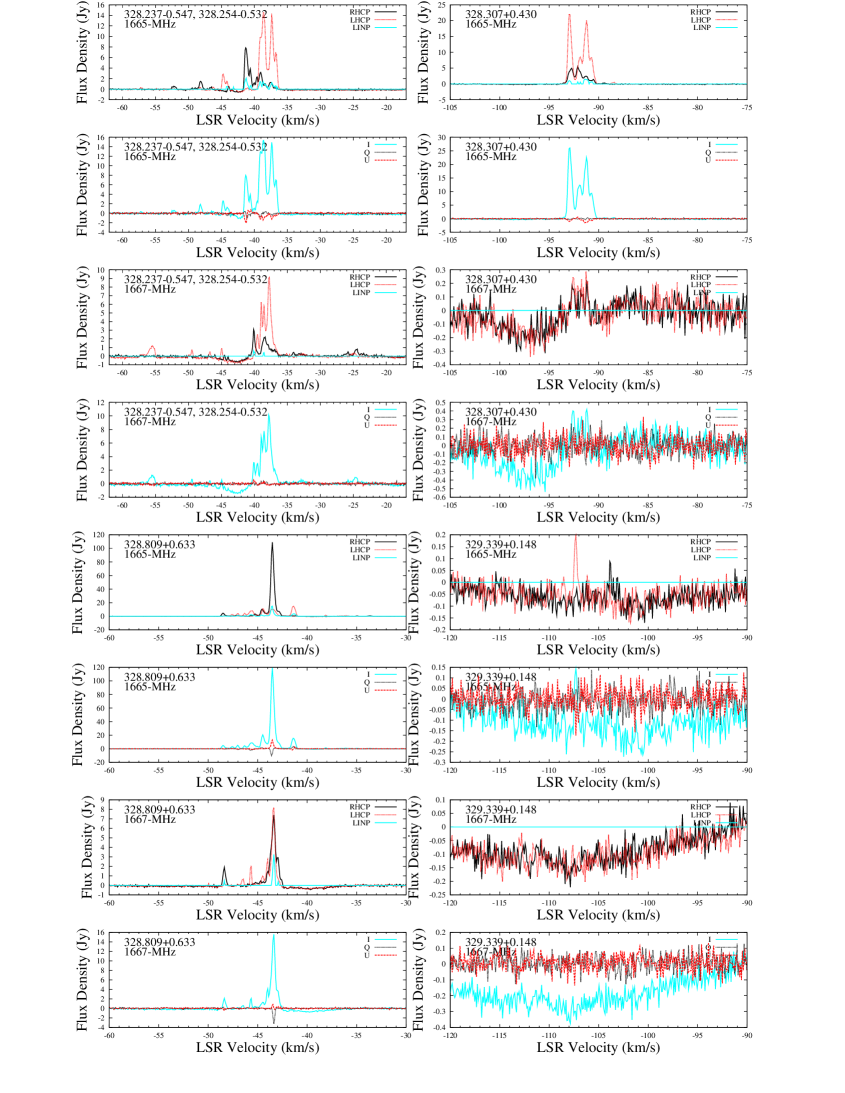
328.237-0.547 and 328.254-0.532
A single spectrum is used to display emission from both sites which are separated by only 80 arcsec. The main features remain recognisable from 1978 to our 2004 and 2005 measurements, but with amplitude variability, both decreases and decreases, greater than factors of two or three. Current emission extends beyond the velocity range of ATCA measurements (-54 to -30 ); the total range is now -58 to -23 . It is difficult to distinguish which features arise from each site, thus our estimated velocity ranges in the Table are largely guided by previous ATCA data. A new 1667-MHz feature, LHCP 1.3-Jy at -56 was present 2005 (see displayed spectrum) but not 2004.
New emission at 1667 MHz LHCP, 0.8 Jy from -27 to -23 , and 1665-MHz at -29 (detected 2004 but not 2005), is most likely from 328.237-0.547.
328.307+0.430
1665-MHz emission remains very similar to 1978 and 1989, and the detection of 1667-MHz emission is confirmed at the better sensitivity now achieved.
328.809+0.633
Spectra at both 1665 and 1667 MHz remain similar to 1978 and 1989, with velocity range -49 to -33.5 .
329.029-0.205, 329.029-0.200 and 329.031-0.198
The total extent of this complex is less than 30 arcsec, so sites are distinguishable only with the ATCA (Caswell 1998) from which we identify as the first source, 1665-MHz emission of 19 Jy LHCP at -38.5 ; we use the ATCA data for the confused second source, and the third source which has apparently weakened. The location of 1667-MHz emission between velocities -31 and -28 is not clear. Note that sidelobes from 329.183-0.314 are present beyond -50 , and from 329.066-0.308 at -43.5 .
329.066-0.308
At this target position, there is some confusion from both the previous and following sources, but clearly located at 329.066-0.308 is the RHCP feature at -43 to -44 , both 1665 MHz (4 Jy) and 1667 MHz (1.5 Jy) showing weak linear polarization.
329.183-0.314
Recognisably similar to 1978 and 1989 at both 1665 and 1667 MHz in the range -55 to -47 , as previously listed, and also extending now to -58 with a weak 0.5 Jy LHCP 1665-MHz feature. There is confusion at -39 and -37 from 329.029-0.205; and at -43.5 from 329.066-0.308, which is plotted alongside.
329.339+0.148
At this remarkable site, weak emissions from the excited states, 13441 GHz, 6035 GHz and 6030 GHz, all show clear Zeeman patterns interpreted as positive magnetic fields (Caswell 2004b). The 1665 and 1667-MHz emissions studied here are comparably weak, with 1665-MHz spectra showing LHCP emission at -107.3 and weaker RHCP emission at -104.0 , and thus a Zeeman pattern similar to stronger emission seen at 1720 MHz (Caswell 2004a).
329.405-0.459
Generally similar to 1978 and 1989, but at 1665 MHz generally weaker (halved) and the 3.5-Jy feature at -75.5 in 1978 is now absent, whereas at 1667 MHz now stronger, typically double. Linear polarization exceeds 30 per cent at 1665 MHz in one feature.
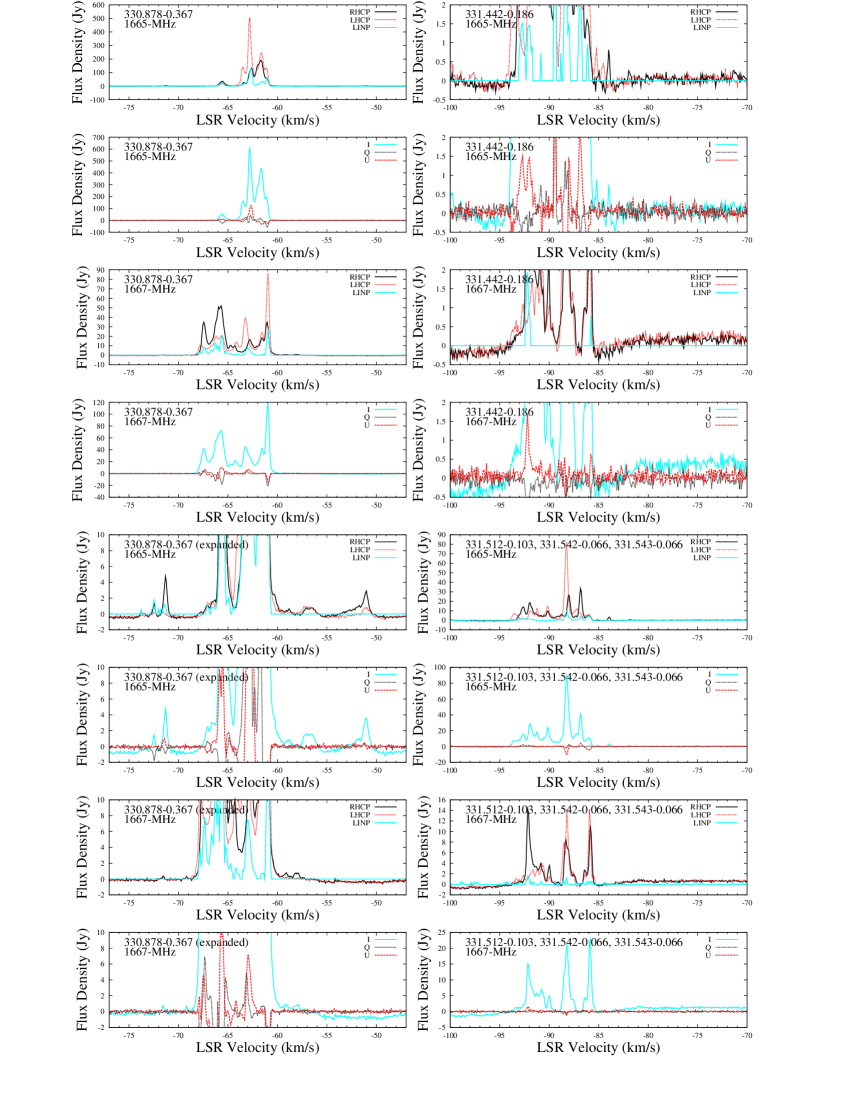
330.878-0.367
At 1665 MHz, the observed flux density over more than three decades has been the highest persistent emission of any source in the sky. And in comparison with W3(OH), which has comparable flux density at some epochs (Wright et al. 2004a, 2004b), we note that 330.878-0.367 is more distant than W3(OH), implying that its luminosity considerably surpasses W3(OH). Spectra at 1667 MHz remain very similar to the 1978 appearance, with most variations less than factors of two. 1665-MHz spectra have also stayed similar, but LHCP emission at -61.5 has nearly doubled from 1978 to 2005. Because of the high flux density, we show an additional spectrum at expanded scale to reveal the weaker features, clearly exhibiting a large velocity range extending from -74.5 to -50 . There is modest linear polarization, consistent between the 2004 and 2005 measurements. Methanol emission at this location, with velocity -59.2 , is quite weak, suggesting that this is an example of an evolved site where the OH may have progressed to its ultimate peak, and the methanol emission has begun to fade. An additional weak methanol maser lies 30 arcsec away (Caswell et al. 2011c) and there is no known OH emission at that site.
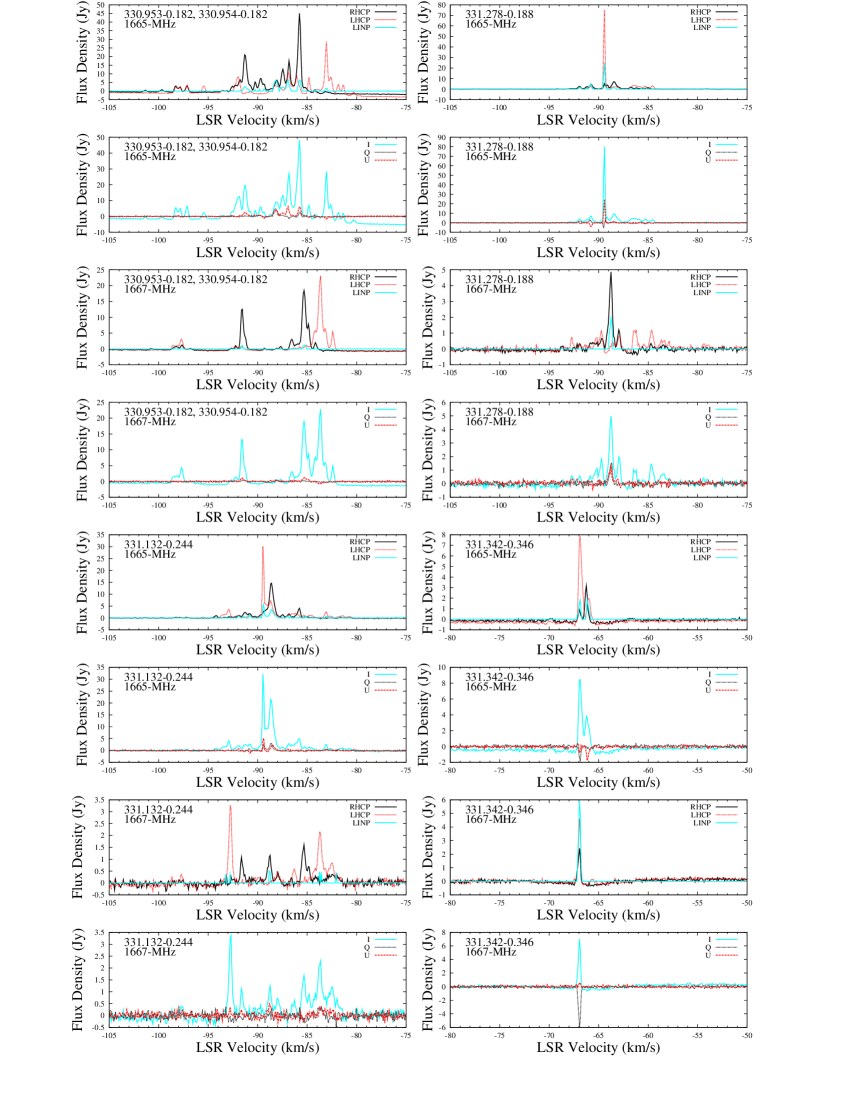
330.953-0.182 and 330.954-0.182
Emission from this direction has been generally stable since 1978, with most variations less than a factor of two. The presence of two distinct sites (Caswell 1998) was recognised from ATCA data, but the current distinction between them is based on higher resolution LBA data (Caswell et al. 2010a), with 330.954-0.182 encompassing most of the emission, whereas 330.953-0.182 refers to a discrete weaker site to its south.
At the southern site 330.953-0.182, 1665-MHz features near the three velocities, -89.4 (RHCP), -87.2 (LHCP) and -88.2 (strong at both R and LHCP) are located at , within 0.3 arcsec of associated methanol and 6035-MHz excited OH. The LBA data (limited to circular polarization) of the -88.2 feature (with near equal R and LHCP of more than 5 Jy) was suggested as having linear polarization, and our spectrum indeed shows LINP of 70 per cent. Its velocity is essentially midway between the components of a Zeeman pair and we argue in Sections 6.1 and 6.2 that the combination is a Zeeman triplet.
The centroid of other emission, the majority, to the north east, is at , i.e. 330.954-0.182 in rounded Galactic coordinates. A feature at 1665 MHz exceeding 4 Jy (4.65 Jy R and 12.58 Jy L) in the LBA observations and suggested as having elliptical polarization with significant elliptical fraction was near velocity -87 and indeed shows LINP of 4 Jy in our 2004/5 data. The only other significant linear polarization in our 2004/5 observations is at -85.9 , where there are multiple confusing features, and not recognised as likely elliptical in the LBA data. 1667-MHz emission at -85.4 also shows significant linear polarization in 2004 and 2005.
Note that the LBA lower sensitivity was unable to map the weak 1667-MHz emission seen on our spectra from -91 to -86.8 .
331.132-0.244
Note that the spectra include a 10 per cent sidelobe contribution from the previous source, and a 20 per cent sidelobe from 331.278-0.188 (notably 1665-MHz LHCP at -89.5 and 1667 RHCP at -88.8 ).
The main feature RHCP 1665-MHz at -88.8 has persisted from 1978 to 2004 and 2005. 1667-MHz emission has shown a flare of LHCP at -92.8 from 0.5 Jy (1978) to 2.3 and 3.4 Jy (2004, 2005).
331.278-0.188
Generally similar to 1978 except: in 1990, a feature at -86.8 flared at RHCP 1665-MHz from 5 to 26 Jy, and is now less than 5 Jy. Even more dramatic is the recent flare of a 1665-MHz LHCP feature at -89.5 from below 2 Jy (1978) to 9 Jy (1990), to 75 Jy (2004), and 100 Jy (2005); at 1667 MHz there has been a doubling to 5 Jy of RHCP emission at -89 .
Note that the 5-Jy RHCP 1665-MHz feature at -88.5 is a sidelobe of 331.132-0.244.
331.342-0.346
Spectra at 1665 and 1667 MHz remain recognisably similar to epoch 1978. High linear polarization of 90 per cent is present at the strongest 1667-MHz feature; prominent linear polarization is also present at the strongest 1665-MHz feature which, notably, is at the same velocity, (see Sections 6.1 and 6.3).
331.442-0.186
Most emission seen in the spectrum at this site is from sidelobes of 331.512-0.103 (offset 6.5 arcmin), with weaker contribution at 1665 MHz from 331.542-0.066 (offset 9.4 arcmin) plus a strong LHCP spike at -89.5 from 331.278-0.188 (offset 10 arcmin). A weak 1665-MHz feature of 1 Jy from 331.442-0.186 at , , with velocity -83 was recognisable in 1994 (Caswell 1998), but has faded below 0.2 Jy on our spectra of 2004 and 2005. However, 331.442-0.186 is probably now seen as a weak 1665-MHz LHCP 0.8-Jy feature at -85.2 . The spectrum aligned with 331.512-0.103 and 331.542-0.066 shows that this feature at -85.2 has no strong counterpart in the other spectra (unlike, for example, the similar strength RHCP feature at -84 which corresponds to a 4 Jy feature of 331.542-0.066). Thus the feature is not from 331.512-0.103 (where 1.6 Jy would be expected), nor from 331.542-0.066 (where 4 Jy would be expected), and thus seems to be a genuine feature of 331.442-0.186.
331.512-0.103 and 331.542-0.066 with close companion 331.543-0.066
The displayed spectrum is taken at the second pair of sites, , offset 3 arcmin from the first site (at ), and thus an intensity correction factor of 1.2 is needed for features from the first site.
In more detail, Caswell (1997, 1998) remarks that 331.512-0.103, may be double, since it has associated 6035-MHz emission that appears to have a companion offset by 1.7 arcsec (distinguished by the names 331.511-0.102 and 331.512-0.103); however, here we discuss it as a single site with name 331.512-0.103. This site accounts for nearly all of the observed emission seen in our spectrum in the range -94 to -85 .
Caswell (1998) lists both 331.542-0.066 and the weaker source 331.543-0.066, offset 3 arsec, north and at later RA. At 331.542-0.066, there is strong continuum, 191 mJy, with weak methanol and 6035-MHz masers; the second, weaker, OH source 331.543-0.066 has stronger accompanying methanol, but no continuum or 6035-MHz emission, suggesting a clear physical distinction between these two sites, with perhaps the second site younger. From the present confused single-dish spectrum, the isolated RHCP feature of 4 Jy at -84 , and probably the 10-Jy feature at -86.1 , and 1-Jy feature at -82 , are recognisably from the very close pair of sites, most likely from 331.542-0.066. We can place only an upper limit to emission from 331.543-0.066.
Despite very little change between 2004 and 2005, overall, we note that the spectra at these sites are amongst the most variable recorded since observations in 1978 (Caswell et al. 1980): most features are barely recognisable as a result of these changes (some increases, some decreases) commonly by factors of 4. For example, 1665-MHz RHCP at -92.8 has decreased from 43 to 15 Jy, and LHCP at -88.3 has increased from 18 Jy to 80 Jy and RHCP at -87 from 10 to 35 Jy. At 1667 MHz, the RHCP and LHCP features near -93 have decreased from 32 and 30 Jy to less than 1 Jy. We note that the weak (0.5-Jy) emission seen near -101 to -100 in 1978, although probably from the 331.512-0.103 site, is now barely seen, and not included in our estimated velocity range.
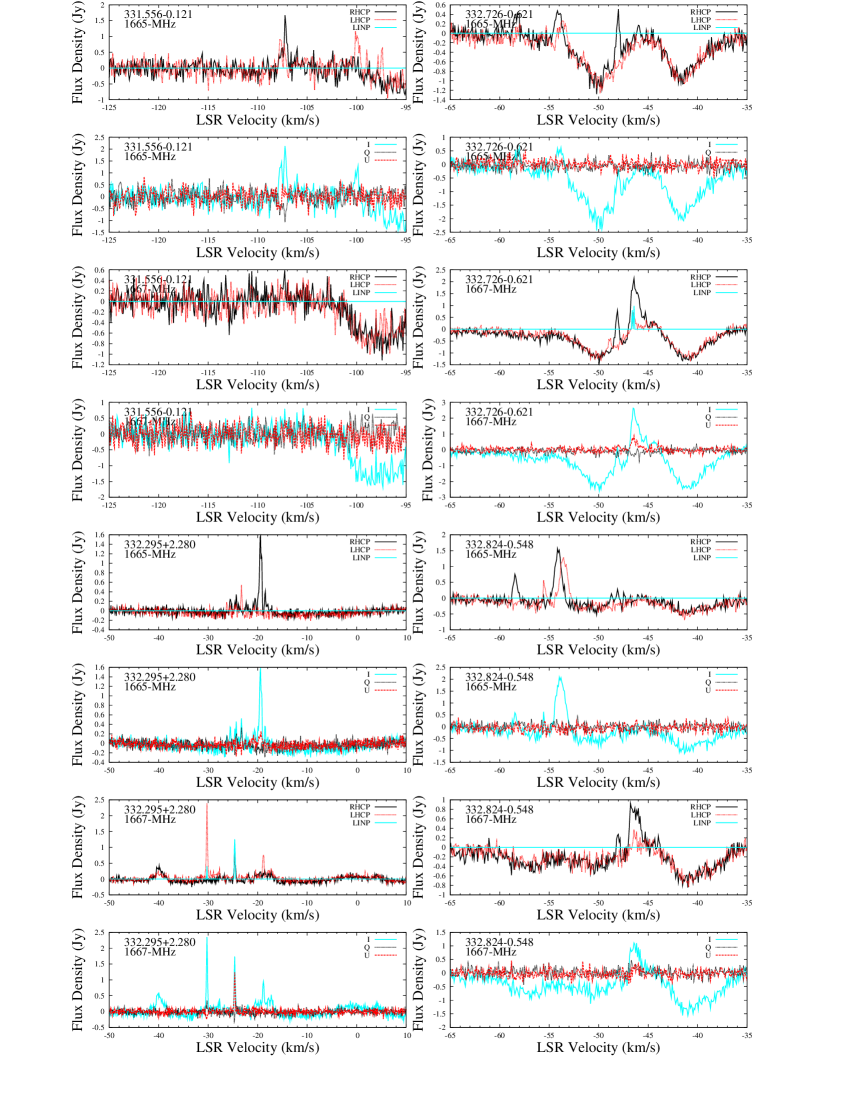
331.556-0.121
Weak emission is confined to the velocity range -103 to -96 , as first reported (Caswell 1998), with peak emission of nearly 1 Jy at -100 in 1994. Note that there is a sidelobe response to the AGB star 331.594-0.135 (offset nearly 2.5 arcmin, 1994 peak of 4 Jy from -108 to -106 , and weaker from -86 to -82 ) as reported by Caswell (1998).
332.295+2.280
The OH emission was discovered in 1990 (te Lintel Hekkert & Chapman 1996) in a search towards possible AGB stars. It was further studied by Caswell (1998) where it was conclusively shown that the emission coincided with a methanol counterpart and thus associated with a high mass star formation region (or YSO). The small velocity range of methanol emission (Caswell et al. 2011c) indicates a likely systemic velocity of -23.5 . The ATCA OH data confirm this single site as the source of all the OH features over a wide velocity range as displayed from ATCA spectra (Caswell 1998). 1667-MHz features include emission of 0.4 Jy at -40 and 0.3 Jy from -3 to +6 , as well as the stronger emission, -31 to -15 , matching the 1665-MHz emission, and symmetric about the likely systemic velocity. The 1667-MHz outlying features (displayed for 2004) are corroborated by our 2005 spectra and represent OH outflows highly redshifted (as large as 29.5 ), as well as blue-shifted (as large as 18 ). Outflow sources are discussed further in Section 4.3.
The earliest known spectra from 1990 (te Lintel Hekkert & Chapman 1996), despite lower spectral resolution of 0.9 , are very similar to the present ones, and there are no significant changes from 2004 and 2005.
Our new spectra are the first to reveal high linear polarization, especially at 1667 MHz, -24.8 .
332.352-0.117
From 2004 to 2005 we note the decay of a strong 1.7-Jy feature at -43.5 to 0.4 Jy, and of a weak (0.3-Jy) -52- feature (not seen 2005), but an increase of a broad feature 0.8 to 1.3 Jy.
332.726-0.621
Emission is stronger at 1667 than 1665 MHz, and remains similar to epoch 1978. Note that the velocity range for this source is -50 to -44 ; outside this range, the 1665-MHz features arise from the following source.
332.824-0.548
Apparent emission at 1667 MHz is wholly from the previous source. The velocity range of 1665-MHz emission is -59 to -52,5 . Note that the OH maser is offset 7 arcsec from any methanol maser (see Caswell 1998, Caswell et al, 2011c), so this is an OH maser site without an accompanying methanol maser.
333.135-0.431
Strong OH emission has remained remarkably similar to 1978, apart from a doubling of the strongest 1667-MHz feature in 2004 and 2005. The spread of positions over nearly 3 arcsec, similar to that of excited-state OH maser emission, and approximately matching the extent of a strong compact H ii region (1.4 Jy, and approximately 4 arcsec: Caswell 1997; Guzman et al. 2012), also encompasses a methanol maser. The continuum emission suggests that it is most likely to be a single extended site rather than two close sites (Caswell 1997, 1998).
333.234-0.060
The 1665-MHz spectra retain a general resemblance to 1978 and 1990 spectra, but with a new maser feature in 2004 and 2005 of LHCP at -87 . A new RHCP feature at -95.6 , 1.2-Jy, was present only in 2004 (see displayed figure); it disappeared in 2005. Most emission coincides with methanol maser 333.234-0.060, but some may arise from the nearby methanol maser site 333.234-0.062 (with velocity range -92.5 to -80 ). The 1667-MHz spectra show a single weak emission feature, and are dominated by broad absorption -96 to -83 .
333.315+0.105
The strongest feature, 1665 MHz 1 Jy at -46 , shows strong linear polarization, comparable to RHCP emission. Weak 1667-MHz emission is present at -47.5 and -46.9 (in 2005 as well as the displayed spectrum 2004).
333.387+0.032
Emission is present only at 1665 MHz, with peak at -73.5 (displaying near 100 per cent linear polarization), which extends to -70.5 . Note that apparent emission near -85 is from 333.234-0.060 (plotted alongside).
333.466-0.164
Note that emission -58 to -46 arises from 333.608-0.215 (as is clear from the aligned plot beneath), 1665-MHz emission is still similar to epoch 1978, and 1667-MHz emission is seen clearly for the first time, with a 1-Jy LHCP feature near -38.1 .
333.608-0.215
Features lie between -58 and -46 at both 1665 and 1667 MHz; they mostly resemble emission seen in 1978.
335.060-0.427
Several features are present at 1665 and 1667 MHz and, notably, at -42.7 there is more than 50 per cent linear polarization of matching 1665 and 1667 MHz emission (see Sections 6.1 and 6.3).
335.556-0.307
Weak emission is seen at 1665 MHz, and stronger emission at 1667 MHz is now observed for the first time.
335.585-0.285 and 335.585-0.289
For this pair of sources (separated by 15 arcsec), the velocity range is wide.
ATCA data from 1996 (Caswell 1998) for 335.585-0.289 show at 1665 MHz a weak feature at -58.5 and stronger features at -53.5 and -50 , and a velocity range -60 to -49 . In this velocity range, we note from our 2004 and 2005 data that the stronger features are persistent, with weak, but repeatable, linear polarization. Weak 1667-MHz LHCP emission is also now seen at -50.2 .
The ATCA data for 335.585-0.285 showed the main 1665-MHz feature near -48.0 and a weak feature at -40 ; although the weak feature is now absent, at similar velocity we do see emission at 1667-MHz. We also see 1667-MHz emission matching the 1665-MHz emission near -48 , and note that the feature has very high linear polarization at both transitions (see Sections 6.1 and 6.3).
At 1667 MHz there is an additional weak feature with high linear polarization at -49.1 . Although we cannot be sure that it is not a feature of 335.585-0.285, we tentatively attribute it to 335.585-0.289, implying a current velocity range -56 to -49 . We note that the velocities of methanol emission from the two sources slightly overlap, with ranges -51 to -43 and -56 to -50 . An additional methanol maser site 3 arcsec further south at 335.585-0.290 (velocity range -48 to -45 ) has no reported OH maser emission.
Variability has been high at both OH maser sites since 1978 (listed by Caswell Haynes & Goss (1980) as 335.61-0.31 and at that time showing a single RHCP 1665-MHz feature of nearly 3 Jy at -53.5 ), through 1989, 1993, to 2004, 2005, with the persistent feature of 335.585-0.289 showing both increases and decreases by factors of 2. In contrast, 335.585-0.285 increased from a non-detection in 1976; the 1665-MHz feature at -48 flared from 2.3 Jy (ATCA in 1996) to its current total intensity of 9 Jy total intensity (LHCP and RHCP both approximately 4.5 Jy). We recall that this flaring feature has high linear polarization, and is matched by a similar high linear polarization 1667-MHz feature at the same velocity, and thus both interpreted as isolated Zeeman components (Sections 6.1 and 6.3).
335.789+0.174
Emission remains similar to 1978, but most features at 1667 and 1665 MHz are now 3 times stronger, and 1665-MHz emission shows a wider velocity range, from -54.5 to -47.5 . Peaks at 1665 and 1667 MHz are at different velocity, but both exhibit strong linear polarization, 1667 MHz 70 per cent, and 1665 MHz more than 80 per cent.
336.018-0.827
Isolated, similar at 1665 and 1667 MHz, and with no earlier spectra of high quality.
336.358-0.137
Isolated, with weak 1665-MHz emission remaining similar since 1978 (and 1988), and weaker 1667-MHz emission now seen.
336.822+0.028 and 336.864+0.005
The sources are separated by 2 arcmin. Broad absorption prevents any confident detection of 1667-MHz emission. At 1665 MHz, features between -79 and -74 arise from 336.822+0.028 (cf. methanol -78 to -76.5 ); and in the range -90 to -86 from 336.864+0.005 (cf. methanol -82.5 to -74 ). Features at -81 and -84 were absent from ATCA spectra (Caswell 1998) at these positions but seem more likely to be at 336.864+0.005.
336.941-0.156 and 336.984-0.183
Weak, separated 2 arcmin, and features distinguishable only from ATCA information, which suggests a clear separation in velocity: 336.941-0.156 from -71 to -65 , and 336.984-0.183 from -82 to -76 . Both have weak 1667-MHz emission, and both have matching methanol masers.
336.994-0.027
1665 and 1667-MHz features span 10 , and straddle deep absorption. Weak linear polarization seen from the displayed 2005 Q and U spectra was corroborated in 2004.
337.258-0.101
In an absorption dip, this maser is quite weak, with 1667 and 1665-MHz emission near -70 , and with additional weaker 1665-MHz features extending from -64 to nearly -55 .
337.405-0.402
The 1665-MHz peak now exceeds 130 Jy (66 Jy 1978, 100 Jy 1989, 120 Jy 1993). A 1665-MHz LHCP feature at -39.9 now has a peak of 80 Jy, but was less than 5 Jy in 1978 (Caswell, Haynes & Goss 1980).
The current OH velocity range is -58.5 to -33 whereas the mid-range of methanol emission (the likely systemic velocity) is near -38 ; thus there are highly blue-shifted OH features, (especially prominent at 1667 MHz), first highlighted several years ago (Caswell 2007). There is linear polarization of more than 50 per cent at both 1667 and 1665 MHz near -36 , but notably not at exactly the same velocities. This ground-state OH site displays several other interesting properties. Although methanol emission is very close in position and almost certainly shares the same source of excitation, the nearby excited-state OH emission is offset 3 arcsec to the south (Caswell 2001, 2003) and straddles a strong compact H ii region. Further study of the H ii region by Guzman et al. (2012) confirms its position, and indicates a spectrum increasing with frequency to 139.5 mJy at 8.6 GHz, indicative of being ultra- or hyper-compact, or perhaps a thermal jet at a high mass YSO.
337.613-0.060
Most features in the displayed spectrum are from 337.705-0.053, the next source, only 4.5 arcmin away (and thus attenuated by 0.7 at this offset position), and displayed beneath this one. Unique at the target location 337.613-0.060 is weak (-Jy peak) 1665-MHz emission between -45 and -39 .
337.705-0.053
This site has previously been observed with high spatial resolution and good spectral resolution with the LBA (Caswell, Kramer & Reynolds 2011b). The spectra remain similar, and the apparent multiple Zeeman pairs are confirmed by the LBA spatial coincidences. Overall, the spectra remain similar to 1978. There is no pronounced linear polarization, demonstrated for the first time from the present spectra, and consistent with the absence from the LBA of any strong emission of both RHCP and LHCP, coincident spatially and in velocity.
1667-MHz weak emission, offset in velocity between -61 to -57 , has not previously been noted; it is weak, and in a region where the baseline is affected by broad absorption, but the reality of the features is in no doubt, since there is some circular polarization, the same in both 2004 and 2005. Its location is uncertain, but is most likely a weak ‘outflow’ from 337.705-0.053.
337.916-0.477 and 337.920-0.456
The secondary source, 337.920-0.456, offset by 75 arcsec, is a single 5-Jy LHCP 1665-MHz feature near -39 , with methanol counterpart at -38.5 .
The main source (337.916-0.477) has prominent features over the wide velocity range -56 to -34 at 1665 MHz; weak 0.5-Jy features (at both 2004 and 2005 epochs) extend this range at 1665 MHz RHCP to -63.5 , and at 1667 MHz to -31 , a total span of 32.5 . There is no accompanying methanol maser, but if the systemic velocity is near -39 (similar to 337.920-0.456, as seems likely), it would imply the most negative velocity emission is a blue-shifted outflow (see Section 4.3).
The current peak of LHC 1665-MHz emission, at -51 , in the suggested flaring blue-shifted outflow, is 43 Jy, but was less than 6 Jy in 1978. Moderate linear polarization is present, chiefly in the blue-shifted outflow.
337.997+0.136
1667-MHz emission is slightly stronger than 1665 MHz, but all features have been quite variable. The velocity span is -41 to -32.5 , with weak features outside this range attributed to 338.075+0.012, the next source, offset 8 armin, and displayed in the aligned spectra beneath. Linear polarization is more than 50 per cent in the 1665-MHz feature at -33.8 .
338.075+0.012
The velocity span is -54 to -43 (disregarding emission from the previous source). Emission is present at both 1665 MHz and, weaker, at 1667 MHz.
338.280+0.542
1665-MHz emission flared from 4 Jy in 1978 to 10 Jy in 1989 and has now fallen to 1.5 Jy. The 1665-MHz feature at -63 is 100 per cent linearly polarized. 1667-MHz emission is currently seen as a single feature at -61.6 with 60 per cent linear polarization and 50 per cent RHCP. Near this velocity, 1665-MHz features also show high linear polarization (see Sections 6.1 and 6.3).
338.461-0.245
Emission remains similar to 1978. Modest linear polarization at 1665 MHz is now seen.
338.472+0.289
Spectra remain very similar to 1978 and 1989. The 1665-MHz emission peak shows 60 per cent linear polarization, and at 1667 MHz a pure RHCP feature is present at -31.5 . Weak 1667-MHz emission is also seen at -41 .
338.681-0.084
1665-MHz emission is similar to 1978 and the strongest feature shows 70 per cent linear polarization. No 1667-MHz emission is seen, and there is no accompanying methanol maser.
338.875-0.084
More features are now evident than in 1978, and the strongest feature is now a RHCP feature at 1667 MHz. A weak 1665-MHz feature at -36.5 has linear polarization exceeding 50 per cent.
338.925+0.557
At this site, all four ground-state transitions have been seen (and are variable), and accompanied by maser emission from the 6035-MHz OH excited state, and methanol. Especially notable is the 1665-MHz LHC peak at -63.5 , which was 38 Jy in 1978 at -63.5 but now near 4 Jy, whereas the current peak of 20 Jy near -61.5 has shown little change. Some 1665-MHz features show linear polarization over 50 per cent.
339.053-0.315
Weak emission was first discovered near -110 towards a methanol maser at -110 , and our spectra suggest that it is a likely Zeeman pair. A feature now seen offset 10 at -121 is one of the narrowest ever recorded; It is pure LHCP, and accompanied by weaker emission at 1667 MHz, also pure LHCP.
339.282+0.136
The highest 1665-MHz peak, at -71 , decreased from 1.5 to 0.7 Jy between 2004 and 2005. At 1667 MHz, the single feature, at -73.5 , displays about 50 per cent linear polarization. At this same velocity there is a 1665-MHz feature which, although weak, is clearly seen from the Q and U spectra to have with similar linear polarization (see Section 6.1 and 6.3).
339.622-0.121
Considerable variability has occurred since 1978 (when the largest velocity range was seen), but the overall spectral shape is still readily recognisable at 1665 and 1667 MHz. 1720-MHz emission is present, but note that nearby 1612-MHz emission is clearly offset by 20 arcsec (Caswell 1999). Linear polarization at both 1665 MHz (at -35 ) and 1667 MHz is prominent, with some features exceeding 70 per cent, especially at 1667 MHz. The high linear polarization of the strongest 1667-MHz feature at -36.3 is matched by significant linear polarization at 1665 MHz (see Sections 6.1 and 6.3), although the coincidence is somewhat confused in the complex 1665-MHz spectra.
339.682-1.207
Note that there is a clear separation, in space and velocity, from the stronger, better-known, companion (339.884-1.259, the next source, seen as a 5 per cent sidelobe at velocities more negative than -33 ). 339.682-1.207 is now weaker than in 1982, but 1667-MHz emission has not changed as much.
339.884-1.259
The cited velocity range from -40 to -26 is taken from 1980 sensitive observations displayed by Caswell & Haynes (1983) and subsequent ATCA observations. The prominent features are now stronger than in 1980 or 1989. The 1665-MHz LHCP peak at -36.1 of 110 Jy in 2004 was less than 4 Jy in 1980; however, the RHCP peak of 30.5 Jy at -29.2 in 1980 dropped to 6 Jy in 2005. Similarly extreme changes occurred at 1667 MHz. Some remarkable changes occurred even between 2004 to 2005, demonstrated by our plots displayed for both these epochs. Several of the strongest peaks at both transitions approximately halved, whereas other features flared, for example, the 1665-MHz feature at -33.7 doubled from 7 to 14 Jy, with more than 50 per cent linear polarization.
340.054-0.244
There are similarities to spectra from 1978 and 1980, but some big changes at both 1665 and 1667 MHz, with the strongest features now three times stronger than at early epochs.
2004 and 2005 spectra show stability of linear polarization at both 1665 and 1667 MHz and, in particular, for the strongest feature at 1665 MHz, indicate more than 50 per cent linear polarization with stable ppa.
340.785-0.096
Spectra remain very similar to 1993 and fairly similar to 1980, with wide velocity range at both 1665 and 1667 MHz from -108.5 to -88.5 , comparable to matching maser emission of methanol and 6035-MHz excited OH.
341.218-0.212
There is excellent spectral agreement between 2004, 2005, and generally remarkable similarity to epochs 1980 and 1989 at both 1665 and 1667 MHz.
341.276+0.062
The current 1665-MHz spectrum is similar to 1980, and weak 1667-MHz is now detectable.
343.127-0.063
Still strong as in 1980, with LHCP at 1665 MHz approximately 100 Jy, and generally unchanged at both 1665 and 1667 MHz, We note that there is no known associated 6.6-GHz methanol maser. However, there is coincident continuum emission which is very compact at 25 GHz, with flux density 16 mJy, and rising at higher frequencies, and thus with characteristics of a ucH ii region, or perhaps a thermal jet (Brooks et al. 2007)
343.930+0.125
The strong 1665-MHz LHCP feature at +12 of 1980 doubled to 8 Jy in 1989, but is now an order of magnitude weaker. A number of weak features span the range +8.5 to +17.5 . There is no significant 1667-MHz emission, but both transitions show prominent absorption centred near +5.8 .
344.227-0.569
1665 and 1667-MHz major features remain similar in strength to 1980, and emission is now seen to extend over the wider velocity range -32 to -18 (with absorption in between) for both transitions. The strongest RHCP 1665 and 1667-MHz peaks increased more than 50 per cent from 2004 to 2005.
The systemic velocity of this source seems likely to be near -20 , based on the methanol maser peak here, and weaker methanol emission extending to both red and blue shifts (Caswell et al. 2011c). If so, then the dominant OH emission near -31 , which is persistent yet variable, and stronger at 1667 MHz, seems likely to be strong blue-shifted emission, with only weak features present near -20 at the systemic velocity (and stronger at 1665 than 1667 MHz as is most common for emission near the systemic velocity). The closely associated water maser emission, 344.228-0.569, shows a group of features from -28 to -8 , also suggestive of the systemic velocity being near -18 , and an additional feature at -51 (Breen et al. 2010b) would then be blue-shifted. Apparently in the same stellar cluster, offset by about 30 arcsec, is water maser 344.226-0.576 which shows a single weak feature at -19 , further corroborating a systemic velocity near -20 for objects near here. Thus although the OH maser is not one of the largest total velocity spreads, the above evidence indicates a distinctive blue-shifted outflow, which shows flaring activity, and shows significant linear polarization at 1667 MHz in the -31.2- feature, and also in a nearby weaker 1665-MHz feature.
The methanol spectrum likewise shows a strong asymmetry, with much stronger emission at blue-shifted rather than red-shifted velocity.
344.419+0.044 and 344.421+0.045
The spectrum (displayed for 2004) towards 344.419+0.044 is weaker than in 1980 or 1989, but the current improved sensitivity again shows dominant LHCP of the main 1665-MHz feature at , and similar in 2005. The 1667-MHz spectrum shows deep absorption matching 1665-MHz absorption, and a weak emission feature at -62.1 . Methanol emission is also present at 344.419+0.044 from -65.5 to -63.0 . There is a further, quite distinct, stronger, methanol maser at 344.421+0.045 () with features from -72.5 to -70.0 . We suggest that an OH 1665-MHz feature at -74 newly detected on our 2004 spectrum is probably from this site (offset 10 arcsec from 344.419+0.044). We accordingly list it tentatively as a new OH maser site, adopting the methanol coordinates.
344.582-0.024
At 344.582-0.024 there are multiple features which are quite strong at 1667 as well as 1665 MHz, generally remaining similar from 1980 and 1989 to the present. The most notably varying feature is 1665-MHz LHCP at -6.6 , increasing from 4 Jy 1980 (Caswell & Haynes 1983), 12 Jy 1989 (Parkes archival data), 15 Jy 1993 (Argon et al. 2000), and declining to 10 Jy 2004 and 2005. Many features show significant linear polarization. The velocity span is from -13 (at 1667 MHz) to +2 .
345.003-0.224
At our two epochs, intensities have shown 25 per cent changes. None the less, most features over the whole range -32.5 to -20.5 are clearly recognisable from 1980, 1989, and from 1998 (Argon et al. 2000), but with somewhat larger changes over the long timespan. In particular, near -31 , the 2-Jy 1665-MHz feature from 1980 has halved, its 1667-MHz near-counterpart has doubled (with even larger peak in 1998). Our linear polarization measurements are the first for this source and show more than 50 per cent linear polarization for the 1667-MHz emission near -31 , but barely significant polarization otherwise.
345.010+1.792
Variations since 1980 exceed factors of two, for example at -31 (1665 MHz), the 1980 peak of 14 Jy changed to 36 Jy (1989), to 30 Jy (1991), to 6 Jy in 2004 and 2005. The velocity range has been -31 to -14 in the past, but is currently -24 to -14 .
345.407-0.952
A weak source that is somewhat confused by absorption at both 1665 and 1667 MHz. It remains strongest (as in 1980 and 1989) at 1665 MHz, LHCP at . The 1667-MHz transition has weak but persistent (2005 and 2004) LHCP emission at -17.8 and RHCP at -16.8 .
345.437-0.074
Total intensity spectra in 1995 (from the ATCA, displayed by Caswell 1998) best reveal the quite wide velocity range and similar intensity at 1665 and 1667 MHz. The current polarization spectra show considerable differences between the transitions, and between epochs, with the displayed (2005) 1665-MHz spectrum flaring at from 0.5 (2004) to 1.1 Jy (chiefly LHCP but also with strong linear polarization).
There has been no associated methanol maser detection, but the site is, none the less, likely to be a SFR maser (rather than an AGB variety) since the site is very close to the Galactic plane where nearby OH masers have similar velocities, and an OH absorbing cloud is also seen at the same velocity.
345.487+0.314 and 345.504+0.348
345.487+0.314 is a quite distinct source offset by 2 arcmin from 345.504+0.348, as seen from Argon et al. (2000); their observations reveal it as a solitary weak 1665-MHz LHCP peak near -22.9 ; it is seen to be 0.5 Jy at -22.9 in our data from both 2004 and 2005, similar to their 1993 measurement. Note that it coincides with 6035-MHz emission (Caswell 2001, 2003), and is clearly offset by nearly 4 arcsec from methanol maser 345.487+0.314, despite the same value of their rounded Galactic coordinates.
Apart from the weak LHCP 1665-MHz feature of 345.487+0.314, all other emission seen in our spectra arises from 345.504+0.348. It remains generally similar to 1980 at both 1665 and 1667 MHz, with multiple features over the wide velocity range from -24.5 to -8 . Note that a 1667-MHz LHCP feature near -23.1 was 1 Jy in the Argon et al. (2000) data of 1993 and below 0.5 Jy in 1980 (CH83), but has flared to 4.5 Jy in 2004 and 9.8 Jy in 2005.
Linear polarization of approximately 50 per cent is present in the feature near -19.5 at both 1665 and 1667 MHz (see Sections 6.1 and 6.3).
It is worth noting that HI self absorption (Green & McClure-Griffiths 2011) indicates that both sites probably lie just beyond 1 kpc, in the Carina-Sagittarius arm, contrary to the suggestion of Caswell et al. (2010a) that 345.504+0.348 might be at 10.8 kpc, in the far side of the 3-kpc ring.
345.494+1.469 and 345.498+1.467
The two sites, with separation 18 arcsec, are blended on our single dish spectra but are distinguishable from ATCA measurements made in 1996 (Caswell 1998), with total intensity spectra yielding the individual velocity ranges which we cite in Table 1. From these ATCA spectra (resolution 0.7 ), we see for the first source, 345.494+1.469, main features near -21, -16.3 and -12.7 ; our spectra from 2004 and 2005 (displayed) now reveal the first and last features as predominantly RHCP, and the second one a more complex blend. The -21- feature was 6 Jy in 1993 (Parkes archival) but now only 0.5 Jy. There is no methanol at this first site, but there is coincident continuum emission (Caswell 1998; Guzman, Garay & Brooks 2010) with flux density 12 mJy at 8.6 GHz and weaker at lower frequency; it is likely to be an ultra- or hyper- compact H ii region, and also shows weak jet emission. 1665-MHz emission attributed (from ATCA data) to 345.498+1.467 spanned -16.5 to -13.5 ; for our spectra, this region is very much blended with 345.494+1.469, but we suggest that the strongest current peak at -16.0 is from 345.498+1.467, and is accompanied by 1667-MHz emission which is now seen to resemble a Zeeman pair. This second site, where there is also methanol, at -15 to -13.2 , has no detected continuum emission (Guzman et al. 2010).
The region also possesses further interesting maser emission: a pair of 1720-MHz emitting sites (Caswell 2004a) are offset nearly 30 arcsec south-east from the 1665-MHz emission and H ii region, but straddle weak (7-mJy, flat spectrum) extended (5 arcsec) continuum emission that might represent an earlier outflow from the compact H ii region (Guzman et al. 2010).
345.698-0.090
Multiple features at both 1665 and 1667 MHz from -11 to -3 remain generally similar to those recorded in 1980, with comparable intensities at the two transitions. An additional 1665-MHz weak feature at +5.7 is seen in 2005 but not 2004 and may be real; it lies at the edge of an absorption dip seen at both 1665 and 1667, at both epochs. This is an OH maser site with no detected methanol maser.
346.481+0.132 and 346.480+0.221
The principal source 346.481+0.132 is now weaker than in 1980 or 1989, but still dominated by a LHCP 1665-MHz feature at -8 , and with additional emission between -3 and -1.5 . The velocity range of associated methanol, -11.6 to -4.9 matches this well.
A feature at -17 is also evident in 2004 and 2005 at 1665 MHz, with a weak 1667 counterpart. Possibly the OH emission at this velocity arises from the methanol maser site 346.480+0.221 (velocity range -21 to -14 ) which is offset 3’ north and RA 22s smaller (ie 4.3 arcmin smaller), total offset 5 arcmin, and we list it as such, using the methanol position, pending confirmation of the OH location.
347.628+0.148
Strong at 1665 and 1667 MHz, with most features showing an increase from 1980 1989 1993 to 2004 (similar to 2005), and the strongest feature more than doubled. Linear polarization exceeds 50 per cent for 1665 MHz at -95.8 , and for both 1665 and 1667 MHz, at -97 (see Sections 6.1 and 6.3).
347.870+0.014
Emission (only at 1665 MHz) has remained almost identical from 1980 through 1989 to the present.
348.550-0.979 (and 348.579-0.920)
The first source has many features at 1665 MHz between -22 and -10 (the feature at -8.5 is a weak sidelobe from the following source cluster), and has remained quite stable from 1980 through 1989 to the present. 1667-MHz emission features are very weak, but confirmed in the 2005 data. The source 348.579-0.920, discovered 1993 at an offset of 4 arcmin by Caswell (1998) at 1665 MHz as a 1.4-Jy feature at -27 , is no longer detectable. Methanol masers are present at both sites.
348.698-1.027, 348.703-1.043 and 348.727-1.037
348.550-0.979 is 9 arcmin away from the targeted present cluster of sources, and is seen as weak features in the velocity ranges -21 to -19 and -15 to -12 , as is evident from the aligned spectra. Features in the present cluster (spread over 2 arcmin) are assigned to positions determined from ATCA measurements (Caswell 1998), specifically: a 0.8-Jy LHCP 1665-MHz feature at -17.0 may be from 348.703-1.043; a solitary 2-Jy RHCP 1665-MHz feature at -15.4 is from 348.698-1.027 (see also Argon et al. 2000), and is probably a long-term stable feature (reported as 348.73-1.06 by Caswell & Haynes 1983). Emission of up to 3-Jy peak between -10.5 and -2 is from 348.727-1.037, and was not detectable (below 0.5 Jy) in 1980 (Caswell & Haynes 1983), but had increased to 1 Jy in 1988 (Parkes archival spectra); it has weak accompanying emission from the 1667-MHz transition. Methanol masers are present at 348.703-1.043 and 348.727-1.037, but none at 348.698-1.027.
348.884+0.096
The currently seen features at 1665 MHz are more than three times stronger than in 1980 or 1989, but still dominated by a RHCP feature near -73 , and the 1667-MHz feature is also stronger (seen for the first time using the ATCA in 1995).
348.892-0.180
There are multiple weak 1665-MHz features from -0.5 to +14 , with appearance similar to 1980 and 1989 except for the new LHCP 1.2-Jy feature near 0 . Linear polarization exceeds 50 per cent at +7.8 . Weak 1667-MHz emission near +4.5 has persisted since the earliest discovery.
349.067-0.017
The same single 1665-MHz feature remains, as seen 1980 and 1989, predominantly RHCP. High sensitivity in 2004 and 2005 reveals weak 1667-MHz emission at +9.0 and +14.0 at both epochs.
349.092+0.106
The bulk of the emission features, both 1665 and 1667 MHz, lie between -86 and -79 . The strongest feature in 2004 and 2005, at both transitions, LHCP at -79 , was absent in 1980; an outlier near -90 seen in 1980 has weakened below our detection limit but a new outlier is present near -73 , so the velocity range is now quite large, 18 .
4 Statistics from the combined data
The data from this Paper II can be combined with data from Paper I to more than double the sample size. We note that statistics within the two sub-samples are likely to differ in some respects because there is a larger proportion of weak sources in the present sample (partly a consequence of more thorough surveys, of higher sensitivity, in the southern sky). For example, 12 per cent of sources in Paper I had peak amplitudes below 1 Jy, compared to 23 per cent for Paper II. Consequences include impacts on variability statistics, where past variability of the sources is not as well documented for weak sources; and on the fraction of sources showing linear polarization, which is smaller since it is limited for weak sources by the lower signal-to-noise ratio.
4.1 Relative intensity of emission at 1665 and 1667 MHz
Among OH masers of the SFR variety studied here, the ratio of 1665 to 1667-MHz intensity (peak or integrated) has long been known to favour 1665-MHz emission (but with a small proportion of counter-examples). Caswell & Haynes (1987a) noted that, in their sample of 120 OH masers, only 13 sources had peak intensity greater at 1667 MHz than at the 1665-MHz transition. Our new measurements now yield improved quantitative statistics; using the combined data of Paper I and the present Paper II, we find from our sample of 257 sources that for 85.5 per cent (220 sources) the strongest feature is at 1665 MHz, and for 14.5 per cent (37 sources) the strongest feature is at 1667 MHz. This is now the best estimate of this statistic in view of our large sample observed with comparable sensitivity at both transitions. We also determined the ratio of peak intensity at 1665 MHz to that at 1667 MHz for each source; we find that this ratio has a median value of 4.0. The value of this ratio is a yardstick for recognising interesting departures that may reveal systematic differences in the physical conditions in different sources. The strong source W3(OH) has been the subject of many detailed studies, and the data of Wright et al. (2004b) are representative, showing an intensity ratio for the strongest peak at each transition (1665 to 1667-MHz) of 12. This is larger than we find for a typical source, but not exceptional, since we find 18 per cent of our source sample have more extreme ratios than 12. Wright et al. (2004b) also report that most of the ensemble of features in this one source are stronger at 1665 MHz, and for the summed flux density of all features, find a ratio of 15 (1665 to 1667-MHz), similar to that of the strongest peak. However, they also investigated extensively (their section 3.1) a small subset of maser spots where the 1665- and 1667-MHz emission appears to co-propagate, i.e. the excitation of both transitions is in the same volume of gas. They were surprised to note that, at the rare locations where the 1665 and 1667-MHz transitions co-propagate, the summed 1667-MHz intensity slightly surpasses the 1665-MHz intensity, and their data show a typical ratio for individual peaks close to 1. We return to this issue in Section 6.3.
4.2 Comparisons with masers of water and methanol, and with ucH ii regions
With regard to associations of OH with water, we refer to Paper I and the analysis of a search for water towards a larger sample of OH masers (Breen, Caswell, Ellingsen & Phillips 2010b). The conclusion that 79 per cent of the OH masers have an associated water maser is expected to apply to the present sample since the majority of OH masers studied here are contained in these earlier water studies.
We now concentrate on associations between OH and methanol. Previous statistics (for maser sites of the SFR or massive YSO variety) suggested that 80 per cent of OH masers have an accompanying methanol maser (Caswell 1998). Retaining the methodology of that study (as we also did in Paper I), a simple comparison of methanol to OH is made in Table 1, listing the ratio: peak methanol intensity to peak OH intensity. Paper I showed that 87 of the 104 OH masers presented there had closely associated methanol masers, and 17 did not. In the present sample of 157 OH masers, 128 have methanol and 29 do not (essentially the same proportion) and thus the best statistics, from the combined sample of 261, show 215 (82.4 per cent) with, and 46 (17.6 per cent) without associated methanol masers.
We recall that our present source sample has been limited to maser sites believed to be associated with regions of young massive star formation. Although many sources of the sample were discovered by extensive unbiased OH surveys, there are others discovered from targeted observations, notably some cases targeting known methanol masers. We might therefore expect when a full unbiased OH survey is conducted e.g. the planned GASKAP survey (Dickey et al. 2013), that the percentage without methanol maser emission will be larger than 17.6 per cent, and that the additional OH masers without methanol would be more likely associated with ucH ii (ultracompact H ii) regions (Caswell 1996, 1997, 1998), in line with a previously noted trend. The trend has been interpreted as evidence that maser sites where OH outshines the methanol are in the later stages of evolution. A likely progression (e.g. Breen et al. 2010a) is that the volume of gas with conditions favourable to molecular maser emission in the surroundings of a young high mass star increases with time, until a point during the development of a ucH ii region when rapid quenching of the maser emission begins. It is suggested that maser emission excited by a massive YSO initially favours methanol, followed by OH main-line emission, and that the final quenching first affects the methanol, and subsequently the OH. In this scenario, sources with only methanol emission represent the earliest phase; sources with both prominent methanol and prominent OH represent a later phase; these then progress to sources with OH but very little methanol (or none), at which stage there may be a clearly detectable ucH ii region. Individual exceptions to this simplistic pattern appear to be in a minority and we suggest that the 46 OH sources with no detected methanol are prime targets for sensitive continuum measurements to see how well they fit this paradigm.
In the source notes of 3.3, we remarked on some new continuum data that have become available, more clearly revealing ucH ii regions at several OH sites where methanol appears to be weaker than OH or absent; specifically, 305.799-0.245. 317.429-0.561, 333.135-0.431, 337.405-0.402, 343.127-0.063 and 345.494+1.469.
4.3 Maser site velocity ranges and outflows
Summarising the background information of Paper I, the velocity range of emission shown by masers in star formation regions can be a useful diagnostic in several ways. Methanol masers most commonly have small velocity ranges, with a median value for the distribution of velocity range near 6 (Caswell 2009), and the mid-range velocity appears to be a good estimate of the systemic velocity. Water masers, in contrast, show a median velocity range of 15 , with the significantly higher value partly accounted for by the common occurrence of features offset from the systemic velocity by more than 30 , interpreted as high velocity outflows.
For OH masers studied in Paper I, the median velocity spread for a sample of 101 sources was 8.3 . But a velocity spread exceeding 25 was found for seven sources, whose detailed investigation suggested that there were two varieties, arising in quite different situations. The first variety arise in a late stage of the maser evolution, with a general expansion over a wide angle, possibly driven by the enclosed H ii region; the archetype discussed in Paper I was the well-studied evolved site 5.885-0.392, with a strong H ii region, displaying OH outflows both blue- and redshifted. The second variety appear to be the result of collimated outflows similar to water masers, with indications of a preponderance of blue-shifted outflows; the possible OH archetype discussed in Paper I was 24.329+0.145, with 351.775-0.536 and 19.609-0.234 suggested as further examples.
The present study has shown eight additional examples of velocity spreads exceeding 25 (see Table I, spectra, and notes of Section 3.3; we omit 328.254-0.532 from consideration here because of possible confusion with 327.237-0.547). Of these eight, the classification is not clear for candidates 301.136-0.226, 311.643-0.380, and 332.295+0.280, whereas sources with blueshifted outflows that most likely resemble 24.329+0.145 are 323.740-0.263, 327.291-0.578, 337.405-0.402, and 337.916-0.477. In particular, the blue-shifted features of 323.740-0.263 and 337.916-0.477 are, at some epochs, stronger than emission near the systemic velocity, and the outflow from 337.405-0.402 is stronger at 1667 MHz than at 1665 MHz, in contrast to emission near the systemic velocity. We also suggest that 314.320+0.112 belongs to this group, with systemic velocity near -45 where the strongest peak occurs for OH, methanol and water. Weak blue-shifted water emission extends to -70 . Weak methanol emission in the range -59 to -55 also seems likely to be outflowing material, although such outflows seem rare amongst methanol masers. The OH 1665-MHz spectrum in 1996 (Caswell 1998) showed blue-shifted emission near -73 stronger than at the systemic velocity. It is no longer present, but our 2005 spectra (displayed) show a broad weak plateau of blue-shifted emission strongest at 1667 MHz.
Our present extended study thus supports the argument for the existence of a distinct group of OH masers with blue-shifted outflows. They have been recognised from our statistics as sources with wide velocity range. No doubt others occur (for example 309.918+0.123) but do not exceed our velocity range threshold, and it is generally more difficult to recognise these. However, two striking examples that we argue should be added to this class of blue-shifted outflows are 12.908-0.260 (details in Paper I) and 344.227-0.569 (see details in Section 3.3 of present paper). In both instances, the velocity range has a modest value of 14 , but is chiefly caused by the offset from the systemic velocity of dominant and variable blue-shifted features (which are strongest at 1667 MHz and, in the case of 12.908-0.260, have exceptionally high linear polarization).
We also noted in Section 3.3 the rejection of an apparent red-shift outflow candidate (322.158+0.636), which seems likely to be a separate offset source with different systemic velocity; and uncertainty in the systemic velocity of another red-shift outflow candidate (300.504-0.176).
Recognition of blue-shifted outflows as a distinct characteristic began as a qualitative impression from perusing many spectra over many years. Since the objects are quite rare, it was difficult to put this recognition on a rigorous quantitative statistical footing. In the case of water masers, this has now been achieved (Caswell & Breen 2010), with extensive evidence for an unusual class of water masers that show high velocity outflows favouring blue-shifts (Caswell & Phillips 2008; Caswell & Breen 2010; Caswell et al. 2011a; Motogi et al. 2011; 2013); these primarily occur where there is neither OH emission nor readily detected ucH ii continuum emission, consistent with an interpretation that they are confined to an early evolutionary phase of massive star formation. However further work is needed on this matter, and similar investigations are required for the OH blue-shifted outflow sources.
4.4 Variability of OH masers
Details of variability are given in the source notes of Section 3.3. Among the 155 southern sites with observations in both 2004 and 2005 presented here, only 285.263-0.050 and 323.740-0.263 show changes by a factor of two in their strongest feature, and two additional sources, 318.050+0.087 and 339.884-1.259, show changes by nearly a factor of two. In the complementary northern region covered by Paper I, among the 99 sources observed in both 2004 and 2005, five showed similar prominent variability. Combining data from Papers I and II yields nine prominent variables among a sample of 254 sources, i.e. between three and four per cent. Since this statistic indicates the variability of the strongest feature, it is a useful indicator that a single epoch survey is unlikely to miss more than a few per cent of sources that might be detectable in a similar survey conducted one year earlier or later.
Our spectra also provide a valuable reference for longer term variability. From the combined northern and southern regions, past variability can be investigated for at least 187 sites which have suitable archival data over several decades (notably those with earlier published Parkes spectra, identified with a ‘c’ in the Refpol column of Table 1). This is the largest source sample to date for variability studies over a long timebase. From observations over several decades, the sample has shown high variability (intensity changes by factors of 4 or more in some prominent features) for at least 10 per cent of the 187 masers. Six examples were discussed in Paper I. A further 12 examples from this paper are: 312.598+0.045, 316.811-0.057, 318.050+0.087, 318.948-0.196, 320.232-0.284, 322.158+0.636, 327.291-0.578, 331.278-0.188, 337.405-0.402, 337.916-0.477, 338.925+0.557, and 339.884-1.259 (see details in the notes of Section 3.3). Although the majority of sites possess many spectral features that are persistently detectable over these several-decade-long intervals, they mostly show some variability, evident from the changing relative intensities of different features within a source. Remarkably few of the sites (less than 10 per cent) show no reliable evidence of variability. Recognition of variability is hampered by calibration uncertainties, noise, slight differences in spectral resolution and the sparseness of data points. With dedicated monitoring and stable observing procedures, it seems likely that all of the masers vary at the 5 per cent level over several decades. It will be of special interest to monitor those sites that have not yet shown variability to assess whether this is so. Apparently stable sources from the present paper include 328.809+0.633, 333.135-0.431, 336.358-0.137, 341.218-0.212, 347.870+0.014 and 349.067-0.017.
Our data set has not only allowed preliminary characterisation of past variability at each maser site, but is an excellent yardstick for recognising future variability. A comparable data set of spectra obtained 2010-2012 is being prepared from the MAGMO project, following the MAGMO pilot study (Green et al. 2012b). The combination of the present data set with MAGMO, together with variability studies of methanol masers, will allow selection of candidates that merit more intensive future monitoring. Since the early discovery of OH maser variability many decades ago, variability studies have languished. Such studies now appear ripe for re-investigation, following the clear recognition of periodicity in some of the methanol masers that accompany them, and the first indication of an OH maser with periodicity at 1665 and 1667 MHz, matching the methanol (Green et al. 2012a). Future in-depth studies of variability will require the tracking of intensity for all individual features, and although single dish measurements are sufficient for simple sources, more complex sources with many spectral features benefit from higher spatial resolution to distinguish components that overlap in velocity. Monitoring programs at VLBI resolution are not yet practical for large numbers of sources, but the wide-field mapping capability of future telescopes such as ASKAP will provide simultaneous observations of a large ensemble of sources at modest spatial resolution, and make frequent monitoring feasible (Dickey et al. 2013).
It seems likely that several distinct variability mechanisms are at play. Most readily spotted are the ‘flares’, followed by decay, of single features amongst other more quiescent features. More easily overlooked are amplitude changes that are smaller, but are simultaneously present in the majority of features; their study requires a higher level of calibration precision. The latter variables may be more indicative of periodic effects. With recognition of at least two different mechanisms in variability, and their interplay, we may hope to make better progress in studying them. It may be that the most promising candidates for detecting periodic variability can best be recognised amongst sources with persistent overall similarity in spectral shape, with only modest amplitude changes, and that the periodicity is most clearly manifested as periodic decreases rather than periodic flares (Green et al. 2012a).
5 Circular polarization of the OH emission
When large uniformly studied samples of sources are available, almost all sites display some circularly polarized features, in some cases essentially 100 per cent polarized (e.g. Szymczak & Gerard 2009). The same is true of the sources of Paper I and the present sample. The Zeeman effect in magnetic fields of several mG is responsible for the circular polarization, and the presence of a Zeeman pair of the frequency-shifted components of a Zeeman pattern is sometimes strongly indicated even in single dish spectra such as ours. Many of the present OH masers will soon be the subject of further study with the additional spatial resolution of the ATCA (see Green et al. 2012b) and thus, in most cases, we defer interpretation of circular polarization until the new observations are accessible. However, in the three special cases of Zeeman triplets, where we find components associated with linearly polarized components, we discuss them in the following section concerning linear polarization.
6 Linear polarization of the OH emission
The Zeeman effect that satisfactorily accounts for the observed circular polarization is expected to also give rise to a linearly polarized component, unshifted in frequency (velocity) by the magnetic field, midway between the velocity-shifted Zeeman component pairs that are predominantly circularly polarized. The relative prominence of and components depends on the magnetic field orientation with respect to the line of sight. The expectation is that all components will be 100 per cent linearly polarized, whereas all components will have some linear polarization accompanying the circular (i.e. net elliptical) except when the field is precisely aligned along the line of sight between observer and source. Comparing these expectations with measurements to date, we first note that full Zeeman triplets have proved to be remarkably elusive, with the sole commonly accepted candidate, at 1665 MHz, in 81.871+0.781 i.e. W75N (Hutawarakorn, Cohen & Brebner 2002; Fish & Reid 2006). More generally, the expectation that the majority of features will display some linear polarization is not borne out. Quantitatively, the prevalence of linear polarization partly depends on the statistic used, as is clear from the study of 18 fields using the high spatial resolution of the VLBA by Fish & Reid (2006). On the one hand, they found only one field with an absence of linear polarization (no significant linear polarization amongst nearly 200 features of 49.488-0.387). But when considering polarization of the 1000 individual features distinguishable in all 18 fields, they found the majority (two-thirds) with no significant linear polarization. Of the one-third that do have significant non-zero linear polarization, they identify some as the components of their 184 listed Zeeman pairs, and speculate that the remainder are a mixture of and components. In general they were unable to reliably distinguish and components except for a localized group of features in 81.871+0.781 (the site which is also host to the sole example of a Zeeman triplet). One motivation for our present study was to search for possible Zeeman components among the much larger sample of 200 distinct maser source sites - an order of magnitude larger than has hitherto been studied - in the hope of establishing whether components are indeed intrinsically rare. This is important because there have been suggestions that the apparent rarity of components is a real deficiency, and could be caused by magnetic beaming which may preferentially favour maser emission along the magnetic field lines rather than transverse to them (Gray & Field 1994, 1995).
We first consider the general statistics on the occurrence of linear polarization, as revealed in single-dish measurements (of low spatial resolution). A major study was conducted in a sample of nearly 100 sources by Szymczak & Gerard (2009), who found that some linear polarization was detectable in 80 per cent of 1665-MHz spectra and 62 per cent of 1667-MHz spectra; the smaller fraction at 1667 MHz is most likely due to the relatively weaker overall emission and fewer features, thus limiting polarization detectability to a smaller fraction of sources. In our sample of Paper I, we found linear polarization statistics similar to Szymczak & Gerard (2009).
Here we perform the same investigation for sources in the present sample, which can then be combined with Paper I statistics to provide a larger sample and more significant statistics.
We find detectable linear polarization at 1665 MHz in 93 of 138 sources (excluding from the sample the sources with lowest signal to noise ratio, typically those with no feature above 0.5 Jy, for which our polarization sensitivity was inadequate, as noted in Paper I). At 1667 MHz, we found detectable linear polarization in 51 of 87 sources (similarly excluding the weakest sources). Combining the statistics with those from Paper I (74 out of 89 at 1665 MHz and 39 out of 70 at 1667 MHz), our totals are 167 out of 227 (73.6 per cent) at 1665 MHz; and 90 out of 157 (57.3 per cent) at 1667 MHz.
These results establish unequivocally that the presence of linear polarization is common, even in data of low spatial resolution single dish measurements, despite these being subject to ‘beam depolarization’. In detail, when combined within the large beam, maser spots at the same velocity which would be spatially distinct at higher resolution, will simply add in total intensity, but their linear polarization will partially cancel unless they have identical ppa. For example, for equal linearly polarized signals differing in ppa by 90∘, the net linear polarization will fully cancel; if differing by 60∘, the net linear signal will be halved. While this reduces the number of features likely to exhibit high linear polarization in single dish observations of complex sources, the argument can usefully be inverted to infer that, when high linear polarization is seen, the emission arises predominantly from a small region with well-defined ppa, rather than being a blend from many unrelated spatially separate regions.
Thus those sources where we find at least one feature with strong linear polarization are of special interest. Retaining the criterion used in Paper I, in our present sample we find features that are at least 50 per cent linearly polarized at 1665 MHz in 36 out of 138 sources, and at 1667 MHz in 15 out of 87 sources (10 of the 15 are also within the group of 36 highly polarized at 1665 MHz so the total number of sources with high linear polarization is 41). Combined with the data of Paper I, we find high linear polarization at 1665 MHz in 68 out of 227 sources (30 per cent) and, at 1667 MHz, in 32 out of 157 (20.4 per cent). These fractions are similar to those found from the subset of sources in Paper I alone and, likewise, similar to those of Szymczak & Gerard (2009).
6.1 Individually interesting sources with linear polarization of their OH emission
Amongst the 41 individual instances of sources with high linear polarization at either 1665 or 1667 MHz, we single out 16 special examples. They fall into three sub-groups (Sections 6.1.1, 6.1.2, 6.1.3), the first associated with blue-shifted outflows with high variability (a category noted in Paper I with two examples, to which we add one new one). The second sub-group comprises three sources, each with a linearly polarized feature that we identify as a component of newly recognized Zeeman triplets. The third sub-group is the largest, where sources display a linearly polarized feature of 1667 and of 1665-MHz emission at the same velocity, and the degree of linear polarization is high in at least one transition. These have no prominent nearby emission that could represent the complementary components of Zeeman triplets, and thus seem to be prime candidates for isolated components; they will occur where the magnetic field is predominantly in the plane of the sky, a field configuration where corresponding velocity-shifted components will be the weaker components, with low circular polarization and likely to be unrecognizable. The implication of the velocity coincidence of components at the two transitions is that they are extremely close, and effectively co-propagating. We discuss these matters further in Section 6.3.
We now summarize our data for each of the 16 sources that display linearly polarized features of special interest, and reassess data for similar sources from Paper I. The two sub-groups associated with Zeeman patterns will then be discussed extensively in Sections 6.2 and 6.3.
6.1.1 Highly linearly polarized features associated with blue-shifted outflows of high variability.
323.740-0.263 displays more than 70 per cent linear polarization in a 1665-MHz feature near velocity -80 . The source also has two other (probably related) remarkable properties as already discussed in 4.3 and 4.4, namely, the strongly polarized feature is in an outflow that is highly blue-shifted with respect to the systemic velocity near -50 ; and the feature has shown remarkable flaring, especially from 2004 to 2005 (section 4.4), becoming the strongest feature in the whole source in 2005, as is evident from the spectra that we have shown for both epochs. This remarkable source should be grouped with two other sources that were reported in Paper I: 12.908-0.260 which shows even higher linear polarization in a blue-shifted feature that flared (becoming the strongest feature, exceeding 100 Jy, in 2005), in this case at 1667 MHz; and the source 24.329+0.145, the archetypal OH site dominated by an outflow at a number of blue-shifted velocities, variable, with high linear polarization, and in this case with the outflow detected only at 1667 MHz.
6.1.2 Highly linearly polarized features interpreted as Zeeman components of three newly recognized Zeeman triplets.
297.660-0.973. Linear polarization is 90 per cent for the strongest 1665-MHz feature, at +27.6 , stable in ppa (close to 145∘ based on the negative value of U and the weaker, but positive, value of Q) from 2004 to 2005. Past evidence showing no net circular polarization is consistent with the high linear fraction being a persistent long-term property (at least since 1982). The feature lies midway between weaker features of LHCP emission at +25.6 and RHCP at +29.6 , a separation that would imply a magnetic field of +6.8 mG. If the linearly polarized feature is a component, between matching components, its dominant flux density would suggest a magnetic field almost in the plane of the sky. Furthermore, there is a hint of linear polarization in the stronger putative component at +25.6 with a ppa near 45∘ (positive U), approximately orthogonal to the ppa of the component, as expected for a true Zeeman triplet.
309.921+0.479. The outstanding feature at this site is at -61.8 where the strongest 1667-MHz emission occurs, and is essentially 100 per cent linearly polarized, and thus a prime candidate for a Zeeman component. Q is positive and U is of similar magnitude but negative (and thus the ppa is approximately 157.5∘). At more negative velocity, the only 1667-MHz emission is weak RHCP at -63.1 , offset -1.3 from the linearly polarized feature. Two prominent features are at less negative velocity, most notably the LHCP feature at -60.5 , offset +1.3 from the putative Zeeman component. The pattern thus appears to be a Zeeman triplet, in a magnetic field of -7.3 mG (assuming a splitting factor of 0.354 ).
330.953-0.182. With regard to high linear polarization, there is a single 1665-MHz feature, at -88.2 , with total intensity of nearly 10 Jy and linear polarization 7 Jy. This site has been studied at high spatial resolution (0.2 arcsec) with the LBA (Caswell, Kramer, Reynolds & Sukom 2010a) which shows 1665-MHz features near -89.5 (RHCP), -87.2 (LHCP) and -88.2 (strong at both R and LHCP), all arising from the same site, isolated and quite distinct from the majority of OH features which arise from a more extended nearby complex 330.954-0.182. The RHCP and LHCP features were interpreted as a Zeeman pair, Z1, by Caswell et al. (2010a), with magnetic field -3.7 mG. A pair of features, LHCP at -87.68 and RHCP at -89.80 are another likely Zeeman pair in the same region, (but not remarked on by Caswell et al. 2010a). At the LBA resolution, there are thus 5 features distinguishable in position or velocity. The LBA data did not record linear polarization, but the equal intensities of RHCP and LHCP at -88.2 prompted Caswell et al. (2010a) to suggest that this feature might be linearly polarized, and indeed we now see it to be so, 70 per cent linear polarization, with ppa close to +22.5∘ (U and Q positive and approximately equal). We suggest that it is the component of Z1, closely matching the mean velocity, -88.4 of Z1, although with a formal offset in position of 0.2 arcsec (close to the LBA beamwidth to half-power). We interpret it as a Zeeman triplet.
6.1.3 Linearly polarized features of 1665 and 1667-MHz transitions coincident in velocity; interpreted as components of a Zeeman pattern, where the two transitions approximately co-propagate.
324.200+0.121. In this source, the strongest feature at both 1665 and 1667 MHz is at the same velocity, -91.6 , and displays close to 50 per cent polarization at both transitions.
327.120+0.511. Linear polarization of more than 50 per cent is present at 1665 MHz in three features, one of which, at -84.80 , shows nearly 50 per cent linear polarization at 1667 MHz.
327.402+0.444. Linear polarization of more than 50 per cent is present in a weak feature at -82.5 with peak flux density near 0.5 Jy at both 1665 and 1667 MHz.
331.342-0.346. High linear polarization of 90 per cent is present at the strongest 1667-MHz feature; prominent linear polarization is also present at the strongest 1665-MHz feature which, notably, is at the same velocity, -66.95 .
335.060-0.427. 1667 and 1665-MHz emission features at the same velocity, -42.7 , both have a high degree of linear polarization.
335.585-0.285. The feature at velocity -48.0 has linear polarization near 100 per cent at 1665 and 1667 MHz.
338.280+0.542. 1667-MHz emission is currently seen as a single feature at -61.6 with 60 per cent linear polarization and 50 per cent RHCP. Near this velocity, 1665-MHz features also show high linear polarization. The 1665 feature at -63 has even more striking linear polarization, essentially 100 per cent, but has no 1667-MHz counterpart.
339.282+0.136. The high linear polarization of a 1667-MHz feature at -73.5 is matched by similar polarization of a weaker 1665-MHz feature at this velocity.
339.622-0.121. The high linear polarization of the strongest 1667-MHz feature at -36.3 is matched by significant linear polarization at 1665 MHz. Other features also show high linear polarization.
345.437-0.074. High linear polarization is present at both 1665 and 1667 MHz near -24.2 .
345.504+0.348. There is high linear polarization at both 1665 and 1667 MHz near -19.5 .
347.628+0.148. Linear polarization exceeds 50 per cent at -97 for both 1665 and 1667 MHz. More generally, there is prominent linear polarization displayed by many features which has persisted over nearly 1 year from 2004 and 2005.
In Paper I, eight examples similar to the twelve listed above can be recognised in the Table of source properties, but were not explicitly discussed in Paper I. Here we list these further examples from Paper I so that the whole sample of 20 from Papers I and II can be considered together in the subsequent discussion of Zeeman components in Section 6.3.
356.662-0.264. The dominant features are at -54.0 , with LINP 1.6 Jy at 1665 MHz and 0.4 Jy at 1667 MHz compared with total intensities of 2.0 and 0.5 Jy respectively.
8.683-0.368. A 1667-MHz feature at +40.8 has LINP flux density 0.8 Jy (80 per cent of the total intensity) and at the same velocity is the highest LINP of 1665-MHz emission, 1.3 Jy (65 per cent of the total intensity).
9.621+0.196 (sometimes referred to as 9.62 with the suffix ‘e’, or ‘north’). Our data show a 1667-MHz feature with the strongest LINP of 6 Jy (55 per cent of the total intensity) at +1.5 ; at this velocity is a matching 1665-MHz feature with LINP 3.5 Jy, but its total intensity is clearly blended with other features. This source was mapped with the VLBA in 2001 (Fish et al. 2005) and their 1667-MHz emission corroborates our 1667-MHz measurement of LINP, with the same ppa as our measurement (Q negative and U small positive), 80∘. The VLBA measurement of 1665-MHz emission shows a feature at essentially the same velocity, and with LINP 3.19 Jy; within a fraction of the VLBA beamsize (36 x 22 milliarcsec) it coincides with the 1667-MHz feature, and the VLBA is able to spatially distinguish it from a nearby feature (stronger in total intensity but with lower LINP), that overlaps in velocity (at +1.77 ). To VLBA precision we conclude that the linearly polarized features (at +1.5 ) at the two transitions are spatially coincident, and stronger at 1667 MHz than at 1665 MHz.
10.444-0.018. The feature at +75.4 is quite distinct at 1667 MHz with LINP 1 Jy and total intensity 2.5 Jy. Its counterpart at 1665 MHz is weaker, with total intensity 0.5 Jy and LINP 0.3 Jy (evident from Q and U spectra).
10.473+0.027. The 1667-MHz feature at +65.2 has LINP 0.7 Jy and total intensity 1.2 Jy. Its counterpart at 1665 MHz is confused by stronger features at slightly higher velocity, but we estimate its LINP to be 0.3 Jy (evident from Q and U spectra), and total intensity 0.6 Jy.
12.889+0.489. Spectra at both 1665 and 1667 MHz show a feature at velocity +31.6 which has high linear polarization (Green et al. 2012a; and Paper I). The velocity is strikingly the same at both transitions, and the position angles of linear polarization are similar. It is an isolated feature spatially and spectrally. Observations in 2004 and 2005 (Paper I), as well as a series of observations in 2010 and 2011 (Green et al. 2012a), and the measurements in 2003 of Szymczak & Gerard (2009) confirm the persistence of these features over more than 8 years. We interpret them as Zeeman features, with 1665-MHz intensity of nearly 1 Jy and 1667-MHz slightly weaker.
30.703-0.069. The strongest feature at both 1665 and 1667 MHz appears to be a blend, with peak at velocity +91.1 predominantly LHCP. The components at slightly lower velocity, +91 , have a higher level of linear polarization, with LINP 4.6 Jy at 1667 MHz and 3.9 Jy at 1665 MHz, and we interpret them as Zeeman features, with percentage linear polarization greater than 50 per cent but difficult to measure in view of the blending.
35.197-0.743. In this source, the 1667-MHz main feature with total intensity peak of 1.0 Jy at +29.1 has linearly polarized emission of 0.8 Jy (80 per cent linearly polarized). At 1665 MHz, a clear counterpart matches in velocity with a linearly polarized emission peak of 1.8 Jy, but corresponding to only 25 per cent linear polarization, and RHCP emission stronger than LHCP. From MERLIN studies of (only) 1665-MHz emission in 1993 with 0.2 arcsec spatial resolution, Hutawarakorn & Cohen (1999) interpret a feature at this velocity as the RHCP component of their Zeeman pair Z3, although they measure higher linear polarization (62.5 per cent) than circular (58.1 per cent). We suggest this is blended in the MERLIN beam, where it contains both the RHCP component of Z3, and also the highly linearly polarized counterpart to our 1667-MHz feature. With this interpretation, the linearly polarized emission is the component of a different maser spot that has no detectable counterparts, partly because the magnetic field lies close to the plane of the sky. It is spatially near Z3 in projection, but offset from the ‘de-magnetized’ velocity of Z3 by 0.9 . The corresponding 1667-MHz feature in our measurements is nearly half the intensity of the 1665-MHz feature.
More detailed consideration is now given separately to the two classes of candidate components.
6.2 Candidate Zeeman components in triplets
We first summarize additional data on each of the three new triplets, and then consider generalizations from the class as a whole.
297.660-0.973. We noted in Section 6.1.2 that the 1665-MHz data showed clear evidence for a Zeeman triplet, centred at +27.6 , with magnetic field +6.8 mG. The dominant component indicates a field close to the plane of the sky. There are no matching features at 1667 MHz near this velocity, but centred at +24.8 there is a convincing Zeeman pair (detectable in 2004, 2005 and, with hindsight, persistent from 1982), separation 2 with LHCP more positive, and thus in a field almost as large, but of opposite sign, -5.65 mG. Since the Zeeman splitting is a measurement of the full field strength (rather than line-of sight component), the similarity of the field magnitudes further supports the idea that the field in the source is mostly close to the plane of the sky, and it is very plausible that small variations in field direction would lead to some locations showing fields of opposite sign with respect to the line-of-sight. An associated water maser is present but no methanol. The nearby continuum shows an extended H ii region of several arcmin diameter with measured recombination line emission centred at +28 (Caswell & Haynes 1987b). The large positive velocity indicates a location outside the solar circle in a distant portion of the Carina-Sagittarius arm, at a distance of about 10 kpc. No high resolution continuum image is available to see whether the old extended H ii region is accompanied by compact features indicative of more recent star formation. The absence of any nearby methanol maser suggests the site may be relatively evolved, and the presence of an associated water maser (Breen et al. 2010b) is compatible with this, since the water masers often survive into the later evolutionary stages of a high mass SFR.
309.921+0.479. We noted that the 1667-MHz spectrum shows a Zeeman triplet centred at -61.8 , with splitting corresponding to a magnetic field of -7.3 mG.
The 1665-MHz emission is more confused, and there is no clear evidence for a matching Zeeman triplet. However, excited-state OH measurements (Caswell 2003, 2004b) clearly demonstrate several Zeeman pairs that reveal a mixture of positive and negative magnetic fields, indicating that there must be some locations where the field is in the plane of the sky. This is corroborated by another long-known property of the 6035-MHz emission, namely, the strong linear polarization of a feature at -59.55 (Knowles et al. 1976). Irrespective of whether this is a or component, the linear polarization is further evidence for a magnetic field close to the plane of the sky in at least some portions of this source. Thus the presence of a triplet is not unexpected.
More directly related to the present 1667-MHz triplet are specific features in the excited-state OH spectra, revealing likely Zeeman pairs centred near the velocity of the Zeeman 1667-MHz triplet. At 6035 MHz, RHCP is at more negative velocity than a LHCP feature, separation 0.2 , and at 6030 MHz, RHCP is at more negative velocity than a LHCP feature, separation 0.25 . Adopting the usual Zeeman splitting factors of 0.056 and 0.079 respectively, gives magnetic field estimates of and mG. The features at each polarization both appear to be broadened in velocity, suggesting the overlap of several maser spots, all with similar magnetic field. Overall, the excited-state and the 1667-MHz data concur that there is a negative magnetic field near this velocity, but small offsets of mean velocity indicate that the different transitions are not strictly co-propagating, which readily accounts for the different magnitude of the field estimate. There is a strong, 0.5-Jy, ucH ii region at this site, suggestive of a quite late evolutionary stage.
Sources between Galactic longitudes 284.5 and 295∘ show positive fields (Green et al. 2012b), all of them located in the Carina arm, which is viewed along its length in this longitude range. The fact that 309.921+0.479, with its internal field ‘reversals’, and a likely predominant field orientation close to the plane of the sky, clearly does not fit this pattern, is not surprising, since it does not lie in the Carina arm, but in the Crux-Scutum arm, near its tangent point as viewed from the Sun, at a likely distance of 4.8 kpc.
330.953-0.182. The Zeeman triplet at this site yielded a magnetic field of -3.7 mG, and has a flux density in the component similar to or larger than the components, and thus the field orientation has a significant (perhaps dominant) component in the plane of the sky rather than along the line of sight. Other Zeeman pairs in the adjacent complex 330.954-0.182 indicate fields of similar magnitude and the same negative sign; however, a field of opposite (positive) sign is shown by a loosely related 1720-MHz maser site (offset by several arcsec and probably in the same star forming complex). A field reversal suggests that the true field may be mostly in the plane of the sky, perhaps over the whole region. As summarized by Caswell et al. (2010a), continuum emission in the vicinity appears to be resolved into an extended complex of several arcsec extent encompassing the nearby maser features of 330.954-0.182 and, at the location of the maser features of 330.953-0.182 discussed here, a more compact ucH ii region of about 40 mJy. The distance was estimated to be at least 5.6 kpc. Excited-state OH emission at 6035 MHz and methanol maser emission also arise from 330.953-0.182 (Caswell 2003) but has not been detected at the offset, more extended site, 330.954-0.182.
The four known Zeeman triplets display a range of properties which we now summarize. Three are at 1665 MHz and one at 1667 MHz, thus both transitions are represented. Distances vary from 1.3 kpc (81.871+0.781) to approximately 10 kpc, with the 1667-MHz example lying at intermediate distance, 4.8 kpc. All except 297.660-0.973 (the most distant) have an associated methanol maser, and associated continuum emission likely to be a ucH ii region (the weakest being the nearest, 81.871+0.781, only 10 mJy). 297.660-0.973, with no associated methanol, may be more evolved, and lies towards an extended H ii region observed only at low spatial resolution; however, in order to distinguish any possible closely associated ucH ii region, we will require observations of high resolution combined with high sensitivity, since it lies at a greater distance than any of the others.
6.2.1 The precision of spatial coincidence in Zeeman triplets or pairs
The tolerance in spatial coincidence needed to identify Zeeman pairs has been discussed by Fish & Reid (2006). Many Zeeman pairs fail the criterion of coincidence to within the measurement precision when that precision has been measured from the longest baselines of VLBI observations, and yet the derived magnetic field appears satisfactory. This is attributed to spatial clusters of maser spots that possess the same velocity and a common value of magnetic field, and thus the components of an apparent Zeeman ‘pair’ often arise from different spots in the same cluster, with no major impact on the validity of the field measurement. Fish & Reid (2006) suggest a loose distinction between ‘true’ Zeeman pairs and Zeeman ‘cousins’ of slightly larger spatial separation, Overall, too tight a criterion of coincidence would not be helpful, since it would remove many excellent determinations of magnetic field. Indeed, Fish & Reid’s (2006) measurements of the Zeeman triplet 81.871+0.781 show deviations from coincidence much greater than the position uncertainties (several times larger than the beam width) and yet it is most useful to treat it as a true triplet. Thus an understanding of the clustering has been an important step in evaluating the reliability of magnetic field determinations. Spatial resolution just sufficient to distinguish separate clusters is usually adequate. With this in mind, we regard the position discrepancies (greater than nominal errors) between components of our proposed triplet 330.953-0.182 as acceptable.
6.3 Candidate Zeeman components with no triplet association
Our criterion for identifying these components (in the absence of a recognisable Zeeman triplet) is the velocity coincidence of the linearly polarized feature at 1665 and 1667 MHz (noting that components of Zeeman patterns arising from the same physical region at the two transitions would be differently shifted in velocity; only matching components can remain at the same matching velocity). We are not aware of any earlier use of this criterion to identify components. The above results show the criterion to be spectacularly successful, with 40 suggested features (20 at each transition) whereas previously the only confidently claimed was the one example in a Zeeman triplet.
The two transitions arising from the same physical region implies near co-propagation. Although the coincidence of the two transitions in velocity has been established, the spatial coincidence remains to be tested. Fortunately, in one example, 9.621+0.196, the high precision spatial measurements at both transitions already exist. As previously discussed in detail (Section 6.1.3), they indeed support our suggestion of spatial coincidence, as well as corroborating the linear polarization measurements (despite a difference in measurement epoch of 3 or 4 years). Similar observations are needed for the other candidates to assess the precision of coincidence between 1665 and 1667-MHz features.
Other distinctive properties might be associated with the suggested co-propagation, and here we explicitly explore intensity ratios of the transitions for the suggested components. Summarizing the information in section 6.1.3: of the eight candidates from Paper I, 9.621+0.196, 10.444-0.018, 10.473+0.027 and 30.703-0.069 are all stronger at 1667 MHz, by small factors, and 356.662-0.264, 8.683-0.368, 12.889+0.489 and 35.197-0.743 are all stronger at 1665 MHz, again by small factors. Of the twelve instances in Paper II, in two (339.282+0.136 and 339.622+0.121), the 1667-MHz intensity exceeds the 1665-MHz intensity, in five others (324.200+0.121, 327.402+0.444, 331.342-0.346, 335.060-0.427 and 338.280+0.542) they are approximately equal, in three cases (345.437-0.074, 345.504+0.348 and 347.628+0.148) the 1665-MHz intensity is greater by a factor near two, in 327.120+0.511 a factor of nearly four, and in only one case (335.585-0.285) is the 1665-MHz intensity much greater than at 1667 MHz.
Thus the typical 1667 and 1665-MHz intensities in the putative co-propagating features are nearly equal (i.e. the ratio of 1665 to 1667-MHz intensity has a median value close to one), whereas the ratio for the vast majority of features is 4, as estimated in Section 4.1. We also noted in Section 4.1 that Wright et al. (2004b) found, in their detailed study of the W3(OH) site, that most of the stronger features are at 1665 MHz rather than 1667 MHz, and for the sum of all features, the flux density at 1665 MHz is 15 times larger than at 1667 MHz; in contrast, they found that, at six locations where the two transitions appear to co-propagate, the 1667-MHz intensity in most cases nearly equals or surpasses the 1665-MHz intensity. Thus our result appears to support the finding by Wright et al. (2004b), with regard to a distinctive intensity ratio for the rare co-propagating regions, compared to the average for all features. However it is not clear whether this might be a trivial result, since regions selected by apparent co-propagation necessarily have moderately similar intensities at the two transitions. We finally draw attention to a difference between our sample of likely co-propagating features and those of Wright et al. (2004b): the features that they consider are, in all cases, Zeeman components; thus although the spatial coincidence of the two transitions is a direct measurement (at milliarcsecond precision), the velocity ‘coincidence’ is necessarily indirect, since the two transitions have different splitting factors and are differently offset from the inferred ‘demagnetized’ velocity.
It is only with full observations of high resolution that can spatially distinguish all individual features in every source that we will be able to thoroughly study the statistics of co-propagation (either precise co-propagation, or near co-propagation) and explore whether this can be used as a tool to ascertain the predominant combinations of temperature and density in the masing region.
7 Polarization patterns
We first ask, why are Zeeman triplets so rarely seen? This appears to be largely related to the long-known inequality seen between the amplitudes of components in Zeeman pairs, and quantified for a large sample of Zeeman pairs by Fish & Reid (2006). A commonly accepted explanation is the ‘Cook effect’ (Cook 1966), with magnetic field gradients and velocity gradients present which will favour the propagation at the emitted frequency of one of the Zeeman components, and attenuate at the other. This explanation will equally apply to Zeeman triplets, with one component favoured more than the other two. In some situations it can be the component that is favoured, and both components attenuated.
A second puzzle that relates to Zeeman triplets, and to components more generally, is that the components are generated as 100 per cent linear, yet most features discovered to exhibit high linear polarization have been found on closer inspection to also have significant circular polarization (net elliptical). Consequently, it has been common to discard these candidates as potential components, leading to the extreme conclusion that components are completely absent. An explanation suggested by Fish & Reid (2006) is that components usually acquire some circular polarization during subsequent passage through weak spots of circularly polarized components of other Zeeman patterns. Then, with a weaker constraint on the purity of linear polarization for candidates, we retain many more candidates, and are no longer forced to the unlikely conclusion that components are completely absent. The puzzle may be solved, but an unfortunate implication is that the difficulty of distinguishing components from components has been aggravated.
The Fish & Reid (2006) explanation can also contribute to the absence of another flavour of Zeeman triplet - ‘triple treats’ - where a central linearly polarized feature is expected to be bracketed by a pair of predominantly linearly polarized features of half its intensity, and polarized orthogonally to the central feature, if the maser arises in a large magnetic field close to the plane of the sky. The ‘Fish & Reid’ effect suggests to us that even where all three components of a ‘triple treat’ are present (perhaps with relative intensities modified by the ‘Cook effect’), it is unlikely that all of them will retain their full original linear polarization, unscathed by passage through unrelated masing regions of different polarization.
We now turn to a further puzzle. Many of the Zeeman pair components display some linear polarization, which will naturally occur whenever the magnetic field is not precisely in the line of sight to the observer and, in that case, a weak component midway between the pair is expected. Various arguments have been made that the component may not be recognisable as a linearly polarized feature if it has acquired some circular polarization during propagation. But that does not account for the usual total absence of any feature at the frequency midway between the components. The observational puzzle is most starkly evident in the study of W3(OH) with the VLBA (Wright et al. 2004a, 2004b) where candidate components are absent from all but two of the 83 Zeeman pairs recognised at 1665 MHz, and even these two were rejected when investigated in more detail. Indeed, Wright et al. (2004a) find no linear polarization greater than 15 per cent in any 1665-MHz feature stronger than 0.35 Jy. A likely explanation for W3(OH) is that its magnetic field is very uniform in direction, and closely aligned with the line of sight, by chance. The other source with very little linear polarization at VLBA resolution, W51 (Fish & Reid 2006) may be accounted for similarly. The rarity of triplets appears to extend to other sources, but there are relatively few sources where the statistics are adequate to confirm that this remains a serious puzzle.
Encouraged by the greatly increased number of Zeeman components that are now recognized from the present study, we now ask whether there remains a puzzle in which there are fewer components than expected. We first recall the importance of investigating a large sample of sources. There are certainly some sources where components appear to be absent, such as W3(OH) at Galactic coordinates 133.947+1.064 (Wright et al. 2004b), and W51e1 and e2, at Galactic coordinates 49.488-0.388 and 49.491-0.387 (Fish & Reid 2006). As we suggested earlier, these are likely to be sites where the predominant field direction is almost along the line of sight. We note that Fish & Reid (2006) prefer to attribute sites with low linear polarization to stronger internal Faraday rotation, but our suggestion that it is due to the gross orientation of magnetic field within the site can more simply account for it. There are also some sources where linear polarization is especially prevalent e.g. 81.871-0.781 (Fish & Reid 2006), and these are likely to be sites where the predominant field direction is almost in the plane of the sky.
Our presentation of 43 new candidate components (including three in Zeeman triplets) has hugely increased their number, compared to previous assessments of a near absence. However, the total number remains small compared to the number of sources searched, and does not exclude the possibility that components are discriminated against. Of course, we would expect the number that we identified from their approximate co-propagation at 1665 and 1667 MHz to be only a small fraction of the underlying number of components that are likely to be present at only one transition; but distinguishing these from components (which can also have quite high linear polarization) is difficult, except in a small number of cases where linear polarization greatly exceeds circular polarization. Extending high spatial resolution VLBI studies to many more sources will clarify this. The resulting improved statistics will then indicate whether there is a true depletion of components relative to expectations.
Past indications of a near absence of components appeared to be accounted for by the ‘magnetic beaming’ effect (Gray and Field 1994, 1995). Although it need no longer be invoked for the near total absence of components, the ‘magnetic beaming’ effect may, none the less, be needed to account for their possible depleted rate of occurrence.
With the large body of full polarization data now accumulating for the ground-state main-line transitions, and the prospect of similar data for excited-state transitions (especially at 6035 and 6030 MHz), there may be scope for also distinguishing some propagation-related influences on the linear polarization of components, by comparing the statistics for transitions at greatly different frequencies, where effects such as Faraday rotation are grossly different.
8 Conclusion
Characterising the full polarization spectra of the complete sample of known OH masers has had the special value of revealing rare phenomena (including Zeeman components and blue-shifted outflows) that were absent or not recognised in smaller samples.
We have identified three new Zeeman triplets. We have also used the apparent co-propagation at 1665 and 1667 MHz of features with high linear polarization to identify a further 40 features as Zeeman components. Not only is this the first large sample of components, but it is also the largest sample of features exhibiting near co-propagation at two transitions in the OH ground-state. They lend support to a tentative earlier finding that the 1667-MHz intensity is comparable to the 1665-MHz intensity in such conditions, whereas elsewhere it is, on average, only one-quarter the intensity.
In Paper I, we singled out rare sources with wide velocity spread, and noted two distinct varieties. Here we have continued this investigation using the larger sample, and have focused on ten sites that may be the result of collimated outflows. These are similar to those from water masers, with indications of a preponderance of blue shifts. Future VLBI measurements are needed to validate these suggestions, but extensive MAGMO results currently in progress using the ATCA may allow preliminary corroboration. Further follow-up will include searching for similar kinematics in possibly accompanying methanol and water masers, and testing for continuum emission.
Combining the variability statistics from the 104 sources in Paper I and the 157 sources of the present paper, we find that between 2004 and 2005, only nine show variations of more than a factor of two in their strongest feature. On a longer timescale, for sources where comparisons were possible with earlier data over several decades, dramatic changes, mostly strong ‘flares’, were recognised amongst 18 sources, and quite high stability was evident at only a handful of sites (10). Further investigation of variability will be possible from the MAGMO project combined with the present survey. This will allow better selection of candidates that merit more intensive monitoring, and enhance prospects for identifying periodic variable sites, where there is unique potential for probing the history and more fully investigating the physical properties.
Acknowledgments
We thank Warwick Wilson for implementing the correlator enhancements, John Reynolds and Parkes Observatory staff for enabling the non-standard observing procedures, and Malte Marquarding for providing within the ATNF spectral analysis package (asap), the spectropolarimetric reduction features developed for the present data.
References
- [1] Argon A.L., Reid M.J., Menten K.M., 2000, ApJ.Suppl., 129, 159
- [2] Bains I., Caswell J.L., Richards A¿M¿S¿, Phillips C., Tingay S., Kramer B.H., Cohen R.J., Cunningham M., 2007, in Chapman J.M., & Baan W.A., eds, Proc. IAU Symp. 242, Astrophysical Masers and their Environments, Cambridge Univ. Press, p. 64
- [3] Bourke T.L., Myers P.C., Robinson G., Hyland A.R., 2001, ApJ, 554, 916
- [4] Breen S.L., Ellingsen S.P., Caswell J.L., Lewis B.E., 2010a, MNRAS, 401, 2219
- [5] Breen S.L., Caswell J.L., Ellingsen S.P., Phillips C.J., 2010b, MNRAS, 406, 1487
- [6] Brooks K.J., Garay G., Voronkov M., Rodriguez L.F., 2007, ApJ, 669, 459
- [7] Caswell J.L., 1996, MNRAS, 279, 79
- [8] Caswell J.L., 1997, MNRAS, 289, 203
- [9] Caswell J.L., 1998, MNRAS, 297, 215
- [10] Caswell J.L., 1999, MNRAS, 308, 683
- [11] Caswell J.L., 2001, MNRAS, 326, 805
- [12] Caswell J.L., 2003, MNRAS, 341, 551
- [13] Caswell J.L., 2004a, MNRAS, 349, 99
- [14] Caswell J.L., 2004b, MNRAS, 352, 101
- [15] Caswell J.L., 2004c, MNRAS, 351, 279
- [16] Caswell J.L., 2007, in Chapman J.M., & Baan W.A., eds, Proc. IAU Symp. 242, Astrophysical Masers and their Environments, Cambridge Univ. Press, p. 194
- [17] Caswell J.L., 2009, Publ.Astron.Soc.Australia, 26, 454
- [18] Caswell J.L., Haynes R.F., 1983, Aust.J.Phys., 36, 361
- [19] Caswell J.L., Haynes R.F., 1987a, Aust.J.Phys., 40, 215
- [20] Caswell J.L., Haynes R.F., 1987b, A&A., 171, 261
- [21] Caswell J.L., Vaile R.A., 1995, MNRAS, 273, 328
- [22] Caswell J.L., Reynolds, J.E., 2001, MNRAS, 325, 1346
- [23] Caswell J.L., Phillips C.J., 2008, MNRAS, 386, 1521
- [24] Caswell J.L., Breen S.L., 2010, MNRAS, 407, 2599
- [25] Caswell J.L., Green J.A., 2011, MNRAS, 411, 2059
- [26] Caswell J.L., Murray J.D., Roger R.S., Cole D.J., Cooke D.J., 1975, A&A., 45, 239
- [27] Caswell J.L., Haynes R.F., Goss W.M., 1980, Aust.J.Phys., 33, 639
- [28] Caswell J.L., Vaile R.A., Ellingsen S.P., Whiteoak J.B., Norris R.P., 1995a, MNRAS, 272, 96
- [29] Caswell J.L., Vaile R.A., Forster J.R., 1995b, MNRAS, 277, 210
- [30] Caswell J.L., Kramer B.H., Reynolds J.E., 2009, MNRAS, 398, 528
- [31] Caswell J.L., Kramer B.H., Sukom A., Reynolds J.E., 2010a, MNRAS, 402, 2649
- [32] Caswell J.L. et al. 2010b, MNRAS, 404, 1029
- [33] Caswell J.L., Breen S.L., Ellingsen S.P., 2011a, MNRAS, 410, 1283
- [34] Caswell J.L., Kramer B.H., Reynolds J.E., 2011b, MNRAS, 414, 1914
- [35] Caswell J.L. et al. 2011c, MNRAS, 417, 1964
- [36] Caswell J.L., Green J.A., Phillips C.J., 2013, MNRAS, 431, 1180
- [37] Cook A.H., 1966, Nature, 211, 503
- [38] Dickey J.M., et al., 2013, PASA, 30, 3
- [39] Fish V., Reid M.J., Argon A.L., Zheng X., 2005, ApJ.Suppl., 160, 220
- [40] Fish V., Reid M.J., 2006, ApJ.Suppl., 164, 99
- [41] Gray M.D., Field D., 1994, A&A., 292, 693
- [42] Gray M.D., Field D., 1995, A&A., 298, 243
- [43] Green J.A., McClure-Griffiths N.M., 2011, MNRAS, 417, 2500 392, 783
- [44] Green J.A., Caswell J.L., Voronkov M.A., McClure-Griffiths N.M., 2012a, MNRAS, 425, 1504
- [45] Green J.A., McClure-Griffiths N.M., Caswell J.L., Robishaw T., Harvey-Smith L., 2012b, MNRAS, 425, 2530
- [46] Green J.A. et al., 2012c, MNRAS, 420, 3108
- [47] Guzman A.E., Garay G., Brooks K.J., 2010, ApJ, 725. 734
- [48] Guzman A.E., Garay G., Brooks K.J., Voronkov M.A., 2012, ApJ, 753, 51
- [49] Hutawarakorn B., Cohen R.J., 1999, MNRAS, 303, 845
- [50] Hutawarakorn B., Cohen R.J., Brebner G.C., 2002, MNRAS, 330, 349
- [51] Knowles S.H., Caswell J.L., Goss,W.M., 1976, MNRAS, 175, 537
- [52] MacLeod G.C., Scalise E., Saedt S., Galt J.A., Gaylard M.J., 1998, AJ, 116, 1897
- [53] Motogi K. et al., 2011, MNRAS, 417, 238
- [54] Motogi K., Sorai K., Niinuma K., Sugiyama K., Honma M., Fujisawa K., 2013, MNRAS, 428, 349
- [55] Szymczak M., Gerard E., 2009, A&A, 494, 117
- [56] te Lintel Hekkert P., Chapman J .M., 1996, A&AS, 119, 449
- [57] Wright M.M., Gray M.D., Diamond P.J., 2004a, MNRAS, 350, 1253
- [58] Wright M.M., Gray M.D., Diamond P.J., 2004b, MNRAS, 350, 1272