1 \acmNumber1 \acmArticle01 \acmYear2014 \acmMonth10
On the Dynamics of Social Media Popularity: A YouTube Case Study
Abstract
Understanding the factors that impact the popularity dynamics of social media can drive the design of effective information services, besides providing valuable insights to content generators and online advertisers. Taking YouTube as case study, we analyze how video popularity evolves since upload, extracting popularity trends that characterize groups of videos. We also analyze the referrers that lead users to videos, correlating them, features of the video and early popularity measures with the popularity trend and total observed popularity the video will experience. Our findings provide fundamental knowledge about popularity dynamics and its implications for services such as advertising and search.
category:
H.1.2 User/Machine Systems Human Factorskeywords:
youtube, social media, characterization, referrers, popularity growthFlavio Figueiredo, Jussara M. Almeida, Marcos André Gonçalves, Fabricio Benevenuto, 2014. On the Dynamics of Social Media Popularity: A YouTube Case Study
This research is partially funded by the Brazilian National Institute of Science and Technology for Web Research (MCT/CNPq/INCT Web Grant Number 573871/2008-6), and by the authors’ individual grants from Google, CNPq, CAPES and Fapemig. We also thank Caetano Traina, Renato Assunção, Virgilio Almeida, Elizeu Santos-Neto, Matei Ripeanu, and the anonymous reviewers for discussions on drafts of this work.
1 Introduction
User generated content (UGC) has emerged as the predominant form of online information sharing nowadays. The unprecedented amount of information being produced is one of the driving forces behind the success of the social media phenomenon [Kaplan and Haenlein (2010), Cormode and Krishnamurthy (2008)]. This phenomenon is a shift from the traditional media where, instead of content being produced mostly by a few selected individuals, anyone, in theory, can produce and share content online. However, the “information overload” that accompanies the huge amount of social media being produced has its drawbacks. For example, it is ever-so-difficult to find and filter relevant content to oneself. Nevertheless, some pieces of content (or objects) succeed in attracting the attention of millions of users, while most remain obscure. This leads to the heavy tailed characteristic of content popularity [Sinha and Pan (2007), Clauset et al. (2009)], where a few objects become very popular while most of them attract only a handful of views. What makes one particular object become hugely popular while the majority receive very little attention? Which factors affect how the popularity of an object will evolve over time? These are major questions in the social media context that drive our present work.
A plethora of different factors may impact social media popularity, including the object’s content itself, the social context in which it is inserted (e.g., characteristics of the object’s creator and her social neighborhood or influence zone), mechanisms used to access the content (e.g., searching, recommendation), and specific characteristics of the application that may promote the visibility of some objects over the others. Some of these factors contribute to the rich-gets-richer phenomenon [Easley and Kleinberg (2010)], which can partially explain the heavy-tailed nature of content popularity. Others, such as links to the object from a popular blog and events in the real world, are external to the application and still may impact the object’s future popularity.
Given the importance of social media on society nowadays, understanding the extent to which these factors impact the popularity of social media and how popularity evolves over time provides valuable insights for content generators, online advertisers and Internet service providers (ISPs), amongst others [Conover et al. (2013), Moat et al. (2013), Preis et al. (2013), Mestyán et al. (2013), Vakali et al. (2012)]. In this work, we aim at investigating how different factors impact popularity dynamics of social media, focusing on YouTube as case study. YouTube is currently the most popular video sharing application, with over 100 hours of video shared per minute111http://www.youtube.com/yt/press/statistics.html, and a total estimated number of shared videos that had surpassed 4 billion in early 2012222http://www.reuters.com/article/2012/01/23/us-google-youtube-idUSTRE80M0TS20120123. It is a rich application that embeds several mechanisms, such as search, list of related videos, and top lists, that may affect how a video is disseminated, thus impacting its popularity.
Thus, we here aim at performing a deep study of the evolution of popularity of user generated videos on YouTube. Towards our goal, we collected a public set of statistics available in the system that provides for each video: (a) its popularity as a function of time, and (b) a set of referrers, i.e., links used by users to access the video, along with the number of views for which each referrer is responsible. Given the great diversity of content on YouTube,
our characterization is done on three different datasets, namely, popular videos that appear on the world-wide top lists maintained by YouTube; videos that were removed from the system due to copyright violation; and, a dataset of videos sampled according to a random procedure (i.e., random queries).
Focusing on number of views as popularity metric, our study addresses five questions:
Q1 - How early do videos reach the majority of observed views? we intend to assess how fast a video achieves most of its observed popularity. This is key to determine the time period during which different information services can benefit more from a video. For example, ad placement services will be more effective if ads are posted on videos before most of their views are consumed. Moreover, search engines may misleadingly use observed popularity to favor some videos in their rankings, even when videos are no longer attractive.
Our results show that some videos, such as top and copyright protected videos, achieve most of their views very early on, whereas videos selected from random queries tend to take longer to attract most of its observed views.
Q2 - Is popularity concentrated in bursts?
We want to know whether video popularity is concentrated on a few days or weeks. This question complements Q1, offering valuable insights into how quickly the interest in the video raises and vanishes. Moreover, knowing the peak potential of a video (based on the most popular day/week) is valuable for services like advertisement campaigns. We find that top and copyright protected videos tend to experience popularity bursts, with a large fraction of their total observed views concentrated on single week or a even single day, whereas the popularity of videos selected from random queries tends to be less concentrated.
Q3 - Are there governing trends that characterize common groups of video popularity evolution? We here aim at bridging Q1 and Q2 by extracting the popularity trends of common groups of videos. To that end, we make use of a time series clustering algorithm [Yang and Leskovec (2011)] to infer the popularity trends. Focusing on videos from top lists and selected from random queries, we find that the same four types of popularity trends are observed in both datasets. One trend consists of videos that tend to remain attractive over time with an always increasing popularity. The other trends account for videos that tend to peak in popularity for a short while, with three different popularity decay characteristics after the peak.
Q4 - Which incoming links (or referrers) are more important for video popularity, and how early do they occur? The previous questions focus on understanding popularity based only on the popularity time series. Here, we want to know how users reach these videos. There are multiple forms through which users can reach a particular piece of content and, thus, there are multiple driving forces that may impact the popularity of a video. Identifying such forces is crucial for designing more cost-effective content dissemination strategies. For instance, should a content creator invest time on perfecting the keywords describing their videos (for better search rankings) or focus on campaigning videos in online social networks? Our results show that internal YouTube mechanisms, such as search engines and related videos, are the most important mechanisms that drive users to content, implying that YouTube itself handles a great power to drive video popularity through its internal mechanisms.
Q5 - What are the associations between features related to the video, to its early popularity measures and referrers with the popularity trend (or total observed popularity) of the video? We aim at measuring the associations between features related to the video (e.g., category, upload date, age), early points in the popularity time series and referrers with the identified popularity trends (Q3) and popularity measures. We show that videos that follow the same trend tend to also have similar content (based on video category) and referrers. For example, music videos tend to remain popular over time and are generally found through search engines, while videos related to news tend to have a small but significant attention period and are found through more diverse sources (e.g., external websites and viral propagation). Moreover, different features are more correlated with popularity trends and measures at different moments of the video’s lifespan, motivating the use of some of them to build popularity prediction models.
This work is a follow up on our previous study of the popularity dynamics of YouTube videos [Figueiredo et al. (2011)], which tackled only the first four questions. We here extend it by introducing Q5, completely revisiting how Q3 is addressed, and extending our analyses related to Q1, Q2 and Q4 to provide thoughtful discussions about the practical implications of our findings for various services as well as content producers.
The rest of this paper is organized as follows. The next section presents a discussion on related work, while Section 3 discusses our data collection methodology. Section 4 presents our characterization of YouTube popularity curves (Q1 and Q2), while Section 5 shows the different popularity trends of YouTube videos (Q3). Next, Section 6 characterizes the relative importance of different referrers (Q4), whereas Section 7 discusses the correlations between various features and popularity (Q5). Finally, Section 8 concludes the paper discussing the implications of our results.
2 Related Work
In this section, we start by discussing studies of user generated content (UGC) popularity that focused mainly on static views of popularity (Section 2.1). We then discuss previous efforts to analyze the temporal evolution of UGC popularity (Section 2.2).
2.1 Static Views of Popularity of UGC
In one of the first studies of YouTube video popularity, Cha et al. [Cha et al. (2009)] analyzed popularity distribution, popularity evolution and content characteristics of YouTube and of a popular Korean video sharing service, investigating mechanisms to improve video distribution, such as caching and Peer-to-Peer (P2P) content distribution networks (CDNs). Chatzopoulou et al. [Chatzopoulou et al. (2009)] analyzed the correlations between the popularity of YouTube videos, measured in number of views, and other metrics such as numbers of comments and favorites, finding moderate to strong correlations for older videos and weaker correlations for younger ones, which implies that their long term popularity dynamics was still unstable.
More recently, Wattenhofer et al. [Wattenhofer et al. (2012)] analyzed the correlations between the popularity of YouTube videos and properties of various online social networks (OSN) created among users of the system. In particular, they found that characteristics of the OSN built from links between YouTube users who comment each others’ videos are more correlated to the popularity of a user’s video than to the characteristics of the subscription graph (though such correlation is strong). This result implies that active community collaboration may have a high impact on the views a user receives through her videos. Similarly, Susarla et al. [Susarla et al. (2011)] also showed that subscriber links play an important role on the early popularity of videos. Borghol et al. [Borghol et al. (2012)] analyzed the correlations between popularity of YouTube videos and content factors, determined by groups of duplicate videos (or clones). Specifically, the authors correlated observed popularity with current popularity and clone groups, using a linear regression model, and showed that the introduction of new binary explanatory variables capturing the clone groups improved the regression quality, which implies that popularity is related to content. Similarly, Lakkaraju et al. [Lakkaraju et al. (2013)] showed that the time of day when a Reddit post is added and its title may have a significant impact on its popularity.
Flickr images were also the target of many studies of UGC popularity. For example, Zwol [van Zwol (2007)] characterized the distributions of total popularity and popularity decay over time of images as heavy-tailed. Other studies focused on folksonomies and tags [Golder and Hubberman (2006), Lerman and Jones (2006), Marlow et al. (2006)], which are also examples of UGC. Marlow et al. [Marlow et al. (2006)] found heavy-tailed distributions of tag popularity, where the popularity of a tag was estimated by number of images it annotates and number of users who used the tag in their libraries. This result has also been observed when tags are used to annotate other kinds of media, such as videos or text data [Figueiredo et al. (2012)]. More recently, Khosla et al. [Khosla et al. (2014)] compared the use of image and social features for predicting the final popularity values of images. Their results are complementary to our results on Q5. However, the authors do not characterize the long-term popularity trends, as we do.
In common, these studies provide important insights into content popularity in various UGC applications. However, most of them focused on either a static snapshot or at most a few snapshots. Thus, they did not analyze the long-term popularity growth.
2.2 Popularity Evolution of UGC
The popularity evolution of online content has been the target of more recent studies. Focusing on YouTube videos, Borghol et al. showed how weekly based views can be used to model video popularity, and designed a model to determine the number of videos that may exceed some popularity thresholds [Borghol et al. (2011)]. This work was recently revisited by Islam et al. [Islam et al. (2013)], who showed that the weekly based modeling of popularity is still valid even years after video upload, but the synthetic model proposed for predicting the distribution of popularity of a group of videos is not. Zhou et al. [Zhou et al. (2011)] showed the importance of links to related videos to video popularity. The importance of referrers and content features was also briefly discussed in [Borghol et al. (2012)], although the authors were more focused on understanding the impact of cloned content on popularity. We complement these prior efforts by providing a more comprehensive study of popularity trends and their correlations with various features of the video, its referrers and early popularity measures.
Broxton et al. [Broxton et al. (2011)] analyzed patterns of viral videos, defined as videos that receive a large fraction of views from OSN applications. The authors developed a method to rank different sources of traffic to videos according to their potential in attracting more views. Brodersen et al. [Brodersen et al. (2012)] made use of the same model to show that most viral videos, after an initial burst in propagation over a diverse set of geographical regions, tend to fall back to their region of upload. Previous work also focused on geographical propagation of Twitter data [Kamath et al. (2013), Ferrara et al. (2013)]. Among other things, authors find that some cities are trend-setters (sources of popular memes), while others are trend-consumers (sinks).
Cha et al. [Cha et al. (2012)] analyzed the propagation of pictures through Flickr’s internal social network, finding that the popularity of the most popular pictures, measured in number of favorite marks, exhibits close to linear growth. They also discussed the importance of social links to popularity, showing that about 50% of favorite marks come from social cascades. In a different direction, Ratkiewicz et al. [Ratkiewicz et al. (2010)] analyzed how external events, captured by Google Trends and local browsing (i.e., university traffic), affect the popularity of Wikipedia articles.
There have also been efforts to uncover common popularity temporal patterns or trends. Crane and Sornette proposed epidemic models to explain a burst in video popularity in terms of endogenous user interactions and external events [Crane and Sornette (2008)], whereas Yang and Leskovec [Yang and Leskovec (2011)] proposed a time series clustering algorithm to identify popularity trends. A unifying analytical framework of the trends extracted by those studies was proposed in [Matsubara et al. (2012)]. We here employ the algorithm proposed in [Yang and Leskovec (2011)] to identify popularity trends in our datasets. Although some of the trends we identify in our datasets are very similar to those reported in [Yang and Leskovec (2011), Crane and Sornette (2008), Figueiredo et al. (2011), Lehmann et al. (2012)], one of them, which corresponds to videos that remain popular over time, has not been detected by any previous study.
Although the aforementioned efforts provide some insights into the evolution of content popularity, there is still little knowledge about which UGC features (e.g., video, referrer, and popularity features) and system mechanisms (e.g., search) contribute the most to popularity growth. Thus, our analyses, performed separately for videos with different characteristics, greatly build on prior efforts, shedding more light into the complex task of understanding UGC popularity. This paper complements the studies of Borghol et al. [Borghol et al. (2012), Borghol et al. (2011)], who also studied the popularity dynamics of YouTube videos, but did not characterize different popularity trends nor how various features correlate with these trends, as we do. Similarly, our results complement prior efforts focused on geographical views of popularity [Brodersen et al. (2012), Ferrara et al. (2013), Kamath et al. (2013)], and on extracting important referrers [Broxton et al. (2011)]. Many recent studies target the design of popularity prediction models [Ahmed et al. (2013), Pinto et al. (2013), Radinsky et al. (2013), Li et al. (2013), Weng et al. (2013), Jiang et al. (2014)], but they mostly exploit only popularity time series and/or OSN propagation. One exception is the work of Jiang et al. [Jiang et al. (2014)], which exploits content and social features to predict the day a video is going to peak. However, the authors do not provide a detailed analysis of the importance of each feature to popularity, as we do. Our results indicate that the aforementioned models could benefit from using various features as input.
3 Data Collection
As our case study, we analyze the following datasets, which are publicly available333http://vod.dcc.ufmg.br/traces/youtime/:
Top: 27,212 videos from top lists maintained by YouTube (e.g., most viewed videos, most commented videos).
YouTomb: 120,862 videos with copyright protected content, identified by the the MIT YouTomb project444http://youtomb.mit.edu/. This is the first effort to characterize copyright protected videos.
Random topics: 24,482 videos collected as result of random queries submitted to YouTube’s search API. To build such queries, we first randomly selected, according to a uniform distribution, an entity from the Yago semantic database [Kasneci et al. (2009)]. Yago entities cover topics such as popular movies (e.g., Blade Runner) to common items (e.g., Chair). The (textual) name of the entity was then submitted as a query to the YouTube’s search API, and we selected the most relevant video in the result list. We queried for 30,000 entities and discarded queries with empty results555We do not claim our dataset is a random sample of YouTube videos. Nevertheless, for the sake of simplicity, we use the term Random videos to refer to videos from this dataset..
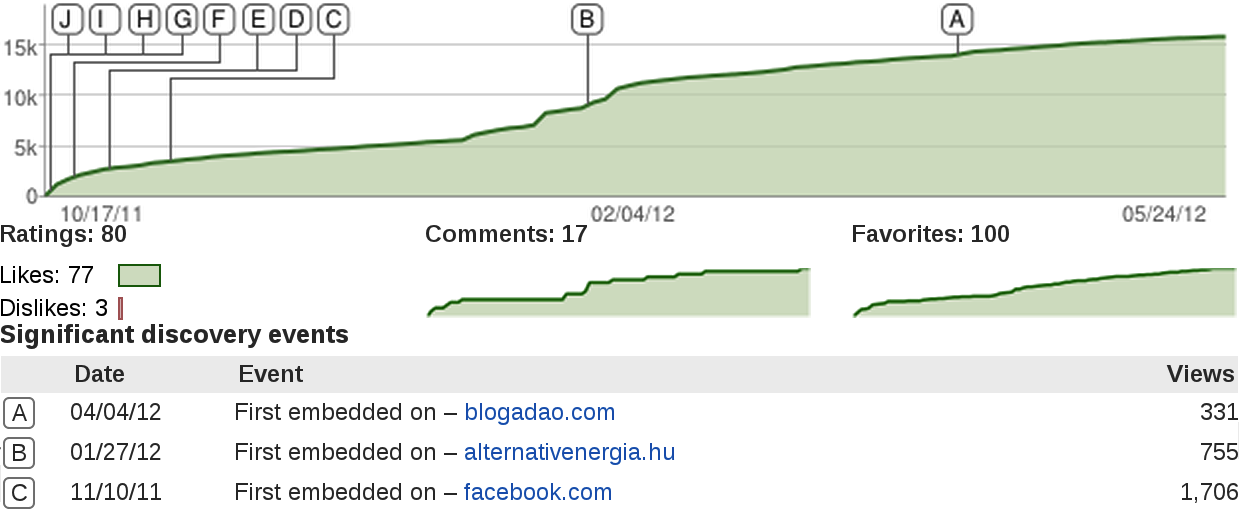
For each video, we collected YouTube’s insight data associated with it, which is publicly available on the video’s home page. This insight data consists of various features of the video, including three time series of how the numbers of views, comments and favorite markings of the video evolved over time, since the video was uploaded. It also includes a set of referrers that led users to the video. The time series are daily for videos with less than 100 days of age, while 100 evenly distributed points are provided for videos with more than 100 days of age [Figueiredo et al. (2011)]. Other features, such as the video category and upload date, were also scrapped from the HTML page of each video. In Figure 1 we show an example of YouTube’s insight data that was available up to 2013 (before a change in YouTube’s user interface). Currently, the referrer (discovery events) information, comments and favorites time series are no longer provided.
We processed our collected datasets to remove: (1) videos with missing or inconsistent information; and (2) videos uploaded on the same day of our crawling. Table LABEL:tab:crawl provides a summary of each cleaned dataset, presenting the total number of videos, average number of views per video, and average video age666Changes in our HTML parser lead to datasets of slightly different sizes than our previous study.. Video age, measured in number of days, is defined as the difference between the crawling date (or the removal date, for videos in the YouTomb dataset) and the upload date. We note that YouTomb videos are on average older than videos in the Top and Random datasets. Moreover, Top videos are, as expected, more popular, on average, than YouTomb videos, which, in turn, tend to attract more views than videos in the Random dataset (on average).
We also note that video ages vary significantly, as shown in Table 3. Most videos in the YouTomb and Random datasets are over 1 year old, or have ages between 1 month and 1 year. In contrast, videos in the Top dataset tend to have a bi-modal age range, with most being a few days old or over 1 year. Given such variability, we analyze popularity evolution separately for videos in each age range. However, to avoid hurting presentation with too many graphs, we focus on results computed over all videos in each dataset, pointing out significant differences across age ranges when appropriate.
| Video Datasets | Top | YouTomb | Random |
|---|---|---|---|
| # of Videos | 18,422 | 102,888 | 21,935 |
| Avg. # of of views | 1,064,264 | 273,696 | 131,473 |
| Avg. video age (days) | 170 | 750 | 526 |
| Top | YouTomb | Random | |
|---|---|---|---|
| age (days) 7 | 4,303 | 0 | 109 |
| 7 age (days) 30 | 6,543 | 0 | 563 |
| 30 age (days) 365 | 4,627 | 13,379 | 8,159 |
| age (days) 365 | 2,949 | 89,509 | 13,104 |
| Class | Feature Name | Type |
| Video | Video category | Categorical |
| Upload date | Numerical | |
| Video age | Numerical | |
| Time window size () | Numerical | |
| Referrer | Referrer first date | Numerical |
| Referrer # of views | Numerical | |
| Popularity | # of views | Numerical |
| # of comments | Numerical | |
| # of favorites | Numerical | |
| change rate of views | Numerical | |
| change rate of comments | Numerical | |
| change rate of favorites | Numerical | |
| Peak fraction | Numerical |
The features we collected, shown in Table LABEL:tab:feats, are grouped into three classes, namely video, referrer, and popularity features. Video features include category, upload date, age, and the duration of the time window that represents a single observation in the video’s popularity time series (see below). The video category is defined based on the YouTube’s list of categories, which includes Autos/Vehicles, Comedy, Education, Entertainment, Gaming, Film/Animation, Howto/Style, Music, News/Politics, Shows, Nonprofit/Activism, People/Blogs, Pets/Animals, Travel/Events, Science/Technology, and Sports. The referrer features include the first date and the number of views associated with each referrer category. Referrers are categorized into External, Featured, Search, Internal, Mobile, Social and Viral. The External category represents websites (often other OSNs and blogs) that have links to the video. The Featured category contains referrers that come from advertises about the video in other YouTube pages or featured videos on top lists and on the front page. The Search category includes referrers from search engines, which comprise only Google services. Internal referrers correspond to other YouTube mechanisms, such as the “Related Video” feature. Mobile includes all accesses that come from mobile devices. Social referrers consist of accesses from the page of the video owner or from users who subscribed to the owner or to some specific topic. Finally, some other referrers are grouped into Viral. The popularity features include the total numbers of views, comments and times the video was marked as favorite, the trend in these measures captured by the corresponding average change rates, and the largest fraction of all observed views that happened in a single time window (peak fraction). Jointly, these features capture properties of the popularity curve.
We note some limitations of the data provided by YouTube. Each popularity curve is registered with at most 100 points, regardless of the video age. Thus, the video’s time window is defined as the video age divided by 100. In order to be able to estimate video popularity on a daily basis, we performed linear interpolation between the 100 points provided. Moreover, YouTube does not provide information on every referrer that led users to the videos, but rather on ten important ones (according to YouTube). In total, the available referrers account for only 36%, 25% and 35% of all the views of videos in the Top, YouTomb, and Random datasets, respectively.
4 Understanding Video Popularity Growth
We start by analyzing the popularity growth patterns of videos in our three datasets, focusing on two aspects: (1) the time interval until a video reaches most of its observed popularity, and (2) the bursts of popularity experienced by a video in short periods of times (e.g., days or weeks). We use the number of views as popularity metric because previous studies have found large correlations between total number of comments (or favorites) and total view count [Chatzopoulou et al. (2009)]. Moreover, we have also found positive correlations, ranging from 0.18 to 0.24, for both pairs of metrics, taken at each point in time (instead of only for the final snapshot, as previously done).
4.1 How early do videos reach most of its observed views (Q1)?
Figure 2 shows the cumulative distributions of the amount of time it takes for a video to receive at least 10%, at least 50% and at least 90% of their total (observed) views, measured at the time our data was collected. Time is shown normalized by the age of the video, which is here referred to as the video’s lifespan. That is, the y-axis shows the fraction of videos that achieved at least 10%, 50%, and 90% of their total views (considering the total views at the time we crawled the data) in a period of time that does not exceed the value shown in the x-axis (which is normalized by the total time since the video was uploaded).
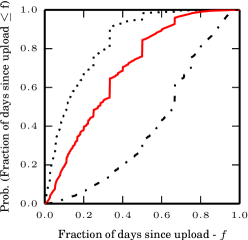
We note that, for half of the videos (y-axis) in the Top, YouTomb and Random datasets, it takes at most 67%, 17% and 87%, respectively, of their total lifespans (x-axis) until they receive at least 90% of their total views. If we consider at least 50% of their total views, the fractions are 27%, 4% and 44%, respectively, following a similar trend (as also found for the mark of 10% of the views). Conversely, around 34% of Top videos take at least 20% of their lifespans to reach at least 10% of their observed popularity. Similarly, 19% of videos in the Random dataset experience a similar dormant period before starting to receive most views. In contrast, only 8% of the YouTomb videos take 20% or more of their lifespans to reach at least 10% of their observed popularity.
Thus, comparing the results across datasets, YouTomb videos tend to get most of their views earlier in their lifespans, followed by videos in Top and Random datasets. As videos in the top lists tend to be more popular, the difference between the results for Top and Random datasets are somewhat predictable. Possible reasons as to why YouTomb videos tend to receive most of their views even earlier are: (1) as many of these videos consist of popular TV shows and music trailers, a natural interest in this content closer to when it is uploaded is expected, and (2) being aware that such videos contain copyright protected content, users may seek them quicker after upload, before the violation is detected and they are removed from YouTube.
We note that since lifespan is a normalized metric, these results may be impacted by the distributions of video ages (Table 3). In particular, recall that such distribution is skewed towards older videos in the YouTomb dataset: around 86% of them have at least 1 year of age. This bias may influence the results. However, we also note that 59% of the videos in the Random dataset also fall into the same age range. Yet, in comparison with YouTomb, videos in the Random dataset get most of their views later.
Thus, to reduce any bias caused by age differences, we repeat our analyses separately for videos in each age range. Table LABEL:tab:early_ages shows results for the time until a video achieves at least 90% of its views, presenting averages and standard deviations for each age range and dataset. Similar results occur for videos in most age ranges: YouTomb videos reach at least 90% of their views much earlier in their lifespans than Top videos, which are followed by videos in the Random dataset. The only exception occurs for the youngest videos, for which there is no much difference across the datasets.
4.2 Is popularity concentrated in bursts (Q2)?
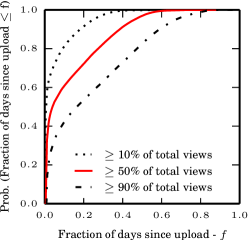
We now investigate the popularity bursts experienced by the videos. We first analyze the distributions of the fraction of views a video receives on its most popular (i.e., peak) day, shown in Figure 3 and summarized in Table LABEL:tab:peak for videos falling in different age ranges. Figure 3 also shows distributions for the second and third most popular days. Each curve in a graph of Figure 3 shows the fraction of videos (y-axis) that receive at most % (shown in x-axis, as a fraction) of its total views on the given peak day.
| Top | YouTomb | Random | ||||
|---|---|---|---|---|---|---|
| age (days) 7 | .64 | .10 | - | - | .60 | .16 |
| 7 age 30 | .56 | .19 | - | - | .66 | .21 |
| 30 age 365 | .50 | .27 | .10 | .13 | .80 | .17 |
| age 365 | .77 | .23 | .26 | .23 | .85 | .12 |
| Top | YouTomb | Random | ||||
|---|---|---|---|---|---|---|
| age (days) 7 | 64% | .16 | - | - | 63% | .20 |
| 7 age 30 | 35% | .15 | - | - | 33% | .19 |
| 30 age 365 | 23% | .16 | 21% | .13 | 8% | .11 |
| age 365 | 2% | .03 | 20% | .03 | 1% | .02 |
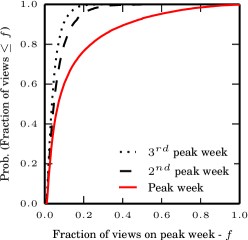
Figure 3-a) shows that Top videos experience a very distinct peak day: 50% of them receive between 31% and 100% of their views on a single (peak) day. In comparison, the same fraction of videos receive between 17% and 50% of their views on the second peak day, and between 8% and 34% of their views on their third peak day. Thus, Top videos clearly experience a burst of popularity on a single day. This is in sharp contrast with videos in the YouTomb and Random datasets (Figures 3-b and 3c), where the three curves are very close to each other and skewed towards smaller fractions of views. While these results might reflect diverse popularity patterns, with more videos in the Random and YouTomb datasets having multiple (smaller) daily peaks, we note that the interpolation performed over the collected data might introduce distortions in this analysis, particularly given the large fraction of older videos in those two datasets.
To cope with these possible distortions, we also analyze the distributions of the fraction of views on the first, second and third peak weeks. Figures 3(d-f) show that videos in all datasets tend to exhibit some burst of popularity on a single week. However, the general trend remains the same as for daily peaks: the peak week tends to be more significant for Top videos, followed by videos in the YouTomb and Random datasets.
The same general conclusions, for both weekly and daily popularity peaks, also hold for videos falling in different age ranges, as illustrated in Table LABEL:tab:peak for daily peaks.
4.3 Discussion
In this section we characterized content popularity growth, focusing on our first two research questions (Q1 and Q2). In general, we note that results vary according to the analyzed dataset. While Top and YouTomb videos tend to be more concentrated and receive most views earlier in their lifespans, videos in the Random dataset exhibit less clear bursts, particularly at the daily granularity, and tend to take longer to receive most views. These results contrast and complement previous analyses of YouTube videos, where the authors characterized a sample of videos uploaded on a single day, concluding that they exhibit concentrated popularity growth patterns [Borghol et al. (2011)]. By analyzing different datasets, composed of videos with different characteristics, our study is able to reveal different aspects of YouTube as a whole.
These results might be useful for a wide range of social media services. For example, they raise the question of whether (and when) it is beneficial to incorporate popularity estimates into search engine rankings. For videos that receive most of its views in short time periods (such as videos in the Top and YouTomb datasets), adding this information into the ranking after the period of interest has already passed might hide other (possibly more relevant) videos (e.g., newly uploaded videos). Another interesting argument is for advertisement services. The notion that popular content may have a higher ad-visibility has been discussed only recently [Carrascosa et al. (2013)]. However, focusing on the final observed popularity may be misleading, since posting ads on popular videos does not necessarily promotes a higher amount of future audience.
5 Popularity Temporal Dynamics (Q3)
We now characterize the temporal dynamics of popularity of YouTube videos, aiming at identifying governing popularity trends that characterize groups of videos in our datasets. To that end, we employ the KSC algorithm [Yang and Leskovec (2011)], which is a K-Means like clustering algorithm focused on extracting similar trends (or shapes) from time series. KSC is based on a distance metric that captures the similarity between two time series with scale and time shifting invariants.
KSC requires all time series to have equal length. Thus, we focus on videos with more than 100 days, whose popularity time series is defined by 100 evenly distributed observations, that is, the original crawled data with no interpolation777The popularity curves of those videos capture longer term popularity dynamics and trends.. Each such observation represents the popularity of the video at a time window , whose duration depends on the video age. We also focus on the Top and Random datasets, since the non-interpolated data from the YouTomb dataset has all zeros after the removal date, which leads to time series with various lengths that cannot be handled by KSC. After such filtering, we are left with 4,527 and 19,562 videos in the Top and Random datasets, respectively. These are the videos analyzed in this section (and in Section 7).
Like K-means, the KSC algorithm requires the target number of clusters to be given as input. We use the heuristic [Menascé and Almeida (2002)] to define the best value of . The is defined as the ratio of the coefficient of variation (CV) of the intracluster distances and the coefficient of variation of the intercluster distances. The smallest value of after which the remains roughly stable should be selected, as a stable implies that new splits affect only marginally the variations of intra and intercluster distances. The values of seem to stabilize for =, for both analyzed datasets. We confirmed this choice by plotting the clustering cost, silhouette and Hartigan’s index metrics [Yang and Leskovec (2011)], and by visually inspecting the members of each cluster. The best value of was 4 according to all these techniques.
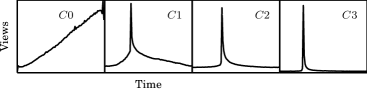
Figure 4 shows the discovered popularity trends (the centroids of the identified clusters), which govern popularity evolution in our datasets. Each graph shows the number of views as function of time. Note that the same four popularity trends are present in both analyzed datasets. Moreover, Table 6 presents, for each cluster, the number of videos that belong to it as well as the average number of views, the average change rate in the number of views, and the fraction of views at the peak time window of these videos. The average change rate is the average difference between two (non-cumulative) measures taken in successive time windows. Thus, it captures the trend in the number of views of the video: a positive (negative) change rate indicates an increase (decrease) with time, whereas a change rate equal to 0 indicates stability. Table 6 shows the average change rate computed over the total duration of the video’s lifespan. The peak fraction, also shown in Table 6, is the ratio of the maximum number of views in a time window divided by the total number of views of the video.
| Top | Random | |||||||
| Number of Videos | 958 | 1,370 | 1,084 | 1,115 | 4,023 | 6,718 | 5,031 | 3,790 |
| Avg. Number of Views | 711,868 | 6,133,348 | 1,440,469 | 1,279,506 | 305,130 | 108,844 | 64,274 | 127,768 |
| Avg. Change Rate | 1112 | 395 | 51 | 67 | 47 | 7 | 4 | 4 |
| Avg. Peak Fraction | 0.03 | 0.04 | 0.19 | 0.74 | 0.03 | 0.03 | 0.08 | 0.28 |
As shown in Figure 4, cluster 0 consists of videos that remain popular over time, attracting an increasing number of views per time window as time passes, as indicated by the large positive change rates (Table 6). This behavior is specially strong in the Top dataset, with an average change rate of 1,112 views per window, which corresponds to roughly a week in that dataset. The videos in cluster 0 have also no significant peaks, as the average fractions of views in the peak windows are very small (Table 6). The other three clusters are predominantly defined by a single peak in popularity followed by a steady decline. The main difference is the rate of decline, which is much slower in Cluster 1, somewhat faster in Cluster 2, and very sharp in Cluster 3. This difference is more clear if we analyze the peak fractions and the average change rates in Table 6.
Given the popularity (i.e., scale) invariant nature of the KSC algorithm, it is important to highlight the differences between the clusters in the Top and Random datasets. To that end, we make use of the numbers in Table 6. Although very similar clusters exist in both datasets (determined both by the shape of the centroids and the fraction of videos in each cluster), notice that the change rates in popularity for the videos in the Top dataset are much higher (for every cluster) than the corresponding rates in the Random dataset. For example, videos in Cluster 0 (which remain popular over time) in the Top dataset experience a change in number of views in consecutive time windows of 1,112 views, on average. In contrast, videos in the Random dataset experience a change of only 47 views, on average.
Also notice how the peak fractions in the Top dataset are higher than those in the Random dataset (in all clusters but Cluster 0). However, the average number of views in Cluster 0 in the Top dataset is the smallest one when compared to the other clusters in the same dataset. For the Random dataset, this is the opposite. This is very interesting, as it indicates that the most popular videos in the Top dataset are in Clusters 1-3, that is, they experience clear popularity peaks, being more popular in shorter time windows. However, given the very high change rates experienced by videos in Cluster 0 (in Top), we might speculate that videos in this cluster will become more popular over time, as they capture enough interest to remain receiving visitors over time. We might also speculate that, as time passes and the Top videos in Clusters 1-3 loose their appeal to the audience, the relative distribution of popularity across clusters in the Top dataset will be more similar to that in the Random dataset. This is a conjecture that requires further investigation in the future.
It is also important to note that Clusters 1, 2 and 3 were previously uncovered in other YouTube or Twitter datasets [Crane and Sornette (2008), Lehmann et al. (2012), Matsubara et al. (2012)]. Crane and Sornette [Crane and Sornette (2008)] explained their occurrences by a combination of endogenous user interactions and external factors. According to them, Cluster 1 consists of videos that experience word-of-mouth popularity growth resulting from epidemic-like propagation through the social network; Cluster 2 includes videos that experience a sudden popularity burst, due to some external event, but continue spreading through the social network afterwards; and Cluster 3 consists of videos that experience a popularity burst for some reason (e.g., spam) but do not spread through the social network. However, these previous studies relied mostly on peak popularity analyses [Lehmann et al. (2012)] and fitting power-law decays after the peak [Matsubara et al. (2012), Crane and Sornette (2008)]. Instead, we here use an unsupervised learning algorithm that makes our task of discovering popularity trends more general and robust. For example, the thresholds in peak volume that define different trends in these previous studies are not clearly defined. In contrast, such peaks emerge clearly in our clusters (as shown in Table 6).
Notice however that no previous study that analyzed video popularity time series or other UGC time series has identified a trend similar to Cluster 0, possibly because of the models they adopted, which focus on power-law like behavior [Crane and Sornette (2008), Matsubara et al. (2012)] or due to inherent differences in media consumption trends for different media types [Yang and Leskovec (2011)]. The existence of Cluster 0 can be attributed to three possible reasons. Firstly, there are certain topics that users will continue to revisit over time [Anderson et al. (2014), Wang and Huberman (2012)], and thus the content will not follow a rise-and-fall pattern (as proposed in [Matsubara et al. (2012)]). Secondly, the propagation of these topics is much slower [Wang and Huberman (2012)], being the pattern we see still part of the growth period in interest in that particular topic. Lastly, YouTube’s own growth in popularity over time may cause the audience of interest in some videos to increase. Intuitively, a combination of these factors will likely be the case, and only recently researchers have started looking into the implications of each of them [Anderson et al. (2014), Wang and Huberman (2012)].
Finally, we note that other time series clustering techniques could also be employed to extract popularity trends from our datasets. For example, one could consider first using Symbolic Aggregate Approximation, SAX [Lin et al. (2007)] to represent the time series, and then applying traditional clustering methods (e.g., K-Means). However, SAX assumes that time series values are normally distributed, which is not true for our data (even after log and z-transformations). We argue that KSC is a suitable choice of clustering algorithm to our study because it: (1) requires only the number of clusters as input, (2) requires no data pre-processing, and (3) has well defined and interpretable centroids, which facilitates analyzing and drawing useful insights from the results.
This section bridges our study on Q1 and Q2, and thus have similar implications for social media services. So far we characterized video popularity focusing on popularity time series only. We have yet to discuss possible reasons behind content popularity and popularity trends. We explore these issues in the next two sections. Throughout the rest of the paper, we refer to Clusters 0, 1, 2 and 3 as , , , and , respectively.
6 Referrer Analysis (Q4)
The dynamics of information propagation through friends in social networks has been studied before [Cha et al. (2012)]. However, on YouTube, as on other social media applications, word-of-mouth is not the only mechanism through which information is disseminated. We here tackle this issue by investigating important referrers that lead users to videos (Section 6.1) and their first access since video upload (Section 6.2). These analyses are performed on our three original datasets (Table LABEL:tab:crawl).
6.1 Which referrers are more important for video popularity (Q4a)?
| Top | YouTomb | Random | ||||||||
| Category | Referrer Type | |||||||||
| EXTERNAL | First embedded view | 0.57 | 0.11 | 0.35 | 0.81 | 0.16 | 0.41 | 0.07 | 0.08 | 0.22 |
| First embedded on | ||||||||||
| First referrer from | ||||||||||
| FEATURED | First view from ad | 0.72 | 0.14 | 0.03 | 0.10 | 0.02 | 0.00 | 0.11 | 0.14 | 0.00 |
| First featured video view | ||||||||||
| INTERNAL | First referrer from YouTube | 1.50 | 0.29 | 0.67 | 1.85 | 0.36 | 0.65 | 0.14 | 0.18 | 0.34 |
| First referrer from Related Video | ||||||||||
| MOBILE | First view from a mobile device | 0.26 | 0.05 | 0.51 | 0.02 | 0.00 | 0.02 | 0.03 | 0.03 | 0.05 |
| SEARCH | First referrer from Google | 1.05 | 0.20 | 0.36 | 1.80 | 0.35 | 0.52 | 0.29 | 0.37 | 0.41 |
| First referrer from YT search | ||||||||||
| First referrer from Google Video | ||||||||||
| SOCIAL | First referrer from a subscriber | 0.36 | 0.07 | 0.35 | 0.01 | 0.00 | 0.01 | 0.01 | 0.00 | 0.12 |
| First view on a channel page | ||||||||||
| VIRAL | Other / Viral | 0.81 | 0.16 | 0.79 | 0.59 | 0.12 | 0.62 | 0.16 | 0.20 | 0.55 |
Recall that the referrers in our datasets were grouped into seven categories: External, Featured, Search, Internal, Mobile, Social, and Viral. Table 7 shows the number () and fraction () of views for which each category is responsible. The table shows that search and internal YouTube mechanisms are key channels through which users reach content on the system, and we note that YouTube search is responsible for more than 99% of all Search referrers. Oliveira et al. [Oliveira et al. (2010)] posed the hypothesis that search is the main method for reaching content on video sharing websites, verifying it through questionnaires with volunteers. Whereas our results confirm their hypothesis for videos in the Random dataset, we find that YouTube internal features (e.g., “Related Videos”) play an even more important role to content dissemination for Top videos. For YouTomb videos, both categories are roughly equally important. In general, we find that search is more important to Random and YouTomb videos, as they are not systematically exposed to users as videos from top lists are. We also note the importance of the Viral category in all datasets, particularly Random.
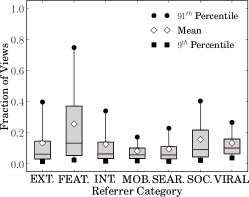
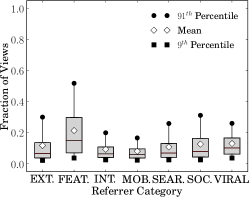
We further analyze the importance of each referrer category by computing the distributions of the number of views for which each category is responsible, taking only videos that received accesses from the given category, and computing percentages based on the total views from referrers only (accounted views). Figures 5(a-c) show box plots containing , and quartiles, and percentiles, and the mean, for each category and each dataset888For any given referrer category, at least 1,000 videos received views for which it is responsible.. Unlike Table 7, which shows aggregated results (i.e., results for all videos in each dataset), these plots allow us to assess the importance of each referrer category for individual videos.
For example, Table 7 shows that Social referrers do not appear to be important for YouTomb dataset as a whole. However, taking only copyright protected videos with at least one Social referrer, Figure 5-b) shows that, for 25% of such videos ( quartile), more than 22% of the accounted views come from subscription links. Thus, users do subscribe to other users who post copyright protected content. The Featured category is a similar case. For Top videos, the Social, Featured and Viral categories are responsible for more than 30%, 33% and 34%, respectively, of the accounted views for 25% of the videos with referrers from each such category (Figure 5-a). Finally, Featured referrers play a key role to attract views to Random videos: 25% of the videos with Featured referrers received at least 30% of the accounted views from such referrers (Figure 5-c).
It is hard to tell whether one referrer influences the number of views from other referrers. For example, a Top video may experience a popularity growth from Social and Viral referrers after being featured in the top list. Next, we study this issue by analyzing how early in a video’s lifespan each type of referrer is used.
6.2 How early do referrers appear (Q4b)?
We now analyze the referrers that first lead users to a video. Table 7 also shows the fractions of videos that had the first referrer falling into each category (). Since YouTube provides only the day each referrer was first used, there might be ties with multiple categories, and the sum of may exceed 100% for a dataset.
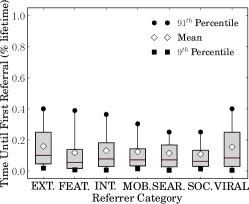
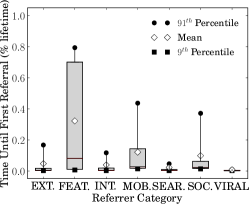
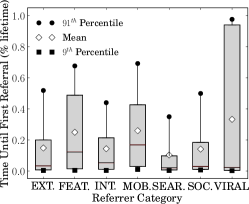
In general, viral spreading and internal YouTube mechanisms appear as primary forms through which users reach the content for the first time, in all three datasets. For example, the first referrers for 79%, 67%, and 51% of the Top videos are from the Viral, Internal, and Mobile categories, respectively. For the YouTomb dataset, Internal, Viral, and Search contain the first referrers for 65%, 62% and 52% of the videos, respectively. For the Random dataset, the first referrers of 55%, 41%, and 34% of the videos are from the Viral, Search, and Internal categories, respectively. Interestingly, mobile devices are also a relevant front door to Top videos, whereas for YouTomb and Random videos, the YouTube search engine accounts for a large fraction of the first referrers.
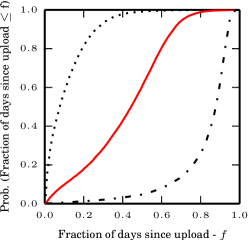
Figures 6(a-c) show the distributions of the difference between the time of the first referrer access and the time the video was uploaded, measured as a fraction of the video’s lifespan. For the Top and YouTomb datasets, referrers (of any category) tend to happen very early: for 75% of the Top and YouTomb videos, most referrer categories have their first appearances during the first quarter of the video’s lifespan. Indeed, only 9% of the Top videos have their first referrer access (of any category) after 40% of their lifespans. The exception is the Featured category on YouTomb: those referrers tend to take more time to appear. This suggests that YouTube may try to avoid featuring videos that are suspicious or have potential to be copyright protected. For Random videos, in general, Search, Internal, External, and Social referrers tend to appear earlier than other types of referrers. Thus, users are more likely to initially find such videos through social links, search, other YouTube mechanisms or external websites, instead of receiving them via e-mail or viewing them on mobile devices.
6.3 Discussion
We here focused on identifying the most important referrers that lead users to a video (Q4). Our results are useful to help content creators to increase their viewership. For instance, search engines seem to attract most viewers to content, and they do so early on the video’s lifespan (Table 7). However, focusing on particular videos, we find that this may not hold for every case (Figure 5). One suggestion to content creators would thus be to provide good textual descriptions of video content, which would likely help search engine users to find it. Afterwards, a careful monitoring of how the video propagates on external websites and internal OSNs may be used to further boost viewership.
7 Associations Between Various Features and Popularity (Q5)
We now tie the analyses of the previous sections together by assessing how different features are associated with the identified popularity trends, and also with total observed popularity values. We first analyze whether videos that follow a similar popularity trend tend to have content in the same topic and be reached through similar referrers (Section 7.1). We then measure the correlations between various features (shown in Table LABEL:tab:feats) and the popularity trend and observed popularity value of the videos (Section 7.2). As in Section 5, we here focus on the Top and Random datasets.
7.1 What kinds of content and referrers are responsible for each popularity trend? (Q5a)
We start by analyzing whether videos that follow a similar popularity trend (same cluster) tend to have content in the video category. For both datasets, we found that the distributions of the number of videos across categories in each cluster are statistically different from the distribution computed over all videos in the dataset, according to a Chi-Square test with p-value . Thus, videos in different clusters tend to be concentrated around different categories (or topics). In Figures 7(a-b) we show the fractions of videos in the top 4 categories in each cluster, for each dataset.
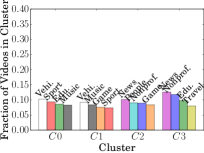
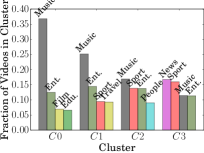
Starting with Top videos, Figure 7(a) shows a clear divergence in the topics of the videos in each cluster. Clusters and , which consist of videos that tend to attract viewers for longer periods, are composed mostly by videos about music, sports, and automobiles, while journalistic videos (news), video blogs (people) and videos related to activism (non-profit) are the most common topics in clusters and , which tend to have much shorter viewer retention periods. This mostly likely occurs because such videos tend to be interesting only during short time periods. For the Random dataset, Figure 7(b) shows that videos with music and entertainment content are very frequent in all four clusters. This may occur due to a natural bias of copyrighted content and of the queries used to build that dataset. Regardless, the frequencies of these categories tend to decrease, while news tends to become more frequent in clusters and .
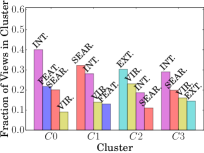
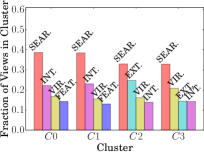
We now turn to the referrers used to reach videos in each cluster, and analyze the fractions of views each type of referrer is responsible for, on average999These fractions are computed based on the total number of views received through the referrers.. Once again, for both datasets, the distributions of these fractions in each cluster are statistically different from the distribution computed for all videos in the dataset. Thus, the types of referrers that attract the largest fractions of views do vary depending on the popularity trend. Figures 7(c-d) show the results for each dataset, focusing again on the top 4 referrers per cluster. Note that the only dataset where Search is the most important type of referrer for all trends is Random, due to the nature of its crawling process. However, Search, Internal and Viral referrers tend to be among the top 4 referrers in all clusters of both datasets. Moreover, Featured referrers are among the most important ones for videos that remain attractive for some time ( and ), while External referrers play an important role for videos that experience a sudden burst of popularity ( and ).
7.2 What are the correlations between features and popularity trends and values? (Q5b)
Finally, we measure the correlations between the features shown in Table LABEL:tab:feats and the popularity trends and the total popularity values of the videos (at the time of data crawling). To that end, we use the maximal information coefficient, or MIC [Reshef et al. (2011)]. MIC results range from 0, for no correlation, to +1, for strong (positive or negative) correlation. This novel metric captures the normalized mutual information measure between two features. It measures correlations between different types of features (e.g., categorical and numeric) and is able to detect non-linear and even periodic types of relationships, a limitation of other coefficients (e.g., Pearson and Spearman). We also used the Information Gain and the Gini coefficient [Cover and Thomas (2006)] to measure the correlations, obtaining qualitatively similar results.
Since the values of some referrer and popularity features vary with time, we compute MIC results for various monitoring periods. That is, we express the monitoring period as a fraction of the video’s lifespan, and compute feature values only for that period. For example, the correlation between number of views and popularity trends for a monitoring period of 10% is computed taking the number of views received during the first ten time windows, since each time series has 100 windows. By doing so, we can identify the most important features in different phases of the video’s lifespan.
Table 8 shows, for each dataset, MIC results between the features and popularity trends, for monitoring periods equal to 1%, 5%, 50% and 100%. As the number of features is large, we aggregate MIC results for each feature class - video, referrer, and popularity, and present mean () and maximum MIC for the features in each class. Similarly, Table 9 shows the MIC results between features and total (observed) popularity values. Since YouTube provides only the total number of views associated with each referrer, we only consider these features for a monitoring period equal to 100%, taking only the other referrer features (e.g., date of each referrer) for shorter periods.
| Monitoring Phase | |||||||||
|---|---|---|---|---|---|---|---|---|---|
| Dataset | Feature | 1% of Lifespan | 5% of Lifespan | 50% of Lifespan | 100% of Lifespan | ||||
| Top | Popularity Features | .15 | .19 | .15 | .27 | .18 | .63 | .26 | .84 |
| Referrer Features | .11 | .17 | .11 | .18 | .12 | .18 | .11 | .19 | |
| Video Features | .02 | .19 | .02 | .19 | .02 | .19 | .02 | .19 | |
| Random | Popularity Features | .04 | .07 | .05 | .17 | .13 | .52 | .20 | .75 |
| Referrer Features | .04 | .08 | .04 | .08 | .05 | .08 | .08 | .15 | |
| Video Features | .01 | .07 | .01 | .07 | .01 | .07 | .01 | .07 | |
| Monitoring Phase | |||||||||
|---|---|---|---|---|---|---|---|---|---|
| Dataset | Feature | 1% of Lifespan | 5% of Lifespan | 50% of Lifespan | 100% of Lifespan | ||||
| Top | Popularity Features | .31 | .48 | .32 | .56 | .41 | .88 | .57 | 1 |
| Referrer Features | .16 | .27 | .17 | .28 | .20 | .31 | .32 | .74 | |
| Video Features | .11 | .31 | .11 | .31 | .11 | .31 | .11 | .31 | |
| Random | Popularity Features | .16 | .32 | .22 | .48 | .36 | .89 | .51 | 1 |
| Referrer Features | .09 | .11 | .10 | .13 | .12 | .18 | .26 | .68 | |
| Video Features | .08 | .18 | .08 | .18 | .08 | .18 | .08 | .18 | |
We start by noting that, as the monitoring period increases, popularity features tend to greatly surpass the others in importance for correlations with both trends and popularity values. For trends, the popularity feature with maximum MIC is peak fraction, whereas for popularity values, it is number of views. For both of them, the correlations are above 0.5 for monitoring periods beyond 50%, in both datasets. However, for shorter periods, the other (referrer and video) features are also very important. This is interesting for popularity prediction tasks [Ahmed et al. (2013), Pinto et al. (2013), Radinsky et al. (2013), Szabo and Huberman (2010)], since popularity features computed over short monitoring periods might be very unstable, and prediction must rely mostly on other pieces of information about the video, such as its category and referrers.
We further note that the relative average importance of each feature group is the same for both datasets: popularity features are more important than referrer features, which are more important than video features. The major differences between both datasets lie in the individual features within each feature class, as we discuss below.
We now focus on the correlations computed for popularity trends (Table 8). Albeit not shown in the table, for short monitoring periods (e.g., 1%), the most important video feature is the video age (MIC of 0.19 for Top and 0.07 for Random), while the number of views is the most important popularity feature (MIC of 0.19 for Top and 0.17 for Random). The most important referrer feature is the date of the first Internal referrer (MIC=0.17) for Top videos and the date of the first External referrer (MIC=0.08) for videos in the Random dataset. As time passes, the fraction of views on the peak window becomes the most important feature overall. This is expected, since popularity trends are either concentrated on peaks or exhibit linear growth (Section 5).
In contrast, when correlating with the total observed popularity values (Table 9), the most important feature is the number of views, for all monitoring periods. At very early points in time (1% of lifespan), the most important video and referrer features are video age (tied with upload date with MIC = 0.31) and the date of the first Viral referrer (MIC=0.26) for Top videos. For the Random dataset, they are video age (again, tied with upload date with MIC=0.18) and the date of the first Search referrer (MIC=0.1).
Thus, from the perspective of popularity prediction, having fixed the monitoring period, the most important features to be explored depend on whether one aims at predicting a trend or a value. For example, previous work showed that, by knowing the trend of a video before hand, the accuracy of the prediction of popularity values can be improved [Yang and Leskovec (2010), Pinto et al. (2013)]. However, we are not aware of any previous effort to predict the popularity trend of a video (or UGC in general). As our results indicate, the use of video and referrer features can help in this task.
We also note that, when correlating with both trends and observed popularity values with a monitoring period of 1%, the Music category is in the top 10 most correlated features for the Random dataset101010We represented each category by a binary feature, and computed correlations for each category separately.. The News category is also in the top 10 features when correlating with trends. This result is in agreement with Figures 7(a-b), which show a more skewed concentration of categories across trends in the Random dataset. Moreover, when correlating with both trends and observed popularity values with a monitoring period of 100%, some referrer features, mainly the number of views from the referrers, are in the top 10 most important features, in both datasets. We believe that such features would also be important at shorter monitoring periods. However, their values are not available in our dataset. Thus we cannot test this hypothesis.
7.3 Discussion
The correlations unveiled in this section motivate the need to explore a diverse set of features for popularity prediction tasks. Most previous efforts explored only early points in the popularity time series [Ahmed et al. (2013), Pinto et al. (2013), Radinsky et al. (2013), Szabo and Huberman (2010)]. Our results show that they could benefit from considering also other features. In particular, we found that while some referrer and video features may be useful to predict, at very early stages in the video’s lifespan, how its popularity will evolve over time (the trend), early popularity measures are the most useful features to predict future popularity values. However, as discussed by previous work [Yang and Leskovec (2010), Pinto et al. (2013)], one task may complement the other. Also, the differences in relative importance of individual features across datasets, particularly when considering early periods after video upload, raises a question of whether different prediction methods (i.e., methods that exploit different sets of features) should be designed for different groups of videos.
Other applications that may benefit from our results are recommender systems. By exploring important features that correlate with popularity, useful recommendations may be produced even before a video becomes popular. However, in this case a chicken-and-egg problem arises. Will a video become popular because it is interesting or due to the recommendation engine? Investigating causality between factors that impact content popularity is an important open question, which we leave for future work.
8 Conclusions and Future Work
We have characterized the dynamics of video popularity on the currently most popular video sharing system, YouTube. Driven by 5 research questions, we analyzed how the popularity of individual videos evolve since upload (Q1 and Q2), extracted common trends of popularity evolution (Q3), characterized the types of referrers that lead users to videos (Q4), and correlated popularity trends and final observed popularity values with various features (Q5). Our analyses were performed on three YouTube datasets, providing a broad view of the popularity evolution for a diverse set of videos.
We found that copyright protected (YouTomb) videos tend to get most of their views much earlier in their lifespans, followed by Top videos, and then videos in the Random dataset. We also found that Top videos tend to experience significant popularity bursts, receiving a large fraction of their views on a single day (or week). YouTomb videos also follow this pattern, and this is less of a case for Random videos. However, using a time series clustering algorithm, we found that the same 4 popularity trends seem to explain how video popularity evolves in both Top and Random datasets.
We also characterized the main referrers that led users to videos in each dataset. Particularly, we showed that search and internal YouTube mechanisms, such as lists of related videos, are key mechanisms that attract users to the videos. Whereas Search referrers account for the largest fraction of views to videos in the Random dataset, internal mechanisms play an even more important role to content dissemination for Top and YouTomb datasets. Also, our correlation results show that various video and referrer features can be explored for popularity prediction, and not only features extracted from early points of the popularity time series, as done by most previous efforts.
Our main findings can be applied in several contexts, as discussed next.
Content Distribution: we found that, even after short monitoring periods, there exists some correlations between popularity trends and the analyzed features, motivating their use for predicting popularity trends. Content distribution networks could use such predictions, together with observed popularity estimates, for load balancing, by provisioning videos predicted to remain popular for longer (i.e., videos in or ) to more capable servers. For videos predicted to be in or , as their popularity growth rates decrease there is a high chance that the attention for them will drop. Such videos should then be provisioned by less capable servers or sent to secondary storage. Similarly, this knowledge could be used by ISPs for local caching.
Online Advertising: our results also suggest that different video categories tend to more often follow different popularity trends (e.g., and are dominated by music and sports videos, while and by news and non-profit ones). This knowledge could be used by advertisers to drive the selection of the video categories for ad placement, and by online advertising platforms to provide category-based price differentiation for advertisers (e.g., higher prices for categories that tend to remain popular for longer). Our results are also potentially useful for content publishers, who may profit from ads placed on their videos. The finding that Search (and Featured) referrers attract more views for videos that remain attractive over time (i.e., videos in and ) suggests that content publishers could periodically refine the keywords assigned to their videos (e.g., tags,
title) to target different queries over time. For example, after a cycle of popularity growth and decay, publishers could adjust the video keywords and descriptions to possibly target other searchers that exploit related terms to find the video.
Monitoring Fame and Popularity: From a social perspective, understanding content popularity could be used for monitoring fame and popularity of content producers, and analyzing how users seek-out and consume information on real world events (e.g.,natural disasters, gossip news). As future work we aim at further investigating some of these issues, tackling questions such as: Is the consumption of content for different kinds of events largely different? What are the most important blogs or personalities that drive attention to different events? How does content diffusion in one service, say Twitter or Facebook, impact the popularity of videos on YouTube?
Finally, although focused on YouTube videos, our work could be extended to tackle other types of content. In particular, comparing how popularity evolves across different media types and the factors that are responsible for this evolution could be used by content producers and marketeers to choose the applications on which they should focus. Another interesting direction for future work is the study of user popularity (as opposed to content popularity). Recent findings [Weng et al. (2012), Wattenhofer et al. (2012), Susarla et al. (2011)] show that the amount of subscribers a user has plays a large role in the popularity of the content shared by her. We intend to extend our study to investigate the factors that impact user popularity on social media applications, as well as the inter dependencies that might exist between user and content popularity.
References
- [1]
- Ahmed et al. (2013) Mohamed Ahmed, Stella Spagna, Felipe Huici, and Saverio Niccolini. 2013. A Peek Into the Future: Predicting the Evolution of Popularity in User Generated Content. In Proc. WSDM.
- Anderson et al. (2014) Ashton Anderson, Ravi Kumar, Andrew Tomkins, and Sergei Vassilvitski. 2014. Dynamics of Repeat Consumption. In Proc. WWW.
- Borghol et al. (2012) Youmna Borghol, Sebastien Ardon, Niklas Carlsson, Derek Eager, and Anirban Mahanti. 2012. The Untold Story of the Clones: Content-agnostic Factors that Impact YouTube Video Popularity. In Proc. KDD.
- Borghol et al. (2011) Youmna Borghol, Siddharth Mitra, Sebastien Ardon, Niklas Carlsson, Derek Eager, and Anirban Mahanti. 2011. Characterizing and Modeling Popularity of User-Generated Videos. Performance Evaluation 68, 11 (2011), 1037–1055.
- Brodersen et al. (2012) Anders Brodersen, Salvatore Scellato, and Mirjam Wattenhofer. 2012. YouTube Around the World. In Proc. WWW.
- Broxton et al. (2011) Tom Broxton, Yannet Interian, Jon Vaver, and Mirjam Wattenhofer. 2011. Catching a Viral Video. Journal of Intelligent Information Systems (2011), 1–19.
- Carrascosa et al. (2013) Juan Miguel Carrascosa, Roberto González, Rubén Cuevas, and Arturo Azcorra. 2013. Are trending topics useful for marketing?. In Proc. COSN.
- Cha et al. (2012) Meeyoung Cha, Fabrício Benevenuto, Yong-Yeol Ahn, and Krishna Gummadi. 2012. Delayed information cascades in Flickr: Measurement, analysis, and modeling. Computer Networks 56, 3 (2012), 1066–1076.
- Cha et al. (2009) Meeyoung Cha, Haewoon Kwak, Pablo Rodriguez, Yong-Yeol Ahn, and Sue Moon. 2009. Analyzing the Video Popularity Characteristics of Large-Scale User Generated Content Systems. IEEE/ACM Transactions on Networking 17, 5 (2009), 1357–1370.
- Chatzopoulou et al. (2009) Gloria Chatzopoulou, Cheng Sheng, and Michalis Faloutsos. 2009. A First Step Towards Understanding Popularity in YouTube. In Proc. Infocom Workshops.
- Clauset et al. (2009) Aaron Clauset, Cosma Rohilla Shalizi, and M. E. J. Newman. 2009. Power-Law Distributions in Empirical Data. SIAM Rev. 51, 4 (2009), 661–703.
- Conover et al. (2013) Michael D Conover, Emilio Ferrara, Filippo Menczer, and Alessandro Flammini. 2013. The digital evolution of occupy wall street. PloS one 8, 5 (2013), e64679.
- Cormode and Krishnamurthy (2008) Graham Cormode and Balachander Krishnamurthy. 2008. Key Differences Between Web1.0 and Web2.0. First Monday 13, 6 (2008).
- Cover and Thomas (2006) Thomas M Cover and Joy A Thomas. 2006. Elements of Information Theory. Vol. 6. Wiley.
- Crane and Sornette (2008) Riley Crane and Didier Sornette. 2008. Robust Dynamic Classes Revealed by Measuring the Response Function of a Social System. Proceedings of the National Academy of Sciences 105, 41 (2008), 15649–53.
- Easley and Kleinberg (2010) David Easley and Jon Kleinberg. 2010. Networks, Crowds, and Markets: Reasoning About a Highly Connected World (1 ed.). Cambridge University Press.
- Ferrara et al. (2013) Emilio Ferrara, Onur Varol, Filippo Menczer, and Alessandro Flammini. 2013. Traveling trends: social butterflies or frequent fliers?. In Proc. COSN.
- Figueiredo et al. (2011) Flavio Figueiredo, Fabrício Benevenuto, and Jussara Almeida. 2011. The Tube Over Time: Characterizing Popularity Growth of YouTube Videos. In Proc. WSDM.
- Figueiredo et al. (2012) Flavio Figueiredo, Henrique Pinto, Fabiano Belém, Jussara Almeida, Marcos Gonçalves, David Fernandes, and Edleno Moura. 2012. Assessing the Quality of Textual Features in Social Media. Information Processing & Management (2012).
- Golder and Hubberman (2006) Scott A. Golder and Bernado Hubberman. 2006. Usage Patterns of Collaborative Tagging Systems. Journal of Information Science 32, 2 (2006), 198–208.
- Islam et al. (2013) M. Aminul Islam, Derek Eager, Niklas Carlsson, and Anirban Mahanti. 2013. Revisiting Popularity Characterization and Modeling of User-generated Videos. In Proc. Mascots.
- Jiang et al. (2014) Lu Jiang, Yajie Miao, Yi Yang, Zhenzhong Lan, and Alexander G. Hauptmann. 2014. Viral Video Style: A Closer Look at Viral Videos on YouTube. In Proc. ICMR.
- Kamath et al. (2013) Krishna Y. Kamath, James Caverlee, Kyumin Lee, and Zhiyuan Cheng. 2013. Spatio-temporal dynamics of online memes: a study of geo-tagged tweets. In Proc WWW.
- Kaplan and Haenlein (2010) Andreas M. Kaplan and Michael Haenlein. 2010. Users of the World, Unite! The Challenges and Opportunities of Social Media. Business Horizons 53, 1 (2010), 59–68.
- Kasneci et al. (2009) Gjergji Kasneci, Maya Ramanath, Fabian Suchanek, and Gerhard Weikum. 2009. The YAGO-NAGA approach to knowledge discovery. ACM SIGMOD Record 37, 4 (2009), 41.
- Khosla et al. (2014) Aditya Khosla, Atish Das Sarma, and Raffay Hamid. 2014. What Makes an Image Popular. In Proc. WWW.
- Lakkaraju et al. (2013) Himabindu Lakkaraju, Julian McAuley, and Jure Leskovec. 2013. What’s in a Name? Understanding the Interplay between Titles, Content, and Communities in Social Media. In Proc. ICWSM.
- Lehmann et al. (2012) Janette Lehmann, Bruno Gonçalves, José J. Ramasco, and Ciro Cattuto. 2012. Dynamical classes of collective attention in twitter. In Proc. WWW.
- Lerman and Jones (2006) Kristina Lerman and Laurie Jones. 2006. Social Browsing on Flickr. In Proc. ICWSM.
- Li et al. (2013) Haitao Li, Xiaoqiang Ma, Feng Wang, Jiangchuan Liu, and Ke Xu. 2013. On popularity prediction of videos shared in online social networks. In Proc. CIKM.
- Lin et al. (2007) Jessica Lin, Eamonn Keogh, Li Wei, and Stefano Lonardi. 2007. Experiencing SAX: A Novel Symbolic representation of Time Series. Data Mining and Knowledge Discovery 15 (2007), 107–144. Issue 2.
- Marlow et al. (2006) Cameron Marlow, Mor Naaman, Danah Boyd, and Marc Davis. 2006. HT06, tagging paper, taxonomy, Flickr, academic article, to read. In Prog. HT.
- Matsubara et al. (2012) Yasuko Matsubara, Yasushi Sakurai, B. Aditya Prakash, Lei Li, and Christos Faloutsos. 2012. Rise and Fall Patterns of Information Diffusion. In Proc. KDD.
- Menascé and Almeida (2002) Daniel Menascé and Virgilio Almeida. 2002. Capacity Planning for Web Services: Metrics, Models, and Methods. Prentice Hall.
- Mestyán et al. (2013) Márton Mestyán, Taha Yasseri, and János Kertész. 2013. Early prediction of movie box office success based on Wikipedia activity big data. PloS one 8, 8 (2013), e71226.
- Moat et al. (2013) Helen Susannah Moat, Chester Curme, Adam Avakian, Dror Kenett, Eugene Stanley, and Tobias Preis. 2013. Quantifying Wikipedia Usage Patterns Before Stock Market Moves. Scientific Reports 3 (2013).
- Oliveira et al. (2010) Rodrigo De Oliveira, Mauro Cherubini, and Nuria Oliver. 2010. Looking at Near-Duplicate Videos from a Human-Centric Perspective. ACM Transactions on Multimedia Computing, Communications, and Applications 6, 3 (2010), 1–22.
- Pinto et al. (2013) Henrique Pinto, Jussara Almeida, and Marcos Gonçalves. 2013. Using Early View Patterns to Predict the Popularity of YouTube Videos. In Proc. WSDM.
- Preis et al. (2013) Tobias Preis, Helen Susannah Moat, and H Eugene Stanley. 2013. Quantifying trading behavior in financial markets using Google Trends. Scientific reports 3 (2013), 1684.
- Radinsky et al. (2013) Kira Radinsky, Krysta Svore, Susan Dumais, Jaime Teevan, Alex Bocharov, and Eric Horvitz. 2013. Behavioral Dynamics on the Web: Learning, Modeling, and Prediction. ACM Transactions on Information Systems 32, 3 (2013), 1–37.
- Ratkiewicz et al. (2010) Jacob Ratkiewicz, Alessandro Flammini, and Fillipo Menczer. 2010. Traffic in social media I: paths through information networks. In Proc. SIN.
- Reshef et al. (2011) David Reshef, Yakir Reshef, Hilary K. Finucane, Sharon R. Grossman, Gilean McVean, Peter J. Turnbaugh, Eric S. Lander, Michael Mitzenmacher, and Pardis C. Sabeti. 2011. Detecting Novel Associations in Large Data Sets. Science 334, 6062 (2011), 1518–1524.
- Sinha and Pan (2007) Sitabhra Sinha and Raj Kumar Pan. 2007. How a ”Hit” is Born: The Emergence of Popularity from the Dynamics of Collective Choice. In Econophysics and Sociophysics: Trends and Perspectives. Wiley, Online.
- Susarla et al. (2011) Anjana Susarla, Jeong-Ha Oh, and Yong Tan. 2011. Social Networks and the Diffusion of User-Generated Content: Evidence from YouTube. Information Systems Research 23, 1 (2011), 1–19.
- Szabo and Huberman (2010) Gabor Szabo and Bernardo Huberman. 2010. Predicting the Popularity of Online Content. Commun. ACM 53, 8 (2010), 80–88.
- Vakali et al. (2012) Athena Vakali, Maria Giatsoglou, and Stefanos Antaris. 2012. Social networking trends and dynamics detection via a cloud-based framework design. In Proc. WWW.
- van Zwol (2007) Roelof van Zwol. 2007. Flickr: Who is Looking?. In Proc. WI. IEEE.
- Wang and Huberman (2012) Chunyan Wang and Bernardo Huberman. 2012. Long trend dynamics in social media. EPJ Data Science 1, 2 (2012).
- Wattenhofer et al. (2012) Mirjam Wattenhofer, Roger Wattenhofer, and Zack Zhu. 2012. The YouTube social network. In Proc. ICWSM.
- Weng et al. (2012) Lillian Weng, Alessandro Flammini, Alessandro Vespignani, and Fillipo Menczer. 2012. Competition among memes in a world with limited attention. Scientific reports 2 (2012), 335.
- Weng et al. (2013) Lilian Weng, Filippo Menczer, and Yong-Yeol Ahn. 2013. Virality prediction and community structure in social networks. Scientific reports 3 (2013), 2522.
- Yang and Leskovec (2010) Jaewon Yang and Jure Leskovec. 2010. Modeling Information Diffusion in Implicit Networks. In Proc. ICDM.
- Yang and Leskovec (2011) Jaewon Yang and Jure Leskovec. 2011. Patterns of temporal variation in online media. In Proc. WSDM.
- Zhou et al. (2011) Renjie Zhou, Samamon Khemmarat, and Lixin Gao. 2011. The impact of YouTube Recommendation System on Video Views. In Proc. IMC.
–