Geometry-induced fluctuations of olfactory searches in bounded domains
Abstract
In olfactory search an immobile target emits chemical molecules at constant rate. The molecules are transported by the medium which is assumed to be turbulent. Considering a searcher able to detect such chemical signals and whose motion follows the infotaxis strategy, we study the statistics of the first-passage time to the target when the searcher moves on a finite two-dimensional lattice of different geometries. Far from the target, where the concentration of chemicals is low the direction of the searcher’s first movement is determined by the geometry of the domain and the topology of the lattice, inducing strong fluctuations on the average search time with respect to the initial position of the searcher. The domain is partitioned in well defined regions characterized by the direction of the first movement. If the search starts over the interface between two different regions, large fluctuations in the search time are observed.
pacs:
02.50.-r, 05.40.-a, 87.19.ltI Introduction
Optimal olfactory searches are essential for the survival of insects and animals in search for food and mating. These searches are based on the capacity of these organisms to detect the chemical signals emitted by the target, usually at distances that are further away to be visually located. In recent years several olfactory search strategies have been proposed to model the way in which such organisms are capable of finding their targets Russell ; osh1 ; Revelli ; ralfb ; ol1a ; gel ; Vergassola . To accomplish a successful search the strategy has to be reliable to reach the target most of the times, robust against errors and efficient in the sense of exhibiting reasonably short search times. From a mathematical point of view, an optimal strategy is one that minimizes the search time, failure probability or any appropriate cost function.
The complexity of an olfactory search is in general a consequence of the complexity of the transport of the chemical signals through the environment. It is natural to expect that organisms using optimal strategies will have a survival advantage with respect to other competitors that do not. However, biological success in one environment will be unsuccessful in others as the optimal search will depend on the environment and on how limited the information about the properties of the transport is. At low Reynolds numbers, molecular diffusion dominates, and the concentration of the chemical signals used in the search are smooth and more importantly, static. In this regime, searches up-gradient in the concentration field such as chemotaxis, are successful. This completely exploitative strategy is used by bacteria in search for food supplies, phages to localize bacteria and euchariotic cell organisms in general. At larger Reynolds numbers the environment becomes turbulent, the concentration field breaks into complex filamentous structures and concentration decays rapidly with the distance from the source. In this regime, chemotaxis is ineffective since any local maxima, will attract the searcher, keeping it from ever reaching the global maxima that marks the position of the target.
In turbulent environments the searcher will need to deal with very limited dynamically evolving information to solve the task. Few years ago, Vergassola, et al, proposed a strategy for olfactory search called infotaxis Vergassola . They analyzed the search process from an information theory point of view, as an inverse problem in which the searcher needs to decode partial and noisy messages to find the position of the emitter. As the searcher moves, the information accumulated by the detections of the emitted chemicals is used to iteratively refine the instantaneous posterior distribution function for the probability to find the target at a given position , and to decide the further movements of the searcher as those that maximize the local gain of information. Infotaxis has shown to be successful and robust, leading to narrow distributions for the search time, even if the knowledge of the environment is not exact Vergassola ; Barbieri ; Masson .
In this paper we are concerned about the fluctuations of the search time for infotaxis. An optimal search minimizing the fluctuations is more reliable as then one would expect that any search trajectory would be completed in a time similar to the mean search time. We will show for infotaxis, that when the search process is defined on a bounded domain, the fluctuations of the search time strongly depend on the geometry of the domain and the topology of the lattice on which the searcher evolves. At the beginning of the search, when no detections have yet occurred, one would expect that the searcher dynamics correspond to a random explorer. However, here we show that the first movements of the searcher are not stochastic but fully determined by the geometry and the topology of the domain. leading to a complicated dependence of the search time on the initial searcher’s position. The domain is partitioned in terms of the initial searcher’s behaviour and we find that the fluctuations of the search time are largely enhanced when the search starts along the interface between partitions of different behaviour.
The paper is organized as follows: for completeness, in section II we briefly review the infotaxis search algorithm and our implementation. In section III the dependence of the search time on the initial position of the searcher is analyzed, showing that the domain is decomposed in regions according to the first deterministic step. Furthermore, in section IV we show that the boundary of these regions depends not only on the geometry of the domain but also on the topology of the lattice and the parameters of the transport process. The geometry-induced fluctuations are studied in section V in terms of the simultaneity of the first passage process. Our findings are summarized in section VI.
II Infotaxis search strategy
Infotaxis is a Bayesian olfactory search strategy in which the information released by the target source is transported through a turbulent environment Vergassola . An infotactic searcher initially explores the space collecting information, which is encoded in the trace of detections of molecules emitted by the source .
This information is used to reconstruct, at each time , the posterior probability distribution for the unknown position of the source . Both and are time-varying quantities that are constantly updated. The posterior probability distribution, referred to as the belief function, depends on the rate of detections i.e., the expected number of detections at position , given that the emitting source is located at . This function incorporates our modelling of the natural transport process, and it can be either postulated from rather general hypothesis, or else adapted dynamically as the searcher learns from the environment. As it is customary, in this paper we choose the first option, and assume that is the solution of an advection-diffusion partial differential equation Vergassola , which in two spatial dimensions takes the following explicit form:
| (1) |
where is the rate of emission of volatile particles, is their isotropic effective diffusivity, is the characteristic size of the detector, is the modified Bessel function of order 0, and the correlation length, given by
| (2) |
where the finite lifetime of the emitted molecules, and the mean current or wind (which blows, without loss of generality, in the negative -direction). The correlation length can be interpreted as the mean distance travelled by a volatile particle before it decays. In this paper we set the values of and to unity.
We stress that no perfect model of the environment is realistically available in concrete applications and that the rate function will only be an approximation to the actual transport process. However, the performance of the infotaxis strategy is still acceptable despite an incorrect modelling of the medium, which happens, for instance, if the parameters used by the searcher in its model of the environment differ from the real parameters of the transport process.
The simplest model for the time correlation of successive detections is to assume that they are independent. In a real turbulent transport process there are clearly spatio-temporal correlations between detections, as when a plume of odor particles hits the searcher, it is more likely that in a short time after it will have a higher chance of detection. However, ignoring this fact and assuming no correlations works surprisingly well for the Bayesian searcher to update its belief function of the source’s position Vergassola . Assuming independence of the detections, the stochastic process is Poissonian and therefore the probability distribution at time posterior to experiencing a trace is given by
| (3) |
where and is the total number of detections registered by the searcher at successive times . Assuming that the detections are uncorrelated, the evolution of the probability map can be written as a Markovian update
| (4) |
where is the number of detections during the short time interval and is a normalization constant with respect to . So far, this is a purely Bayesian approach to infer the position of the source from the trace of detections. What is characteristic of Infotaxis is the criterion for the searcher’s motion: rather than moving towards the most probable source position, at each time the searcher moves so that the expected information gain is maximized.
In what follows we assume that the searcher moves on a regular lattice with given topology. Suppose the searcher is at position at time with belief function . At time its new position can be any of the neighbouring lattice sites or (no motion). For each of the possible motions infotaxis estimates the Shannon entropy associated to the updated belief function and chooses from them the one for which the decrease in entropy is highest. The expected variation of entropy upon moving to is
| (5) |
where is the probability of having detections during the time , where is the mean number of detections at position .
Taking in (4) allows to estimate the updated belief function at each of the sites provided detections were made in the last time interval. The Shannon entropy of each of these probability densities is denoted by and appearing in (5) is the difference between the Shannon entropies of the estimated and the current .
The first term on the right hand side of (5) corresponds to the event of finding the source at the neighboring point. The second term takes into account the entropy decrease if the source is not found at . The function to maximize at each time step (5) therefore considers a balance between exploration and exploitation of the acquired information, as discussed in Vergassola . The algorithm evaluates (5) at each of the possible and chooses to move in the direction where is highest, i.e. where the largest expected decrease in entropy is obtained.
We have numerically solved the infotaxis algorithm described above for a searcher moving on a finite two-dimensional lattice with square, triangular and hexagonal topology. The lattice is bounded by a subset of lattice points that limit the region in which the search process takes place. When the searcher is at position it can move to any of the nearest neighbouring points to , unless , in which case the motion is allowed only over the subset of nearest neighbouring points that are contained in . We set the separation between lattice sites to one. Furthermore, we set the time between two movements of the searcher to .
At time , the searcher starts at . Initially the belief function is the uniform distribution over the domain , corresponding to a complete lack of knowledge about the position of the source and therefore of maximal entropy , with the total number of points contained in .
During the search process the searcher moves, registers detections, and updates its belief function according to the rules described above. As detections occur, the belief function starts to concentrate around the true position of the source. The search ends at the time at which the Shannon entropy reaches a value below a certain threshold, which we take to be . Note that this first hitting time criterion for the end of the search is different than the first passage criterion considered in Vergassola . For small values of the emission rate , the search time obtained from both criteria is different by at most one unit of time. However, at high values of the first passage time may diverge while our first hitting time criterion is still able to find the source. In such situations the search ends and the source is located even if the searcher has not physically reached the source. In the rest of the paper we study the statistics of the search time with respect to the geometry of the boundary and the topology of the lattice. In this paper we consider only low emission rates and set . Therefore, our present results are also valid for the search time corresponding to the first passage time.
III Dependence of the search time on the searcher’s initial position
In this section we study the dependence of the mean search time as a function of the initial position of the searcher. We consider an infotactic searcher in a square lattice of dimensions . The source is located at the center of the lattice and we consider first the case without advection ().
It is natural to expect that the search time increases monotonically with the initial distance of the searcher to the source Vergassola ; MassonPNAS . This is indeed the case in an infinite lattice. Here instead we first show in Fig. 1 that due to the finite size of the domain with reflecting boundaries, the search time exhibits a complex dependence with the initial distance to the source. Each point in Fig. 1 corresponds to the mean search time , averaged over trajectories starting at the same initial position .

From Fig. 1 one observes two separate regions: when the starting position is , the mean search time is and shows a small variation with the distance . Surprisingly, we find that when the searcher starts further away at , the mean search time drops down to . Furthermore, near the transition distance , the fluctuations of are larger.
The key observation comes from realizing that, in the absence of detections, the first step of an infotactic searcher is not random but deterministic. With an initial uniform belief function the searcher moves in the direction in which the expected gain of information is maximal and, in the absence of information about the source location, the initial direction depends only on the parameters of the transport process and the geometry of the domain, but not on the position of source.
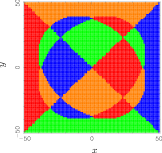

At dilute conditions, i.e. far away from the source, it is clear that the initial step will persist at longer times, until the searcher starts detecting the molecules emitted by the source. As a consequence, the direction of the first step will determine the region the searcher explores first and thus, will have a considerable effect on the value of . To understand the consequences of the first step we show in Fig. 2 (left panel), a color code map for the first step of infotaxis. The color of each lattice site represents the direction of the first step of the searcher when its initial position is at the same lattice site. It is noticeable that although standing still is always an option for the infotaxis algorithm, we find that this option is never optimal for the first step.
From Fig. 2 it is evident that the first step in Infotaxis is deterministic and the direction is strongly influenced by the geometry of the lattice boundary. The complex dependence of with the initial distance to the source of Fig. 1 can now be explained from the structure of the first-step decision map. At short distances the first step is upwards (away from the source). On the contrary, at larger distances the first step is downwards (towards the source). Depending on the direction of its first step, the searcher will explore different regions of the search domain. If the first step is away from the source, it is less probable for the searcher to have detections and it will keep moving until it reaches the vicinity of the boundary. This first exploration depends on the size and geometry of the domain and the time invested on it will be added to the total search time. Instead, when the searcher starts close to the boundary, it moves towards the center of the lattice, and since the source is placed there, the searcher will start detecting much sooner than in the previous case and the mean search time is smaller.
From the previous explanation, it is important to remark that the dependence on the initial distance shown in Fig. 1 will be different if the source is not located at the center, but the structure of the first-step decision map shown in Fig. 2 does not depend on the position of the source.
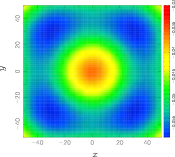
To understand the different regions in Fig. 2 we need to look at the expression for the expected entropy change. Since the initial belief map is the uniform distribution, only the sum inside the brackets in Eq. (5) changes for different choices of . This quantity depends on the position through the functions and . In the right panel of Fig. 2 we show for each lattice site, the maximal expected decrease of entropy as given by Eq. (5). There are four minima on each diagonal of the square domain which act as attractors for the infotaxis, and the the first step of the searcher is determined by them. The locus of points for which the maximal decrease in entropy occurs for two different directions define the smooth curves separating the different regions in the left panel of Fig. 2. The symmetry of the map reflects the symmetry of the boundary, and in this case of no advection () the isotropy of the transport process. Therefore, the first-step decision map is determined by the geometry of the domain via the way in which the expected maximal entropy decrease. This generates a well defined partition in the search domain into regions with a structure that inherit, in the absence of wind, the same symmetry as that of the boundary.
With the source located at the center of the lattice, in Fig. 3 we show, for each initial position in the lattice, the mean search time (left panel) and its standard deviation (right panel) as a color density plot. The regions near the midpoints of the edges on the boundary lead to the shortest search times. As discussed above, in the absence of detections, the initial first steps direct the searcher trajectory to the center of the lattice, and therefore, to the region in which a larger number of detections is expected. More interesting, it is clear from the right panel that the fluctuations of the search time are larger over the partition curves of the first-step decision map. The fluctuations will be discussed in greater detail in section V.
IV Dependence on the geometry and topology of the domain
In this section we complete the study of the effects that different boundary geometries, lattice topologies and the parameters of the transport process have on the structure of the first-step decision map, and consequently on the average search time.
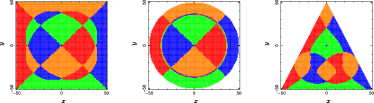
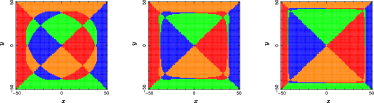
We start by computing the first-step decision map on a square lattice with square, circular and triangular boundary. The results are shown in Fig.4 for a correlation length . We see how the partition of the search domain is affected by the geometry and symmetry of the boundary. The conclusions drawn in the previous section apply to all geometries: in the absence of detections, the first step of an infotactic searcher is determined by the geometry of the boundary. The center of the lattice acts as a repeller, i.e. all searches starting at neighbouring points will have their first step away from the center. The boundary by construction is also repelling, but we see in Fig. 4 that there are also attracting points: four in the case of the square boundary, three for the triangular and none for the circular case.
In terms of the expected entropy variation, this means that imposing reflecting boundaries, an infotactic search will always produce maximal entropy decrease in regions that are away from the center and the boundary of the search domain (see the right panel of Fig. 2).


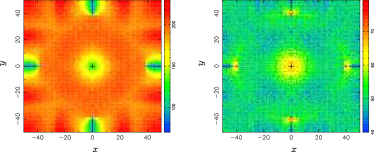
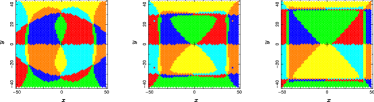
In the previous figures, the correlation length has the same size as the entire search domain. Roughly speaking is the average distance travelled by the molecules emitted by the source before decaying. Therefore, the statistical inference done by infotaxis has an effect over an area with extension around the searcher. In Fig. 5 we study the dependence of the first-step decision map on the correlation length for a square lattice. To consider different values of the correlation length we have kept fixed the effective diffusivity and varied the molecules’ life time . As the correlation length decreases, the central area of the decision map extends towards the boundary. Clearly, the relevant parameter is the ratio between and the size of the lattice.
The results in the right panel of Fig. 5 suggest that in the limit in which the lattice size is much larger than the correlation length, the central repeller dominates the dynamics. As expected, this happens irrespectively of the geometry of the boundary. The effect of the boundary becomes relevant only at distance from it. Moreover, assuming that the source is located near the center of the lattice, the searcher will start moving away form the source into regions where the detections become more rare, and this outward motion will only stop when the searcher reaches the neighborhood of the boundary. In particular, this means that in an infinite domain infotactic searches in the absence of wind will rarely be successful.
Besides the effect of boundary discussed above, the topology of the lattice also influences the structure of the decision map. We illustrate this in Fig. 6 where the first-step decision map is shown for an hexagonal lattice with a square boundary. The symmetry of the partitions inherit the symmetry of the lattice topology, while the rest of the properties found for the square lattice remain the same.
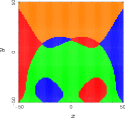
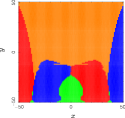
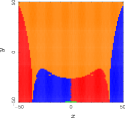
To conclude this section we consider the structure of the decision map for the case in which an advection field exists. This is shown in Fig. 7 for three different values of the wind velocity . The presence of wind destroys the isotropy of the problem. A non-zero yields additional information on the region of the search domain where the source may be located. Roughly speaking, at large Péclet numbers, when the advection dominates the molecular diffusion, if the searcher does not record detections then the source is most likely located downwards (recall that the wind is directed along the negative -axis). Conversely, if detections occur then the searcher will automatically move upwards as the detected molecule is expected to come from that region. This extra information clearly appears in the decision map. In the absence of detections, the region in which the first step is downwards dominates at larger values of . The region corresponding to upwards motion shrinks to zero and the regions in which the first move is left or right remain important only near the boundary.

V Trajectory-to-trajectory fluctuations
In the last section we focus on the fluctuations of the search time in terms of the statistics of the simultaneity index of the search as discussed in carlos ; thiago .
Consider two independent searchers that start simultaneously at the same position , with corresponding search times and . One defines then the random variable
| (6) |
such that ranges in the interval . The simultaneity index measures the likelihood that both searches end simultaneously, and thus it sheds light about the size of the fluctuations of the search time and the robustness of the search in general.
When any typical search will end at similar times, meaning that the most probable value for the search time is close to its statistical mean. On the contrary, when or it means that the search will end at very dissimilar times, so that large fluctuations in the search time are expected. The statistics of the simultaneity index is a quantitative measure of the robustness of a search process when finding the source at reasonably similar times is important. These statistics have been used in the past in the analysis of random probabilities induced by normalisation of self-similar Lévy processes iddo1 , of the fractal characterisation of Paretian Poisson processes iddo2 , and of the so-called Matchmaking paradox iddo3 ; iddo4 , and more recently, to quantify sample-to-sample fluctuations in mathematical finances samor2 ; hol , chaotic systems schehr , the analysis of distributions of the diffusion coefficient of proteins diffusing along DNAsboyer1 ; boyer1a and optimal estimators of the diffusion coefficient of a single Brownian trajectory.boyer2 .
In section III, we have observed that the fluctuations of the search time depend on the position from which the search starts. We showed in the right panel of Fig. 3 that when the search starts over a line separating different regions of the decision map the standard deviation is largest. In this section, we explore this issue using the statistics of the simultaneity index.

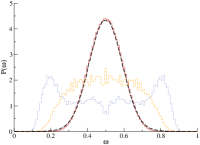
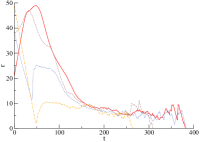
We have numerically computed the probability distribution for different initial positions of the searcher and the source located at the origin. The histograms shown in the left panel of Fig. 8 correspond to some of the initial positions considered in Fig. 1. For , is found to be a unimodal, bell-shaped function with a maximum at . This means that two different infotactic searchers beginning their trajectory within this region will most likely employ the same time to find the source for the first time. For , remains unimodal, but with a larger dispersion than before. More interestingly, for , when the initial position lays on one of the separatrix curves, exhibits a bimodal, M-shaped form with a local minimum at and two maxima at around and 1, meaning that most likely, different searchers will find the source at quite different times, which in turn implies that trajectory-to-trajectory fluctuations are expected to be large. This is exactly what it has been qualitatively observed in Fig. 3
One can grasp the origin of these large fluctuations by looking at how the searcher approaches to the source in time. In the right panel of Fig. 8 we show how the distance from the source evolves on average. In agreement with the first-step decision map discussed in section III, the searchers with initial position near the center of the lattice move outwards from the center (and from the source) for a time , after which they approach the source monotonically until detection become frequent. In the opposite case in which the searcher’s initial position is far from the center, they rapidly approach the source.
As a final remark, we have computed the distribution averaged over all initial positions in the lattice (see the black dashed curve in the left panel of Fig. 8). The bell-shaped distribution indicates that infotaxis is a robust search algorithm in bounded domains, even when the exact initial position of the search is not accessible.
VI Conclusions
We have studied the infotaxis search strategy in finite domains with a reflecting boundary. We find that the time at which infotactic searchers locate the source shows a complex dependence on the starting position. We explain this dependence by noting that in the absence of detections the first step of infotaxis is deterministic, and we study the decision map for this first step. The search domain is partitioned into regions on which the first step is constant, and the boundaries of these regions are determined by the geometry of the boundary, the topology of the lattice and in general by the parameters of the transport process. When the starting position falls near a separatrix curve, the fluctuations around the mean search time increase. These higher fluctuations can also be explained in terms of the initial step.
When the correlation length is much smaller than the domain size, the effectiveness of infotaxis will decrease. When the correlation length is comparable to the domain size, infotaxis remains on average a robust search strategy.
Acknowledgements.
This work has been supported by Grant n. 245986 of the EU-project Robots Fleets for Highly Agriculture and Forestry Management. JDR was also supported by a PICATA predoctoral fellowship of the Moncloa Campus of International Excellence (UCM-UPM). The research of DGU has been supported in part by Spanish MINECO-FEDER Grants MTM2012-31714 and FIS2012-38949-C03-01. We acknowledge the use of the UPC Applied Math cluster system for research computing (see http://www.ma1.upc.edu/eixam/index.html).References
- (1) Kowadlo, G & Russell, R.A. (2008) Robot Odor Localization: A Taxonomy and Survey International Journal of Robotics Research, 27, 869–894 .
- (2) G. Oshanin, H. S. Wio, K. Lindenberg, and S. F. Burlatsky, Intermittent random walks for an optimal search strategy: one-dimensional case, J. Phys.: Cond. Mat. 19, 065142 (2007).
- (3) J. A. Revelli, F. Rojo, C. E. Budde, and H. S. Wio, Optimal intermittent search strategies: Smelling the prey, J. Phys. A Math. Theor. 43, 195001 (2010)
- (4) M. A. Lomholt, T. Koren, R. Metzler, and J. Klafter, Lévy strategies in intermittent search processes are advantageous, Proc. Natl. Acad. Sci. USA 105, 11055 (2008).
- (5) O. Bénichou, M. Coppey, M. Moreau, P. H. Suet, and R. Voituriez, Optimal Search Strategies for Hidden Targets, Phys. Rev. Lett. 94, 198101 (2005).
- (6) E. Gelenbe, Search in unknown random environments, Phys. Rev. E. 82, 061112 (2010).
- (7) M. Vergassola, E. Villermaux, and B. I. Shraiman, ’Infotaxis’ as a strategy for searching without gradients, Nature, 445, 406 (2007).
- (8) C. Barbieri, S. Cocco, R. Monasson, On the trajectories and performance of Infotaxis, an information-based greedy search algorithm. Europhysics Letters 94, 20005 (2011).
- (9) J.-B. Masson, M. Bailly-Bechet, and M. Vergassola, Chasing information to search in random environments, J. Phys. A 42, 434009 (2009).
- (10) J.-B. Masson, Olfactory searches with limited space perception, Proc. Natl. Acad. Sci USA 110(28), 11261 (2013).
- (11) I. Eliazar, On selfsimilar Lévy Random Probabilities, Physica A 356, 207 (2005).
- (12) I. Eliazar and I. M. Sokolov, On the fractal characterization of Paretian Poisson processes, Physica A 391, 3043 (2012).
- (13) I. M. Sokolov and I. Eliazar, The matchmaking paradox: a statistical explanation, J. Phys. A.: Math. Theor. 43, 055001 (2010).
- (14) I. M. Sokolov and I. Eliazar, Sampling from scale-free networks and the matchmaking paradox, Phys. Rev. E 81, 026107 (2010).
- (15) G. Oshanin and G. Schehr, Two stock options at the races: Black-Scholes forecasts, Quantitative Finance 12, 1325 (2012).
- (16) G. Oshanin, Y. Holovatch, and G. Schehr, Proportionate vs disproportionate distribution of wealth of two individuals in a tempered Paretian ensemble, Physica A 390, 4340 (2011).
- (17) C. Mejía-Monasterio, G. Oshanin, and G. Schehr, Symmetry breaking between statistically equivalent, independent channels in few-channel chaotic scattering, Phys. Rev. E 84, 035203 (2011).
- (18) C. Mejía-Monasterio, G. Oshanin, and G. Schehr, First passages for a search by a swarm of independent random searchers, J. Stat. Mech. 06, P06022 (2011).
- (19) T. G. Mattos, C. Mejía-Monasterio, R. Metzler, and G. Oshanin, First passages in bounded domains: When is the mean first passage time meaningful?, Phys. Rev. E 86, 031143 (2012).
- (20) D. Boyer, D. S. Dean, C. Mejía-Monasterio, and G. Oshanin, Optimal estimates of the diffusion coefficient of a single Brownian trajectory, Phys. Rev. E 85, 031136 (2012).
- (21) D. Boyer, D. S. Dean, C. Mejía-Monasterio, and G. Oshanin, Optimal least-squares estimators of the diffusion constant from a single Brownian trajectory, Eur. Phys. J. Special Topics 216, 57 (2013).
- (22) D. Boyer, D. S. Dean, C. Mejía-Monasterio, and G. Oshanin, Distribution of the least-squares estimators of a single Brownian trajectory diffusion coefficient, J. Stat. Mech. 04, P04017 (2013).