High-Resolution Submillimeter and Near-Infrared Studies of the Transition Disk around Sz 91 (catalog )
Abstract
To reveal the structures of a transition disk around a young stellar object in Lupus, Sz 91 (catalog ), we have performed aperture synthesis 345 GHz continuum and CO(3–2) observations with the Submillimeter Array (–3 resolution), and high-resolution imaging of polarized intensity at the -band by using the HiCIAO instrument on the Subaru Telescope ( resolution). Our observations successfully resolved the inner and outer radii of the dust disk to be 65 and 170 AU, respectively, which indicates that Sz 91 (catalog ) is a transition disk source with one of the largest known inner holes. The model fitting analysis of the spectral energy distribution reveals an H2 mass of in the cold (30 K) outer part at AU by assuming a canonical gas-to-dust mass ratio of 100, although a small amount ( ) of hot (180 K) dust possibly remains inside the inner hole of the disk. The structure of the hot component could be interpreted as either an unresolved self-luminous companion body (not directly detected in our observations) or a narrow ring inside the inner hole. Significant CO(3–2) emission with a velocity gradient along the major axis of the dust disk is concentrated on the Sz 91 (catalog ) position, suggesting a rotating gas disk with a radius of 420 AU. The Sz 91 (catalog ) disk is possibly a rare disk in an evolutionary stage immediately after the formation of protoplanets because of the large inner hole and the lower disk mass than other transition disks studied thus far.
1 Introduction
Nearly all newly-formed stars are surrounded by disks of gas and dust, which provide the building blocks of planets (Evans et al., 2009). Thus, studying the structure and evolution of these protoplanetary disks provides information about how and when planets form. Initially, the disks are optically-thick, producing broadband infrared (IR) emission well in excess of the stellar photosphere. The star+disk system has a rather flat IR spectral energy distribution (SED) slope (e.g., Lada & Wilking, 1984; Lada, 1987). By Myr, nearly all stars lack evidence of warm circumstellar dust and accretion onto the star (e.g., Fedele et al., 2010; Currie & Sicilia-Aguilar, 2011). This implies that most protoplanetary disks around solar/subsolar-mass stars have disappeared by this time, and the disk material has been accreted/dispersed because of processes such as photoevaporation or the disk material has been incorporated into planets.
Transition disks bridge the gap between these endpoints of disk evolution because their excess emission at some IR wavelengths is intermediate between those of an optically thick disk and a star lacking a disk (e.g., Strom et al., 1989). Although the term “transition disk” includes a diverse set of morphologies, a major subset of these objects include those with near/mid IR deficits (relative to an optically-thick disk) but optically-thick emission at other, typically longer wavelengths, which is indicative of inner holes or gaps (e.g., Calvet et al., 2002). IR SED modeling implies that the hole or gap sizes for these objects typically range between and AU (e.g., Espaillat et al., 2010; Merín et al., 2010) and encloses the planet-forming region in our own solar system. SED modeling has identified numerous other transition disks in nearby star forming regions (e.g., Cieza et al., 2010; Merín et al., 2010; Currie & Sicilia-Aguilar, 2011; Romero et al., 2012; Cieza et al., 2012b). Because formation of gas giant planets creates holes or gaps in disks, transition disks with SEDs consistent with these features may be excellent laboratories for studying planet formation.
Although SED modeling can provide indirect evidence of an inner hole or gap, high-resolution observations with long baseline (sub-)millimeter interferometers and large aperture IR telescopes provide direct evidence of their existence (e.g, Brown et al., 2009; Hughes et al., 2009; Andrews et al., 2011; Isella et al., 2012; Cieza et al., 2012a; Mathews et al., 2012; Thalmann et al., 2010; Hashimoto et al., 2012; Mayama et al., 2012). Since millimeter and micron sized dust grains contribute to the majority of millimeter and NIR emissions, it is important to compare the detailed spatial distributions of these tracers for understanding the physics of the transition disks.
Sz 91 (catalog ) is an M0.5 young star surrounded by a transition disk located in the Lupus III molecular cloud ( pc; Comerón, 2008). The stellar position, (, ), is (16h 07m 116, 03 472). The stellar mass and age have been estimated to be 0.49 and 5 Myr, respectively (Hughes et al., 1994). The H line width at 10 % of the peak has been measured to be 283 km s-1, suggesting accretion with yr-1 (Romero et al., 2012). Sz 91 (catalog ) is classified as a wide binary with a separation of 9″(Melo, 2003), corresponding to 1800 AU. However, such a wide binary system is unlikely to disturb the disk evolution of a host star (Kraus et al., 2012; Harris et al., 2012). Moreover the difference between their proper motions implies that these sources are not co-moving (Roeser et al., 2010). We therefore treat the Sz 91 (catalog ) disk as a circumstellar disk around a single star system throughout this paper.
The SED of Sz 91 (catalog ) is characteristic of the transition disk. The following remarkable features of this source can be identified in the SED: no significant IR excess with a spectral index from to 24 of (i.e., class III in the IR categorization), presence of a large dip of approximately 20 , and very steep flux density rising between 24 and 70 (Evans et al., 2009; Romero et al., 2012). Romero et al. (2012) categorized Sz 91 (catalog ) as a giant planet-forming disk on the basis of the following features: very steep increase in flux density at 24 , which indicates a sharp edge at the inner radius of the disk; a clear sign of mass accretion onto the central star; a relatively massive disk ( ).
Although most transition disks with inner holes have flux deficits restricted to 1–10 and optically thick emission at longer wavelengths, Sz 91 (catalog ) differs from them because its flux deficit extends to significantly longer wavelengths (24 ), and it has strong far-IR to millimeter emission. The total flux density of the 870 (345 GHz) continuum emission of Sz 91 (catalog ) has been estimated to be 34.52.9 mJy (Romero et al., 2012). Although the 1.3 mm continuum emission had not been detected previously (Nuernberger et al., 1997), the recent wide field imaging survey with the AzTEC receiver on the Atacama Submillimeter Telescope Experiment (ASTE) has clearly detected a 1.1 mm flux density of 27.26.0 mJy (Kawabe et al., 2014). These submillimeter flux densities imply that the Sz 91 (catalog )’s disk is substantially massive with respect to those of other class III sources in nearby star forming regions (Andrews & Williams, 2005, 2007); the flux densities roughly correspond to 2–510-3 if the canonical gas-to-dust mass ratio of 100 is assumed. Such an object having significant submillimeter flux density, but no NIR excess appears to be at the transition phase from class II to III and is quite rare (5 % Andrews & Williams, 2005, 2007). Although a recent high-resolution imaging survey for transition disk objects (Andrews et al., 2011) has successfully revealed a large inner hole in the disk up to a radius of AU, there is selection bias for the most massive transition disks. Because the submillimeter flux density of Sz 91 (catalog ) is the lowest among the transition disk objects studied thus far, considering the distance to the source (Fig.10 in Andrews et al., 2011), Sz 91 (catalog ) is a crucial target for investigating the disk evolution from the perspective of a variety of submillimeter flux densities, i.e., the disk mass. However, the disk structure has not been resolved thus far, and high-resolution imaging observations are urgently required.
In this paper, we present the first sub-arcsecond resolution images toward Sz 91 (catalog ) at submillimeter and near infrared wavelengths. In section 2, observational parameters and calibration for the obtained data are described. In section 3, high-resolution images are shown. In section 4, the detailed disk structure is discussed on the basis of model fitting to the SED and the CO(3–2) line profile. The unique nature of Sz 91 (catalog ) is determined from a comparison with other transition disks. Finally in section 5, the key results of this study are summarized.
2 Observations and Data Reduction
2.1 High-resolution Imaging of the 345 GHz Continuum and CO(3–2) Emission
Interferometric observations of the 345 GHz continuum and CO(3–2) emission toward Sz 91 (catalog ) were conducted in 2010 with the Submillimeter Array (SMA; Ho et al., 2004), which comprises eight 6 m antennas located atop Mauna Kea in Hawaii. The observations were performed in the compact configuration with baselines ranging from 6 to 70 m. For the continuum emission, higher resolution data were also obtained in 2010 in the very extended configuration with baselines up to m. The field of view of SMA was approximately in full width at half maximum (FWHM). The emission was detected using double side-band superconductor-insulator-superconductor receivers with a local oscillator frequency of GHz. Both the upper and lower sidebands data were used for the continuum, resulting in an 8 GHz bandwidth in total. The channel spacing of the CO(3–2) line was set to 0.8125 MHz.
The amplitude and phase of the array system were calibrated by observations of quasars, J1604446, J1626298, and J1517243, in a cycle with 12.5 min on a target and 6 or 8 min on a quasar. The response across the observed passbands was determined by 60 min observations of quasar, 3C 273. Absolute flux calibration was achieved by observing Titan at the beginning and end of each night.
We created the continuum images by combining the very extended and compact configuration data, whereas the CO maps were created from the compact configuration data only. The UV data were edited and calibrated using MIR, an IDL-based software package. We used Astronomical Image Processing System (AIPS) for imaging procedures, including deconvolution by the CLEAN algorithm and restoration with a synthesized beam. Both continuum and line emission maps were created with natural weighting in the visibility plane, producing synthesized beam FWHMs of at a position angle (PA) of and at a PA of , respectively.
2.2 High-resolution Polarized Intensity Imaging at band with the Subaru Telescope
-band (2.15 ) linear polarized intensity (PI) images of Sz 91 (catalog ) were obtained with the high-contrast imaging instrument (HiCIAO; Tamura et al., 2006) combined with dual-beam polarimetry from the 8.2 m Subaru Telescope in May 2012. The observations were conducted under the program SEEDS (Strategic Explorations of Exoplanets and Disks with Subaru; Tamura, 2009). The adaptive optics system (AO188: Hayano et al., 2004) provided a limited diffraction and mostly stable stellar point spread function (PSF) with a FWHM of in the band. Polarization differential imaging (PDI) is a powerful technique used to reveal the structure of a dusty disk in very close proximity to a star (e.g., Thalmann et al., 2010; Hashimoto et al., 2011, 2012; Tanii et al., 2012; Muto et al., 2012; Kusakabe et al., 2012; Mayama et al., 2012). We employed the PDI mode, combined with the angular differential imaging mode, in which the field of view and the pixel scale were and 9.5 mas pixel-1, respectively. Half-wave plates were placed at the four angular positions of , , , and in sequence with a 30 sec exposure per wave plate position. Image Reduction and Analysis Facility (IRAF111IRAF is distributed by National Optical Astronomy Observatory, which is operated by the Association of Universities for Research in Astronomy, Inc., under cooperative agreement with the National Science Foundation.) software was used for all data reduction as following the methods of Hashimoto et al. (2011) and Tanii et al. (2012), and the Stokes Q and U parameter images were created. We calculated the PI as and the polarization vector angle as with the 3.4.0 version of the Common Astronomy Software Applications package. The final PI image was created from the smoothed Q and U images by a Gaussian function; thus, the effective resolution of the image became .
3 Results
3.1 345 GHz Continuum Emission Map
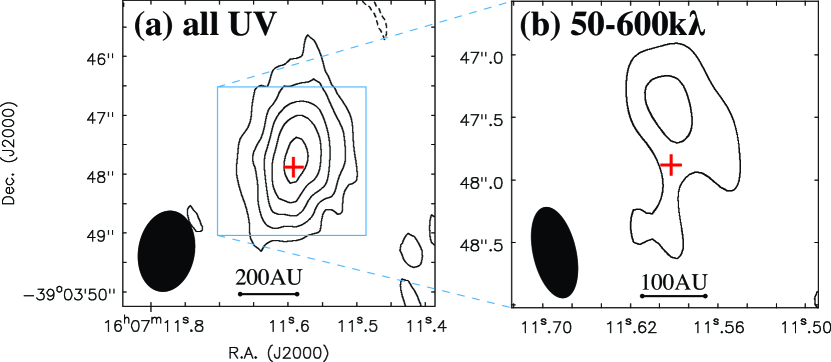
We created a 345 GHz continuum emission map of Sz 91 (catalog ) with all UV data as shown in Figure 1(a). The map shows a strong continuum emission peak at the stellar position. The total flux density is measured to be 32.13.6 mJy, which agrees well with the flux density of 34.52.9 mJy, which is the previous 345 GHz measurement with the 12 m single dish APEX telescope obtained by Romero et al. (2012). The 345 GHz emission is resolved by the beam at a PA of . The beam-deconvolved size of the emission is measured to be (1701)(0702) with a PA of 169030 from a 2-D Gaussian fitting, corresponding to (34020)(14040) AU at a distance of 200 pc. This size is comparable to that of a typical protoplanetary disk. The 345 GHz emission is probably thermal dust emission from the disk around Sz 91 (catalog ) because the flux densities from 350 to 1100 monotonically decrease with a spectral index of (Figure 5), which is comparable to other T Tauri stars (Andrews & Williams, 2005, 2007).
Moreover, we created a higher-resolution 345 GHz image using the UV data over the UV range from 50 to 600 k as shown in Figure 1(b). The emission peak at the 4.5 level can be found to the north of the star. The peak position is measured to be (16h 07m 116, 03 478) and is shifted from the stellar position by toward the direction at a PA of . The lack of a peak at the stellar position implies that the inner part of the dust disk is depleted or cleared as expected from the SED. Therefore, the continuum emission in Figure 1(b) probably originated from the innermost part of the dust disk. Assuming that the peak position in figure 1(b) represents the inner edge of the dust disk, the inner radius of the Sz 91 transition disk is estimated to be 8625 AU. The total flux density of this compact component is measured to be 13.23.1 mJy, which is 40 % of the total flux density in Figure 1(a).
3.2 CO(3–2) Molecular Line Emission Maps
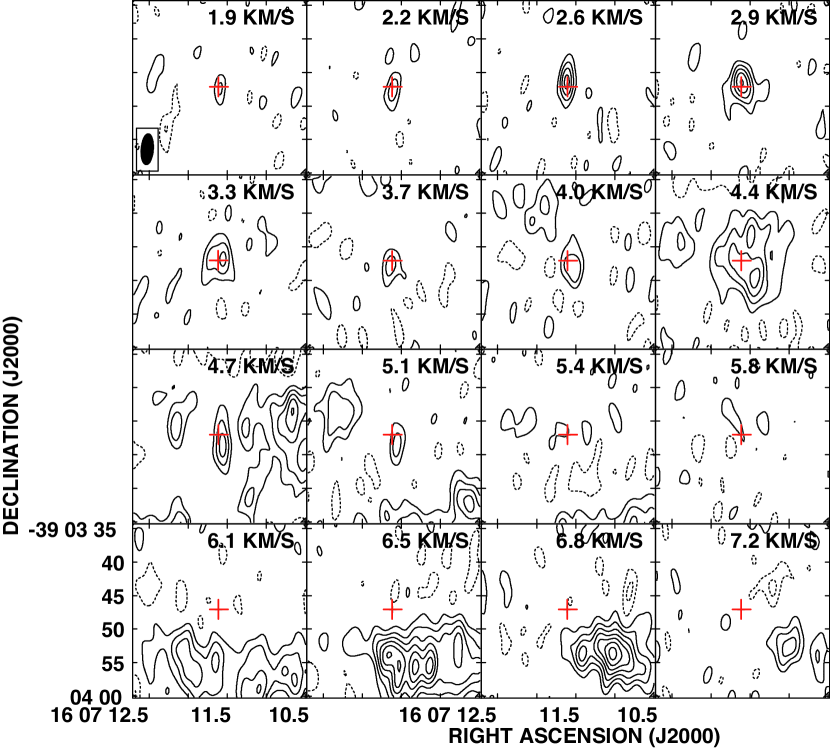
Figure 2 shows velocity channel maps of the CO(3–2) line. The significant CO(3–2) emission is detected in the velocity range from 1.9 to 7.2 km s-1 in . It is clear that the emission at 1.9–5.8 km s-1 is concentrated at the stellar position. In addition, a velocity gradient appears to be present along the north-south direction in this velocity range: the emission is located mainly on the north side of the star at 2.6–2.9 km s-1 and at the south from 4.0 to 5.1 km s-1. Notably, the central velocity range from 3.3 to 4.0 km s-1 includes the radial velocity of Sz 91 (3.87 km s-1, converted from km s-1; Melo, 2003). In the range of 4.4–5.4 km s-1, we detected spatially extended emission near the star (4.4 and 4.7 km s-1) and at the south side of the field of view (4.7–5.4 km s-1). The origin of the extended components is most probably an ambient cloud because the systemic velocity and the velocity width of the main cloud condensation of Lupus III have been measured to be 4.1 and 1.2 km s-1, respectively (Hara et al., 1999). We also detected the extended emission in the 6.1–7.2 km s-1 channels. These components are shifted by toward the south-west direction from the star and also possibly originate from the spatially extended ambient cloud. Hereafter, we focus on compact components toward the star that should have originated from the gas disk; we do not discuss the extended components in this paper.
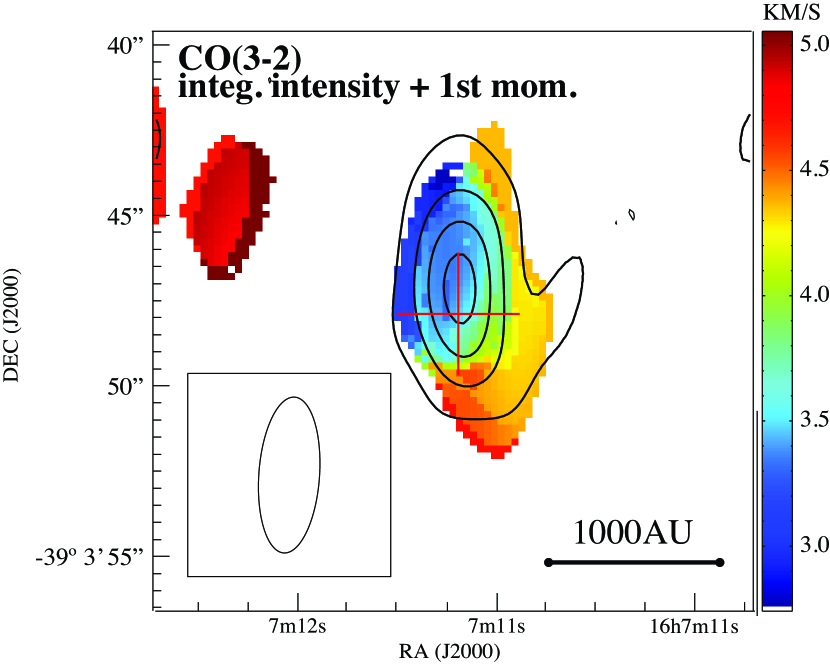
To clearly see the gas disk emission and its velocity gradient, we created total integrated intensity (1.5–6.1 km s-1) and first moment maps of the CO(3–2) line, as shown in Figure 3. From these maps, we successfully detected the centrally concentrated emission and the velocity gradient roughly along the north-south direction, suggestive of the rotating gas disk. The total integrated intensity of CO(3–2) in the area above the 3 noise level is 8.55 Jy km s-1. The emission peak is shifted from the stellar position by toward the north direction, possibly because the red-shifted emission is partially resolved-out owing to the contamination by the ambient cloud.
3.3 Polarized Intensity Image at band
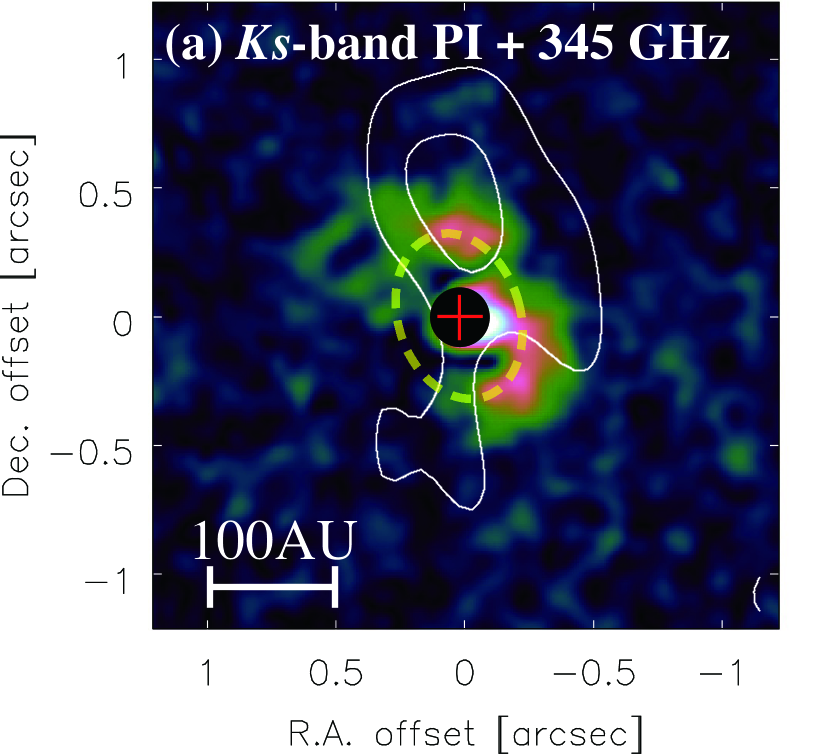
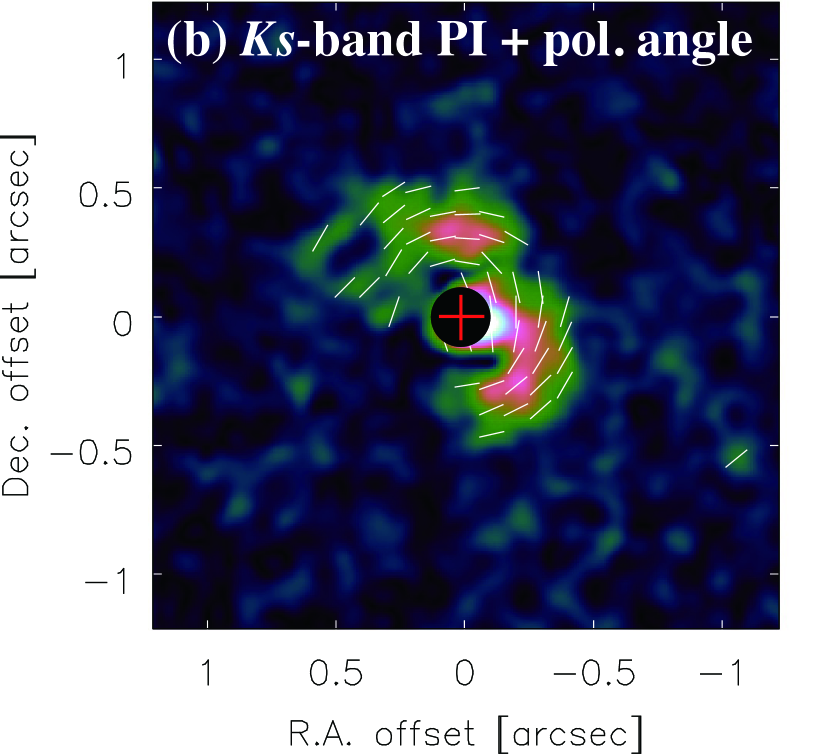
The high-resolution PI and polarization vector angle maps at the -band are shown in Figures 4(a) and (b), respectively. The presented images are smoothed and the effective resolution of the images is . A crescent-like emission region was detected around Sz 91 (catalog ), which is elongated from the south to the north via the west side of the star. The polarization angles are nearly perpendicular to the radial directions from the central star, indicating that the -band emission probably originated from the scattered light at the inner part of the dust disk. The crescent-like emission suggests that this part is the near side of the disk if we assume that forward scattering is dominant, as is the case in Mie scattering. Substantial emission dips appear at the north and south sides of the software mask, possibly due to the inner hole structure of the dust disk. The PSF subtraction process is a primary factor to cause an artificial systematic error near the star, and the error becomes a systematic emission via the square root operation of stokes Q and U. The symmetric distribution of the dips indicates the existence of an inner hole in the dust disk.
We also detected a bright region near the western edge of the software mask, i.e., a photometrically reliable emission. However, the origin of this emission remains unclear. Because the PSF shows a substantially symmetric distribution, it is unlikely that the bright emission would appear at the only one-side. Because it extends to the edge of the software mask, higher resolution and higher contrast observations close to the star are required to determine the origin of the bright emission.
The existence of the inner hole structure expected from the PI image strongly supports the results of the submm images. The higher-resolution 345 GHz image is overplotted in Figure 4(a). It is clear that the PI is distributed at the innermost part of the submm emission. For example, along PA=0, the 345 GHz emission peaks at from the star whereas the PI peaks at . These facts suggest the existence of the hole structure at the inner part of the disk and that the PI originates from the innermost part of the transition disk, i.e., the inner edge.
To quantify the shape of the inner edge of the dust disk, we fit an ellipse to the crescent-like emission. Table 1 lists the parameters of the best-fit ellipse, and the fitted ellipse is shown in Figure 4(a) by the yellow dotted line. The center position of the ellipse coincides with the stellar position. The PA of the ellipse, i.e., the direction of the disk major axis, is along at , which is consistent with the PA of the emission dips in the crescent-like emission. The PI at the disk minor axis (PA) appears to be lower than that at the major axis. This result is probably due to lower polarization degree along the minor axis where the scattering angle at the disk surface is deviated from 90 (McCabe et al., 2002).
| Parameter | Best-fit value | Error |
|---|---|---|
| R.A.11Offset from the stellar position. () | 0.03 | 0.04 |
| Dec.11Offset from the stellar position. () | 0.03 | 0.02 |
| Major axis () | 0.33 | 0.02 |
| Minor axis () | 0.25 | 0.08 |
| Position angle () | 17.5 | 17.7 |
4 Discussion
4.1 Spatially Resolved Disk Structure
Both the high-resolution submm and NIR images clearly resolved the disk structure around Sz 91 (catalog ). In this section, we estimate the inner radius, outer radius, and inclination angle of the disk directly from our images. These parameters are adopted in the model calculations in sections 4.2 and 4.4.
The inner radius of the dust disk can be estimated from the large inner hole revealed in the -band PI image. Assuming that the -band emission is the scattered light at the inner edge of the disk, the best-fit ellipse in the -band image shows the inner radius to be 654 AU. There are two possibilities to explain the scattered light. One is forward scattering at the surface of the inner part of the disk, and the other is scattering at the inner wall of the disk such as that in the case of LkCa 15 (Thalmann et al., 2010). We can not judge which case is more likely to explain the NIR emission from the Sz 91 disk. However, in either case, it probably originates from the innermost part of the disk, and our estimation of the inner radius seems to be reasonable. The high-resolution 345 GHz image also provides a rough estimate of the disk inner radius. Although the 345 GHz image in Figure 1(b) does not clearly show the presence of the inner hole, it is clear that the 345 GHz flux density becomes weak toward the central star, which is suggestive of dust depletion near the star. The angular distance between the 345 GHz emission peak and the central star can be interpreted as the disk inner radius of ( AU), which is roughly consistent with the above estimate of 65 AU. In the following discussion, we adopt the disk radius of 65 AU.
The outer radius of the dust disk can be estimated from the beam-deconvolved size of the full-UV 345 GHz map shown in Figure 1(a). Assuming a geometrically thin disk, the beam-deconvolved size of (1701)(0702) corresponds to the outer radius of 17020 AU at the distance of 200 pc. The gas disk is also resolved in CO(3–2) (Figure 3). The beam-deconvolved size is measured to be (3103)(1607) at a PA of 1511°from a 2-D Gaussian fitting, corresponding to 31060 AU. However, the red-shifted gas is probably contaminated by the ambient cloud gas, and the center position of the beam-deconvolved disk is shifted by from the star to the north. Thus we consider the largest distance of from the stellar position as the outer radius of the gas disk: 420 AU. Because the actual intensity distribution of each emission is expected to have a power-law form, these outer radii derived from the Gaussian fitting should be regarded as lower limits.
The outer radius of the gas disk is much larger than that of the dust disk. The discrepancy in radial extension between the dust and gas emissions is frequently observed for other protoplanetary disks, which can be explained by an exponential decrement in the surface density (e.g., Hughes et al., 2008; Panić et al., 2009; Isella et al., 2010) or by the radial drift of large grains (Andrews et al., 2012). In addition, the possible north-south asymmetry in the dust continuum emission, suggested in Figure 1(b), could have resulted from the azimuthal drift of large grains (Birnstiel et al., 2013; van der Marel et al., 2013) associated perhaps with a perturbing body orbiting within the central hole of this disk.
The disk inclination angle can be derived from the ratio of the major to minor axis lengths of the best-fit ellipse in Figure 4(a): 4015 from face-on. Moreover, the beam-deconvolved size of the 345 GHz continuum emission in Figure 1(a) provides an inclination angle of 665. The latter value of 66, however, is possibly influenced by the disk flaring because the distribution of the 345 GHz emission is biased to the outer part of the disk. Thus, we adopt the -band value of 40 as the disk inclination angle in this study. In fact, for the CO(3–2) spectrum, the model calculation in section 4 prefers the smaller value of 40.
4.2 Disk Parameters Derived from SED fitting
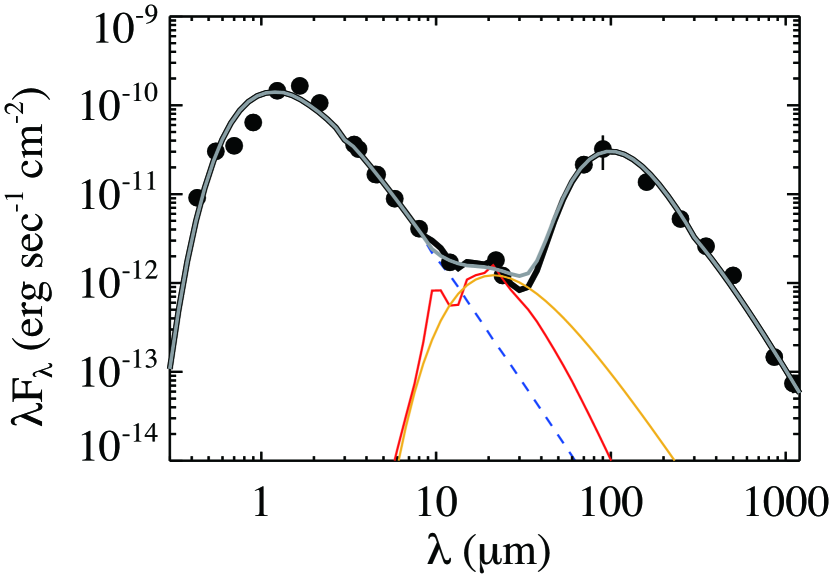
To deduce other parameters of the dust disk, we performed least-square fitting to the SED on the basis of the power-law disk model. Figure 5 shows the SED of Sz 91 (catalog ) that includes our 345 GHz flux density and a recent data set by WISE. As Romero et al. (2012) reported, the SED is characterized by large dip around 20 , sharp rise from 20 to 70 , and significant (sub-)millimeter emission.
We introduced the two components of a cold disk and a small amount of hot dust inside the disk as follows. First, we applied the model for the cold disk, which comprised the usual power-law disk and blackbody stellar emissions, to all of the SED data except that at 10–30 , because the model could not reproduce all the data points including the three points at 10–30 . The power-law disk model has surface density and temperature radial distributions of and , respectively, in a power-law form (Kitamura et al., 2002; Tsukagoshi et al., 2011):
| (1) |
and
| (2) |
where is the radial distance, and are the surface density and temperature at the inner radius, , and and are power-law indexes. The gas-to-dust ratio was assumed to be 100 and the extinction of the stellar light because of the interstellar dust was corrected by the value toward the star and the dust mass absorption coefficient (Figure 1 of Adams et al., 1988). Table 2 lists the fixed parameters in the SED fitting. The stellar mass, the effective temperature of the star, and the visual extinction toward the star are from Hughes et al. (1994). The inner and outer radii and inclination angle of the disk were determined in section 4.1. We here adopted the values of 1.5 and 0.5 as and , respectively, which are the same as those of the minimum mass solar nebular (Hayashi, 1981). These values were selected because the SED fitting is known to be insensitive to the power-law index of and it is difficult to resolve the parameters for the temperature profile ( and ) from only the longer wavelength data ( µm). Notably, the lower limit of the disk temperature was set to be 10 K, which is the typical temperature of the Lupus III cloud (Vilas-Boas et al., 2000). The stellar radius, , , , and the power-law index of the dust mass opacity coefficient ( cm2 g-1: Beckwith et al., 1990) were treated as the free parameters in the SED fitting.
After the power-law disk model fitting, we introduced the additional hot component inside the disk to reproduce the observed flux densities at . The presence of the inner hot component is supported by the sign of mass accretion derived from the H emission line (Romero et al., 2012). Because no information was available on the structure of this component, we simply assumed a gray body with a temperature of , a column density of , and a solid angle of . Its flux density at wavelength is written by
| (3) |
where is the Plank constant, is the speed of light, and is the Boltzmann constant. We applied the same dust mass opacity coefficient, , as that in the cold disk. The parameters of , , and were treated as free. In the fitting, the upper limit of was set to be str, corresponding to the solid angle of the inner hole seen in the NIR image.
The best-fit model SED of the cold disk reproduced the longer wavelength data ( µm) effectively, as shown in Figure 5. The best-fit parameters of the cold disk are summarized in Table 3. The value of 0.50.1 is significantly smaller than that in the diffuse interstellar medium of (Draine & Lee, 1984), suggesting that the dust growth occurs in the disk (Miyake & Nakagawa, 1993). By adopting this and introduced by Beckwith et al. (1990), who assumed a 100:1 mass ratio between gas and dust, the disk mass is derived to be (2.40.8) . This value is significantly higher than those of other class III sources in nearby star forming regions (Andrews & Williams, 2005, 2007); however, the value is lower than those of most of the transition disks studied thus far (Andrews et al., 2011), even if we consider the difference in by a factor of 1.7 at GHz between this study and the previous studies in which is set to be 1.
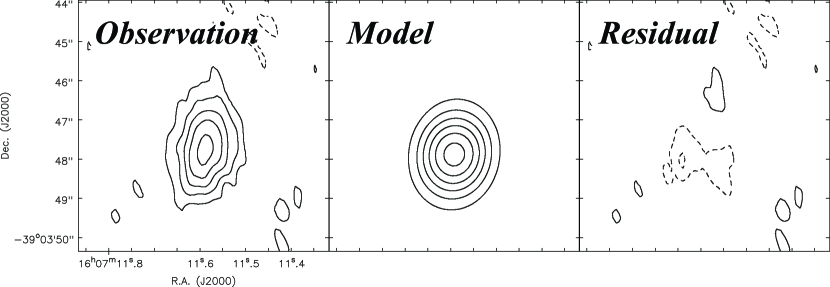
To verify the fitting result, we also created a continuum image for the best-fit model and compared it with the observations, as shown in Figure 6. The model image essentially agrees with the observations, but there remains a difference of at most ; the negative residual extends in the east-west direction, which may be due to the asymmetry of the disk.
We next attempted to reproduce the observed flux densities at 10–30 by adding the contribution from the hot component. The best-fit parameters of , , and to reproduce all of the SED data were searched in the reduced maps by manually changing the initial values of , , and with 6000 runs.
From the calculations, we determined that there are two distinct regions in the - plane where the reduced takes its local minimum values, which indicates a strong coupling between and . One is the region in which g cm-2 and str, and the emission of the hot component is substantially optically thin. In this region, the best-fit typically converges to be 186 K and the best-fit is inversely proportional to . The product of is a constant value, which provides the best-fit mass of for the hot component. The other is the region in which g cm-2 and the emission is substantially opticall thick. In this region, the best-fit is typically 172 K and is independent of . For the hot component, we can obtain the best-fit str and the lower limit mass of . Although the reduced values are slightly lower in the former case (), the difference between the two regions is not significant. We therefore conclude that there are two possible origins of the hot component: the optically thin gray body emission and the optically thick black-body emission. However, the optically thin condition is the unlikely case because the mass of the hot component is too small given the mass accretion rate of yr-1; all the hot component would disappear in only 30 yrs.
Notably, the contribution of the hot component is mainly restricted by only three data points at MIR, from 12 to 25 ; the upper limit of the temperature is determined by the slight excess emission at 12 and the lower limit is limited by the decrement between 22 and 24 . A refined model will be required when more data at MIR and FIR are obtained by further observations.
| Parameter | Fixed Value |
|---|---|
| () | 0.4911Hughes et al. (1994) |
| (mag) | 2.011Hughes et al. (1994) |
| (AU) | 65 |
| (AU) | 170 |
| (degree) | 40 |
| 1.5 | |
| 0.5 |
| Parameter | Value |
|---|---|
| Stellar parameters | |
| () | 1.290.03 |
| (K) | 414855 |
| () | 0.490.02 |
| Cold outer disk | |
| (K) | 32.53.9 |
| 11The surface density and the disk mass are shown in the gas+dust density and mass by assuming the gas-to-dust mass ratio of 100. (g cm-2) | 0.670.03 |
| 0.50.1 | |
| 11The surface density and the disk mass are shown in the gas+dust density and mass by assuming the gas-to-dust mass ratio of 100. (10-3 ) | 2.40.8 |
4.3 Origin of the Hot Component in the Inner Hole of the Disk
The SED model analysis indicates that the presence of a hot component inside the dust disk with a temperature of 180 K, which is responsible for the SED peak at 20 . There are two possible origins for such a hot component: a localized self-luminous emitting body (i.e., circumplanetary disk) or an inner warm structure of the disk (Wolf & D’Angelo, 2005). In this section, we estimate the size and mass of the hot component for both cases.
In the case of the circumplanetary disk, we can estimate the radius from because it is usually optically thick (D’Angelo et al., 2003). Assuming the circumplanetary disk is parallel to the parent circumstellar disk, the solid angle of str corresponds to the radius of 0.3 AU, or 64 . On the other hand, the Hill radius of a putative planet around Sz 91 (catalog ) is expressed by
| (4) |
where and are the mass and orbital radius of the planet, respectively. The radius of the circumplanetary disk inferred from the SED fitting is significantly smaller than at 3–65 AU from the star, which is consistent with the theoretical expectation for a circumplanetary disk (e.g., Tanigawa et al., 2012). However, our ADI observation with the Subaru telescope could not examine the presence of such a companion planet due to a low rotation angle of .
For the second possibility, because the hot component could be fitted with a single temperature, it must be confined to a narrow width in radius. If we extrapolate the temperature distribution of the outer disk determined in the SED fitting, the temperature of the hot component in the optically thick case (172 K) corresponds to a radius of 2.3 AU. The best-fit str corresponds to a ring width of 0.01 AU, which is significantly narrow with respect to the ring radius. In contrast, the optically thin condition is unlikely because the solid angle is str which corresponds to a ring width of 53 AU. Therefore we conclude that the other implication of the hot component is the optically thick ring at 2.3 AU, whose total mass is at least . Such an example of the optically thick ring around the transition disk has also been reported in RX J1633.9-2442 (Cieza et al., 2012a). The inner structure of Sz 91 (catalog ) may be similar to that of RX J1633.9-2442, whereas Sz 91 (catalog ) exhibits a larger inner hole and a lower disk mass.
4.4 Velocity Structure of the Gas Disk: Model Calculation and Comparison with CO(3–2) Profile
The CO(3–2) image shown in Figure 3 suggests the presence of a rotating gas disk around the star. To reveal the disk rotation in detail, we calculated model spectra of CO(3–2) with a simple power-law disk model according to that reported by Kitamura et al. (1993), and we compared the results with the observed CO(3–2) profile.
The following parameters of the model disk were estimated from the observed images and the SED fitting: the inner and outer disk radii of 65 and 420 AU, respectively; the temperature distribution of K, and the surface density distribution of g cm-2. The hydrostatic equilibrium is assumed along the vertical direction and the density distribution, , is therefore expressed by
| (5) |
where is the scale height given by
| (6) |
Here, is the gravitational constant, is the stellar mass, is mean molecular weight, and is the mass of H atom. The density at the midplane is expressed by
| (7) |
The gas motion is assumed to be Kepler rotation whose velocity field is written by
| (8) |
The fractional abundance of CO with respect to H2 is assumed to be , which corresponds to a typical interstellar value (e.g., Schloerb & Snell, 1984; Irvine et al., 1985). Because the density of the disk is at least cm-3 at the midplane which is significantly higher than the critical density of CO(3–2) ( cm-3), we assume local thermodynamic equilibrium (LTE). Notably, the hot component in the dust hole was not included because its contribution was negligible ( Jy).
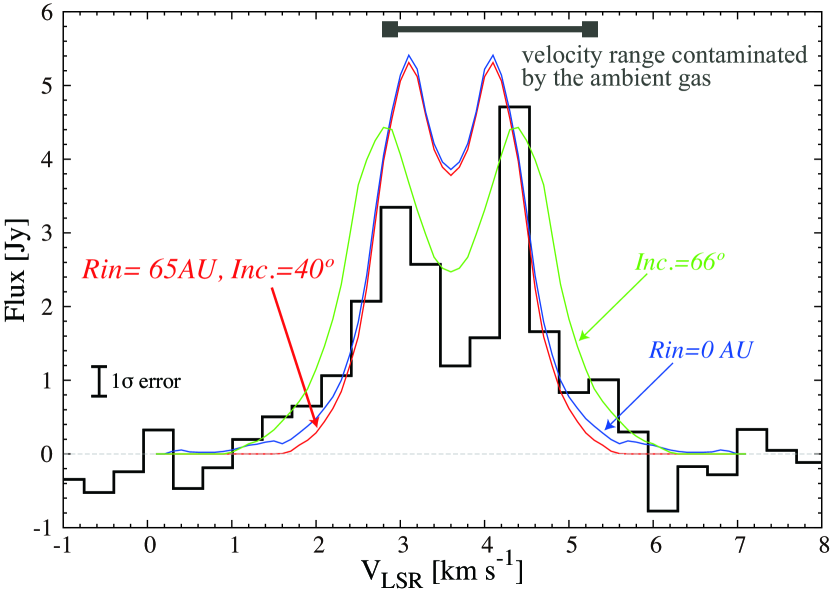
Figure 7 shows the calculated CO spectra superimposed on the observed CO spectrum integrated over a box centered at the stellar position. We noted that the peak intensity of the calculated CO spectrum differed from the observed value. However, the discrepancy is not significant because the disk emission around the stellar LSR velocity is probably contaminated by the ambient cloud emission. Therefore, we focused on the emission at the blue-shifted side ( km s-1). The model profile in the case agrees with the observed data, confirming the validity of the disk parameters derived from the dust disk. Notably, the inclination angle of 66 determined by the 345 GHz image did not fit well the CO line shape, indicating that the inclination of the dust disk estimated from the NIR scattered light is more plausible.
The presence of the gas inside the inner edge of the dust disk could not be confirmed from our data set. Although we calculated the model spectrum for 0 AU as shown in Figure 7, the difference is within the uncertainty. The presence of the gas disk in the inner hole is supported by the fact that Sz 91 (catalog ) shows the mass accretion onto the star, and thus, higher spatial resolution imaging is required to reveal the inner structure of the gas disk.
5 Summary
We present the results of the aperture synthesis 345 GHz continuum and CO(3–2) line emission observations with SMA toward a transition disk object in Lupus, Sz 91 (catalog ). Furthermore, a high resolution image of the polarized intensity at the band obtained with the Subaru Telescope is also presented. The transition disk around Sz 91 (catalog ) has been directly resolved and imaged in this study. The disk parameters are derived and the structure and evolutional phase of the Sz 91 (catalog ) transition disk are discussed. The main results of our observations are summarized in the following points:
-
•
Our high-resolution imaging revealed a dust disk around Sz 91 (catalog ) with inner and outer radii of 65 and 170 AU, respectively, and an inclination angle of 40. Furthermore, the Kepler rotating gas disk with a radius of 420 AU was imaged in the CO(3–2) line.
-
•
Model analysis of the SED of Sz 91 (catalog ) was performed by using a simple power-law disk model. We determined that the observed SED can be reproduced well by the combination of a cold disk and a hot component in the inner hole of the disk. The total H2 mass of the cold disk is estimated to be if the canonical gas-to-dust mass ratio of 100 is adopted. The disk mass is significantly higher than those of other class III sources in nearby star forming regions; however,the disk mass is one of the lowest masses among the currently known transition disks.
-
•
We determined that the hot component can be expressed by a single temperature gray body of K. Although the hot component could not be resolved by our observations, its origin is either a localized self-luminous emitting body (i.e., a Jovian mass protoplanet with a circumplanetary disk) or an optically thick ring in the inner hole of the disk at 2.3 AU.
-
•
Our results confirm the previous results such that the disk structure of Sz 91 (catalog ) is consistent with that of an ongoing giant planet forming disk. In particular, the relatively large inner hole and lower disk mass indicate that the transition disk of Sz 91 (catalog ) is probably in a stage of nearly completing planet formation. Sz 91 (catalog ) will be a crucial target for investigating the evolution of transition disks and the planetary formation process. In the near future, our proposed study with the Atacama Large Millimeter/submillimeter Array (ALMA) will provide a new insight into the planet formation process.
References
- Adams et al. (1988) Adams, F. C., Shu, F. H., & Lada, C. J. 1988, ApJ, 326, 865
- Andrews & Williams (2005) Andrews, S. M., & Williams, J. P. 2005, ApJ, 631, 1134
- Andrews & Williams (2007) Andrews, S. M., & Williams, J. P. 2007, ApJ, 671, 1800
- Andrews et al. (2011) Andrews, S. M., Wilner, D. J., Espaillat, C., et al. 2011, ApJ, 732, 42
- Andrews et al. (2012) Andrews, S. M., Wilner, D. J., Hughes, A. M., et al. 2012, ApJ, 744, 162
- Beckwith et al. (1990) Beckwith, S. V. W., Sargent, A. I., Chini, R. S., & Guesten, R. 1990, AJ, 99, 924
- Birnstiel et al. (2013) Birnstiel, T., Dullemond, C. P., & Pinilla, P. 2013, A&A, 550, L8
- Brown et al. (2009) Brown, J. M., Blake, G. A., Qi, C., et al. 2009, ApJ, 704, 496
- Calvet et al. (2002) Calvet, N., D’Alessio, P., Hartmann, L., et al. 2002, ApJ, 568, 1008
- Cieza et al. (2010) Cieza, L. A., Schreiber, M. R., Romero, G. A., et al. 2010, ApJ, 712, 925
- Cieza et al. (2012a) Cieza, L. A., Mathews, G. S., Williams, J. P., et al. 2012, ApJ, 752, 75
- Cieza et al. (2012b) Cieza, L. A., Schreiber, M. R., Romero, G. A., et al. 2012, ApJ, 750, 157
- Comerón (2008) Comerón, F. 2008, Handbook of Star Forming Regions, Volume II, 295
- Currie & Sicilia-Aguilar (2011) Currie, T., & Sicilia-Aguilar, A. 2011, ApJ, 732, 24
- Cutri et al. (2003) Cutri, R. M., et al. 2003, The IRSA 2MASS All-Sky Point Source Catalog, NASA/IPAC Infrared Science Archive. http://irsa.ipac.caltech.edu/applications/Gator/,
- Cutri & et al. (2012) Cutri, R. M., & et al. 2012, VizieR Online Data Catalog, 2311, 0
- D’Angelo et al. (2003) D’Angelo, G., Henning, T., & Kley, W. 2003, ApJ, 599, 548
- Draine & Lee (1984) Draine, B. T., & Lee, H. M. 1984, ApJ, 285, 89
- Espaillat et al. (2010) Espaillat, C., D’Alessio, P., Hernández, J., et al. 2010, ApJ, 717, 441
- Evans et al. (2009) Evans, N. J., II, Dunham, M. M., Jørgensen, J. K., et al. 2009, ApJS, 181, 321
- Fedele et al. (2010) Fedele, D., van den Ancker, M. E., Henning, T., Jayawardhana, R., & Oliveira, J. M. 2010, A&A, 510, A72
- Hara et al. (1999) Hara, A., Tachihara, K., Mizuno, A., et al. 1999, PASJ, 51, 895
- Harris et al. (2012) Harris, R. J., Andrews, S. M., Wilner, D. J., & Kraus, A. L. 2012, ApJ, 751, 115
- Hashimoto et al. (2011) Hashimoto, J., Tamura, M., Muto, T., et al. 2011, ApJ, 729, L17
- Hashimoto et al. (2012) Hashimoto, J., Dong, R., Kudo, T., et al. 2012, ApJ, 758, L19
- Hayano et al. (2004) Hayano, Y., Saito, Y., Saito, N., et al. 2004, Proc. SPIE, 5490, 1088
- Hayashi (1981) Hayashi, C. 1981, Progress of Theoretical Physics Supplement, 70, 35
- Ho et al. (2004) Ho, P. T. P., Moran, J. M., & Lo, K. Y. 2004, ApJ, 616, L1
- Hughes et al. (1994) Hughes, J., Hartigan, P., Krautter, J., & Kelemen, J. 1994, AJ, 108, 1071
- Hughes et al. (2008) Hughes, A. M., Wilner, D. J., Qi, C., & Hogerheijde, M. R. 2008, ApJ, 678, 1119
- Hughes et al. (2009) Hughes, A. M., Andrews, S. M., Espaillat, C., et al. 2009, ApJ, 698, 131
- Infrared Astronomical Satellite (IRAS) Infrared Astronomical Satellite (IRAS) Catalogs 2007, VizieR Online Data Catalog, 2274, 0
- Irvine et al. (1985) Irvine, W. M., Schloerb, F. P., Hjalmarson, A., & Herbst, E. 1985, Protostars and Planets II, 579
- Isella et al. (2010) Isella, A., Natta, A., Wilner, D., Carpenter, J. M., & Testi, L. 2010, ApJ, 725, 1735
- Isella et al. (2012) Isella, A., Pérez, L. M., & Carpenter, J. M. 2012, ApJ, 747, 136
- Kawabe et al. (2014) Kawabe, R., et al. 2014, in prep.
- Kitamura et al. (1993) Kitamura, Y., Omodaka, T., Kawabe, R., Yamashita, T., & Handa, T. 1993, PASJ, 45, L27
- Kitamura et al. (2002) Kitamura, Y., Momose, M., Yokogawa, S., et al. 2002, ApJ, 581, 357
- Kraus et al. (2012) Kraus, A. L., Ireland, M. J., Hillenbrand, L. A., & Martinache, F. 2012, ApJ, 745, 19
- Kusakabe et al. (2012) Kusakabe, N., Grady, C. A., Sitko, M. L., et al. 2012, ApJ, 753, 153
- Lada & Wilking (1984) Lada, C. J., & Wilking, B. A. 1984, ApJ, 287, 610
- Lada (1987) Lada, C. J. 1987, Star Forming Regions, 115, 1
- Mathews et al. (2012) Mathews, G. S., Williams, J. P., & Ménard, F. 2012, ApJ, 753, 59
- Mayama et al. (2012) Mayama, S., Hashimoto, J., Muto, T., et al. 2012, ApJ, 760, L26
- McCabe et al. (2002) McCabe, C., Duchêne, G., & Ghez, A. M. 2002, ApJ, 575, 974
- Melo (2003) Melo, C. H. F. 2003, A&A, 410, 269
- Merín et al. (2010) Merín, B., Brown, J. M., Oliveira, I., et al. 2010, ApJ, 718, 1200
- Miyake & Nakagawa (1993) Miyake, K., & Nakagawa, Y. 1993, Icarus, 106, 20
- Muto et al. (2012) Muto, T., Grady, C. A., Hashimoto, J., et al. 2012, ApJ, 748, L22
- Nuernberger et al. (1997) Nuernberger, D., Chini, R., & Zinnecker, H. 1997, A&A, 324, 1036
- Panić et al. (2009) Panić, O., Hogerheijde, M. R., Wilner, D., & Qi, C. 2009, A&A, 501, 269
- Romero et al. (2012) Romero, G. A., Schreiber, M. R., Cieza, L. A., et al. 2012, ApJ, 749, 79
- Roeser et al. (2010) Roeser, S., Demleitner, M., & Schilbach, E. 2010, AJ, 139, 2440
- Schloerb & Snell (1984) Schloerb, F. P., & Snell, R. L. 1984, ApJ, 283, 129
- Strom et al. (1989) Strom, K. M., Strom, S. E., Edwards, S., Cabrit, S., & Skrutskie, M. F. 1989, AJ, 97, 1451
- Tamura et al. (2006) Tamura, M., Hodapp, K., Takami, H., et al. 2006, Proc. SPIE, 6269, 62690V
- Tamura (2009) Tamura, M. 2009, in AIP Conf. Proc. 1158, Exoplanets and Disks: Their Formation and Diversity, ed. T. Usuda, M. Tamura, & M. Ishii (Melville, NY: AIP), 11
- Tanigawa et al. (2012) Tanigawa, T., Ohtsuki, K., & Machida, M. N. 2012, ApJ, 747, 47
- Tanii et al. (2012) Tanii, R., Itoh, Y., Kudo, T., et al. 2012, PASJ, 64, 124
- Thalmann et al. (2010) Thalmann, C., Grady, C. A., Goto, M., et al. 2010, ApJ, 718, L87
- Tsukagoshi et al. (2011) Tsukagoshi, T., Saito, M., Kitamura, Y., et al. 2011, ApJ, 726, 45
- van der Marel et al. (2013) van der Marel, N., van Dishoeck, E. F., Bruderer, S., et al. 2013, Science, 340, 1199
- Vilas-Boas et al. (2000) Vilas-Boas, J. W. S., Myers, P. C., & Fuller, G. A. 2000, ApJ, 532, 1038
- Yamamura et al. (2010) Yamamura, I., Makiuti, S., Ikeda, N., et al. 2010, VizieR Online Data Catalog, 2298, 0
- Wolf & D’Angelo (2005) Wolf, S., & D’Angelo, G. 2005, ApJ, 619, 1114
- Zacharias et al. (2005) Zacharias, N., Monet, D. G., Levine, S. E., Urban, S. E., Gaume, R., & Wycoff, G. L. 2005, VizieR Online Data Catalog, 1297, 0