Nanocrystal Energetics via Quantum Similarity Measures
Abstract
We first develop a descriptor-based representation of atomic environments by devising two local similarity indices defined from an atom-partitioned quantum-chemical descriptor. Then we employ this representation to explore the size-, shape-, and composition-dependent nanocrystal energetics. For this purpose we utilize an energy difference that is related to the atomic chemical potential, which enables one to characterize energetic heterogeneities. Employing first-principles calculations based on the density functional theory for a set of database systems, viz. unary atomic clusters in the shape of regular polyhedra and the bulk solids of C, Si, Pd, and Pt, we explore the correlations between the energy difference and similarity indices. We find that there exists an interconnection between nanocrystal energetics and quantum similarity measures. Accordingly we develop a means for computing total energy differences from the similarity indices via interpolation, and utilize a test set comprising a variety of unary nanocrystals and binary nanoalloys/nanocompounds for validation. Our findings indicate that the similarity-based energies could be utilized in computer-aided design of nanoparticles.
1 Introduction
Nanoparticles exhibit chemical and structural inhomogeneities insomuch as they appear in various morphologies, regardless of the production method used[1, 2, 3]. Even a well-crystallized nanoparticle with a well-defined polyhedral shape consists of low-coordinated surface atoms that are obviously dissimilar to high-coordinated (bulk-like) atoms. One recognizes immediately by inspection that the bulk-like atoms have indeed a local (bonding) environment that resembles the bulk solid whereas the surface atoms along the edges or at the corners have similarities with the atoms of atomic clusters in regard to bonding and local coordination. Utilizing these similarities (or dissimilarities) in elucidating the properties of nanoparticles would be rewarding since one could then employ similarity search methods[4, 5, 6] in computer-aided design of nanoparticles with customized properties. We should like to complement this consideration by noting that similarity measures/indices[7, 8, 9] based on quantum-chemical descriptors[10, 11, 12] have long been available, which proved to be promising in carrying out various tasks related to a multitude of physicochemical phenomena, such as comparing properties and reactivities of different molecular systems[13], deriving quantitative structure-activity or -property relationships[14, 15], and identification of the active molecular sites[16]. Clearly these efforts demonstrate the utility of the similarity-based analysis in molecular design[17]. On the other hand, the structure and/or properties of nanoparticles have never been explored via the notion of the (quantum) similarity. This is, in our opinion, due to lacking a complete[18] similarity-based representation of atomic environments, which furnishes an adequate description for the nanoparticle atoms. The present study is thus devoted to fulfill an objective along this line: First, we develop a descriptor-based representation of atomic environments by devising two local similarity indices that are defined from the atom-partitioned[19, 20] shape function[21, 22, 23] , where and denote the electronic density function and number of electrons, respectively. Then, we employ this representation to explore the size-, shape-, and composition-dependent nanocrystal energetics via the notion of quantum similarity. We focus on an energy difference , which is related to the atomic chemical potential, for its utility in the modelling and simulation of nanoparticles[24, 25]. This energy difference and the local similarity indices were obtained by performing first-principles calculations based on the density functional theory (DFT) for (i) a set of database systems including unary atomic clusters in the shape of regular polyhedra and the bulk solids of C, Si, Pd, and Pt, and (ii) a test set for validation, which includes a variety of unary nanocrystals as well as binary Pt-Pt nanoalloys and Pt-C nanocompounds. Regarding the energy difference as a “property” and exploring its correlations with the local similarity indices, we find that there exists an interconnection between nanocrystal energetics and quantum similarity measures. Furthermore, we introduce an interpolation procedure in order to obtain total energies and energy differences from the two similarity indices. The latter enables us to demonstrate that the similarity-based energies could be utilized in computer-aided design of nanoparticles.
Although one of the similarity indices (denoted by below) employed in this study is of the same form as the local Carbó index[7, 8, 12], we find it necessary to introduce a second similarity index (denoted by below) in order to achieve an adequate chemical representation. Our findings reveal that using a single similarity index, cf. , leads to a bijection between and if and only if the set of systems are restricted to include equilibrium structures. This has the obvious drawback that it requires a priori knowledge of the equilibrium geometries. Thus we find the introduction of a second similarity index necessary, which enables us to extend the aforementioned bijection to cover a generalized set of systems, including strained (compressed or dilated) systems. Hence the foregoing drawback is overcome by using two similarity indices with adequately tailored functional forms given below. It should be emphasized that this approach makes a similarity-based representation of the potential energy surfaces[26] accessible thanks to the inclusion of the strained systems, which facilitates an adequate description of physicochemical processes.
The rest of the paper is organized as follows: The next section is devoted to the methodological aspects which also summarizes the computational details. This is followed by a discussion of the calculation results before concluding remarks given in the last section.
2 Methodology
In this section we first define the energy difference and the similarity indices that constitute the employed chemical representation. We then describe (i) the set of database systems that are used to construct a database for the purpose of exploring correlations between energy differences and local similarity indices, and (ii) the test set employed for validation. Next we introduce an ad hoc interpolation procedure that enables one to compute the similarity-based energy differences and total energies. We finalize this section with a description of our computational modelling framework.
2.1 Energy differences
The aforementioned energy difference is defined by
| (1) |
where is the number of atoms in the system under consideration, is the DFT-calculated energy per atom for the system with the nearest-neighbor distance , is the DFT-calculated energy per atom for the bulk solid with the equilibrium nearest-neighbor distance corresponding to the minimum of the total energy, and denotes the negative of the measured[27] heat of atomization for the bulk solid. It is useful to define for the equilibrium value of the nearest-neighbor distance. Note that would be equal to the atomic chemical potential at zero temperature () for a unary system if the zero of energy is set to the energy of the atom, i.e., . Recent investigations[24, 25] by one of the present authors have indicated that the energy difference could be utilized to introduce a scale of energy on which small (less stable, more reactive) and large (more stable, less reactive) nanocrystals are naturally ordered near the higher () and lower () ends of the scale, respectively.
2.2 Local similarity indices
In the present study, the isolated (free) atom is employed as a reference system for each atomic species: namely, the free C, Si, Pd, or Pt atoms are used as a reference for the C, Si, Pd, or Pt atoms in any system, viz. atomic clusters, bulk solids, or nanocrystals, respectively. This is advantageous for computational efficiency and avoids the need for an alignment[28, 29, 30] procedure. It implies that the similarity of an atom of a certain type in a system is measured with respect to the free atom of the same type, regardless of the type of the system (atomic cluster, bulk solid, or nanocrystal). The local (atom-partitioned) Carbó index, which here serves as an indicator of similarity of an atom , located at , of type in the system under consideration to the free atom, could then be expressed as
| (2) |
where and denote the shape function of the system under consideration and free atom, respectively. The use of the Hirsfeld partitioning[19, 20] function in equation (2) is encouraged[12] by the holographic electron density theorem[8]. Here denotes the electron density of the isolated atom located at point , and is the promolecular electron density. As explained above, using does not suffice for obtaining a full-fledged representation of atomic environments. Thus we introduce a second indicator of local similarity given by
| (3) |
As explained below, the introduction of enables one to treat energetic trends when the variations with the interatomic distance are taken into account. Note that if the system itself is the free atom.
2.3 The set of database systems
In this study, first-principles calculations are employed for building a database that comprises and (,) values for the unary atomic clusters in the shape of Platonic or Archimedean solids. In addition to these regular polyhedra, dimers C2, Si2, Pd2, and Pt2, and the bulk solids of C, Si, Pd, and Pt are included in this database. It should be emphasized that not only equilibrium systems () but also compressed or dilated systems ( or ) are included in this set. The systems in this set are called here database systems for ease of speech, which are thoroughly used for the purpose of exploring the correlations between the and or values. That the set of database systems comprise only equivalent atoms makes it possible to set in equation (1), where denotes the DFT-calculated total energy. For each database system, plotting values as a function of yields a convex curve that could accurately be parameterized, as demonstrated below. Accordingly, for a given database system , the energy difference defined in equation (1) is represented by where denotes a polynomial function of forth order (whose coefficients are determined by fitting to the DFT-calculated values). It is found that one must employ a distinct function with a unique set of polynomial coefficients for each system. Thus the relationships are tabulated for all database systems with C, Si, Pd, Pt in tables 1-4 in Supplementary Data.
2.4 Test set
As mentioned above, a variety of nanocrystals are utilized as test systems for the purpose of validation, which exhibit structural inhomogeneity owing to the presence of a number of inequivalent atoms. This test set is designed to cover a variety of nanocrystal sizes and shapes as well as a range of nanoalloy compositions with various mixing patterns. Thus a number of unary C, Si, Pd, or Pt nanocrystals (Supplementary Data, table 5), uniformly mixed (Supplementary Data, table 6), core-shell segregated (Supplementary Data, table 7), and phase separated (Supplementary Data, table 8) Pt-Pd nanoalloys, and Pt-C nanocompounds (Supplementary Data, table 9) are contained in the test set. In practice, the atoms of the test systems were constrained to occupy the diamond (C and Si nanocrystals), fcc (Pd and Pt nanocrystals and Pt-Pd nanoalloys), and zinc-blende (Pt-C nanocompounds) lattice sites. It should be mentioned that platinum carbide nanocrystals are considered here only for the purpose of studying some challenging systems since the bonding characteristics of platinum carbide, which was synthesized[31] for the first time in 2005 under extreme conditions via a high-pressure and high-temperature method in a diamond anvil cell with laser heating, is peculiar owing to the mixed covalent-ionic-metallic[32] interatomic interactions.
2.5 Interpolation procedure
With the aid of tabulated relationships (Supplementary Data, tables 1-4), the energies of the test systems are obtained according to the following procedure: The contribution to the energy by the atom of a test system is obtained, via interpolation, by
| (4) | |||||
| (5) |
where denotes the interpolation coefficients, and is the label for database systems (whereas denotes atoms of the test system under consideration). Performing a sum over yields a similarity-based total energy difference
| (6) |
Note that should be compared to a DFT-calculated total energy difference given by
| (7) |
for a nanoalloy/nanocompound made of A and B atoms, owing to the inclusion of and in the definition of , cf. equation (1). One obviously needs to set in equation (7) for a unary nanocrystal made of A atoms.
2.6 Computational details
The DFT-calculated energies employed in equations (1) and (7) as well as shape functions employed in equations (2) and (3) were obtained within the generalized gradient approximation (GGA) using the PBE exchange correlation potential[33], and employing the projector augmented-wave (PAW) method[34], as implemented in VASP code[35, 36, 37]. Spin-polarization was taken into account and scalar relativistic effects were included in all calculations. The 2 and 2, 3 and 3, 4 and 5, and 5 and 6 states are treated as valence states for carbon, silicon, palladium, and platinum, respectively. Plane wave basis sets were used to represent the electronic states, which were determined by imposing a kinetic energy cutoff of 400, 245, 250, and 230 eV for C, Si, Pd, and Pt, respectively. Primitive and/or conventional unit cells were used in the calculations for the bulk solids, viz. C and Si in the diamond structure and Pd and Pt in the face-centered-cubic (fcc) structure, whose Brillouin zones were sampled by fine k-point meshes generated according to Monkhorst-Pack scheme[38], ensuring convergence with respect to the number of k-points. A variety of cubic supercells with a side length in the range 15–30 Å were used for the atomic clusters and nanocrystals, which included a vacuum region that put at least 10 Å distance between nearest atoms of two systems in neighboring supercells. Only -point was used for Brillouin zone sampling in the case of the cluster or nanocrystal supercells. The error bar for the energy convergence was on the order of 1 meV/atom in all calculations.
The overlap integrals employed in equations (2) and (3) were evaluated via an adaptive multidimensional integration routine[39] within a spherical region about the atomic centers in real space. For efficiency in computing the integrands in equations (2) and (3), spline interpolations[40] of the electron density functions and were performed using the three-dimensional gridded data written by VASP. The integration region for any atom was imposed by setting the integrands to zero at every point where e/Å3. That this approach yields sufficiently accurate results was checked by computing the normalization integrals such as and also the integrals such as which should yield for the atomic clusters in the shape of Platonic or Archimedean solids. For infinite systems such as bulk solids (for which the shape function is zero everywhere but normalized to unity[22]) one could still apply this approach thanks to the inclusion of the denominator terms in equations (2) and (3), and spatial localization imposed by the partitioning function . It was, however, required to use a sufficiently large supercell in which the region of integration is well confined. Furthermore, it was found that the integrals of the types and show slow convergence with respect to the supercell size whereas the ratio converges rather quickly. Hence sufficiently large supercells were used in the computation of and for the bulk solids, and it was confirmed that the computed values of and are independent of the size of the employed supercells.
3 Results and Discussion
In this section we first investigate the correlations between the energy difference and local (atom-partitioned) Carbó index. We then explore the aforementioned interconnection between energetics and quantum similarity indices. Next we employ the interpolation procedure developed in the preceding section in order to devise a means for characterizing energetic heterogeneity of nanoparticles. Finally we expound the similarity-based approach developed here by comparing the similarity-based energies to DFT-calculated energies for a number of unary C, Si, Pd, or Pt nanocrystals, uniformly mixed, core-shell segregated, and phase separated Pt-Pd nanoalloys, and Pt-C nanocompounds, cf. the test set.
3.1 Correlations between energy differences and similarity indices
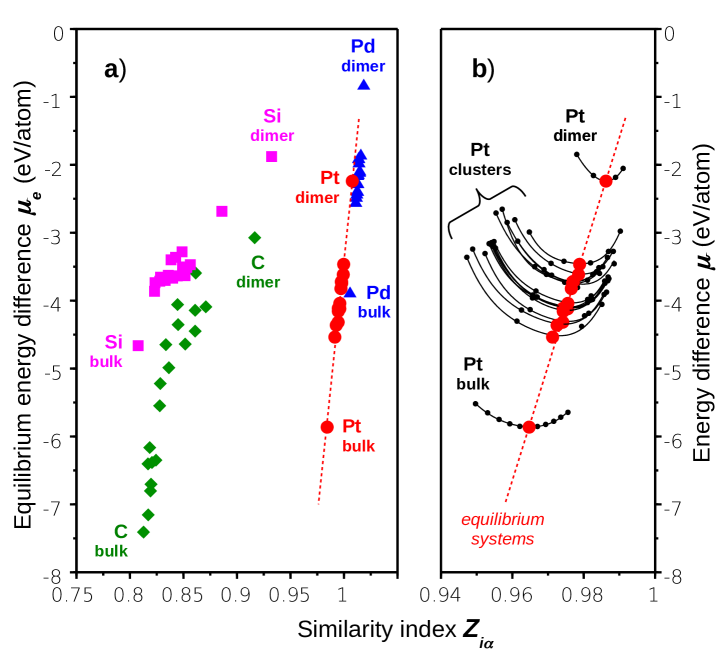
The plot of the equilibrium energy difference versus the local Carbó index is displayed in figure 1(a). It is noticeable that there exists a correlation between and , which appears to be a distinct relationship for each atomic species. Note that the correlation is seemingly linear for the Pd and Pt systems (as marked by the dashed line passing through the set of Pt systems). Furthermore, it is seen that the set of Pd and Pt systems are grouped, i.e., they fall nearly on the same line. For the Si systems the correlation could also be regarded approximately linear whereas the points for the C systems fall on a monotonic curve that is not linear and show a more pronounced scatter. Yet, overall, there seems to exist a roughly one-to-one correspondence, i.e., bijection, between the equilibrium energy difference and , regardless of the atomic species. This implies that the variety of local environments sampled by the database systems are adequately reflected by the atom-partitioned Carbó index. On one hand, this finding implying that a single number, viz. , per atom (as opposed to a function of space) suffices to capture energetics trends is striking in the view of the holographic electron density theorem[8] which applies to the local electronic ground state density, i.e., a function of space restricted to some region (as opposed to a number). It could, on the other hand, be expounded by noting that similar atoms (viz. atoms with close values) would exhibit similar energetic stability (as indicated by close values).
3.2 Energetics-similarity interconnection
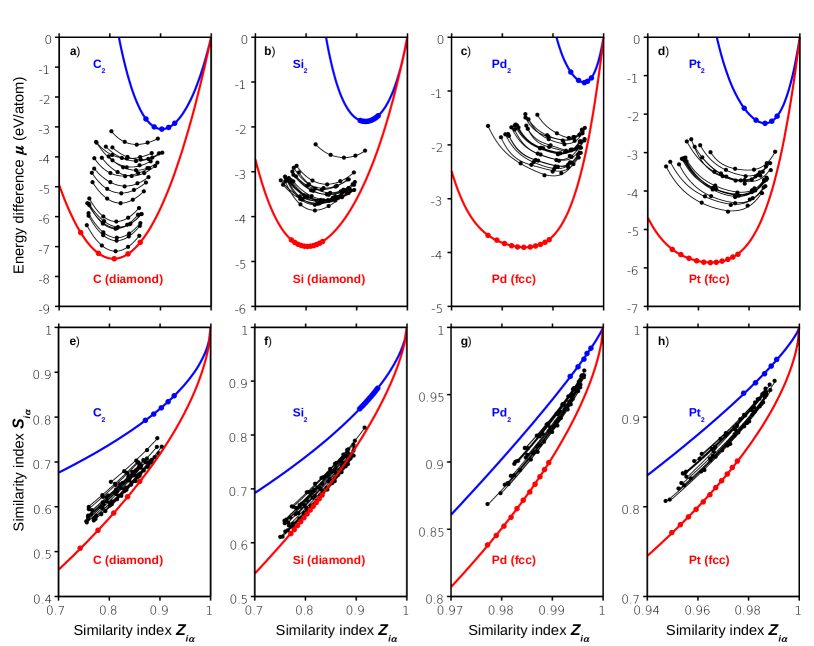
It is obviously interesting to see if the preceding analysis for the unstrained systems could as well be applied to the (negatively or positively) strained systems, i.e., if one could introduce a generalized - relationship. Thus the plot of the energy difference versus the atom-partitioned Carbó index is drawn in figure 1(b) for the Pt systems, where the small (large) circles represents strained (equilibrium) systems. Note that the large solid (red) circles as well as the (red) dashed lines on both panels of figure 1 are identical. The small (black) circles represent the DFT-calculated (,) values. It is seen that the (,) points fall on a distinct convex curve (represented by solid lines) for each system. This observation is of practical significance, which makes it possible to parameterize as a function of . In practice, this parameterization was carried out by using a distinct polynomial function with a unique set of polynomial coefficients {} for each system , yielding the solid-line curves given in figure 1(b), which are obtained via fitting to the DFT-calculated points. Repeating the same procedure for the C, Si, and Pd systems results in the - curves given in the top panels of figure 2 where, for each atomic species, the curves for the atomic clusters lay necessarily between the curves for the dimer and bulk solid. On the other hand, despite the utility of the - parameterization, there exists now no one-to-one correspondence between the energy difference and the atom-partitioned Carbó index, i.e., a given value of does not correspond to a unique database system. Thus one can utilize the atom-partitioned Carbó index as a measure of similarity only for equilibrium systems. This, however, require a priori knowledge of the interatomic distances {}; in other words, the equilibrium geometries. As mentioned above, this limitation is lifted by devising a second indicator of local similarity given in equation (3). Note that one would in principle need to use the local electronic ground state density[8] rather than numeric value of an integral of it, viz. , in order to differentiate closely-related systems, cf. the holographic electron density theorem. Our analysis reveals that a pair of local similarity indices constitute an adequate chemical representation adopted here since a single similarity index fails to reflect energetic trends once the variations with the interatomic distance are taken into account. The bottom panels of figure 2 show the plot of versus for the database systems. Although the two similarity indices are not genuinely independent of each other, cf. equations (2) and (3), the - curves appear to be distinct for each system. Furthermore all curves lie in the same region bounded by the dimer curve acting as an upper bound and the curve for the bulk solid, which serves as a lower bound. Interestingly, one could make the same observation in the top panels of figure 2, where all the - curves are also bounded by the dimer and bulk curves. Thus the - curves and the - curves are roughly ordered in a similar fashion. This finding encourages one to utilize the second similarity index (in combination with the local Carbó index) to establish a bijection between the energy differences and similarity indices. The latter is achieved by employing the ad hoc interpolation formula given in equation (5), which enables one to obtain the contribution of atom to the similarity-based total energy difference from the similarity indices .
3.3 Means for characterizing energetic inhomogeneity
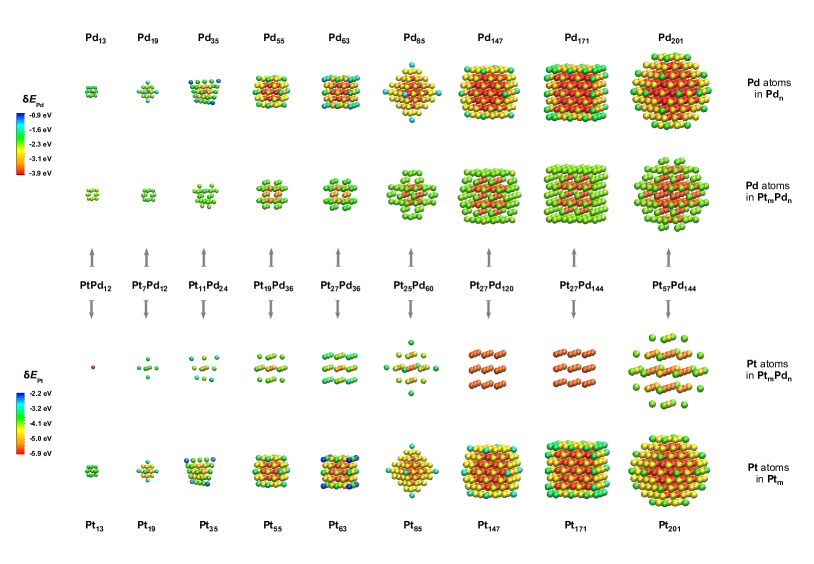
Figure 3 displays color-coded graphs of values for a series of Pd nanocrystals (top graphs), Pt-Pd nanoalloys (middle graphs) and Pt nanocrystals (bottom graphs). The scales on the left hand side represent the range for the computed values of for Pd atoms (top scale) and Pt atoms (bottom scale). The higher end (blue) of these scales corresponds to less stable (more reactive) atoms while the lower end (red) corresponds to more stable (less reactive) atoms. It is encouraging to see that the bulk-like atoms near to the center of a nanocrystal have and values around the lower end whereas and values are considerably higher for the low-coordinated atoms located on the faces, along the edges, or at the corners. Thus using the values facilitates the characterization of the energetic (site-specific, morphology-dependent) inhomogeneity of the nanocrystals. Moreover energetics trends in regard to the size-dependence appears to be reasonable as one approach bulk-like energies in going from small to large nanocrystals. Besides using the set of or values enables one to look into local (e.g., site-specific) mixing of - and -type atoms in a binary alloy formation. For example, comparative inspection of Pt35, Pt11Pd24, and Pd35 in figure 3 shows that the Pt atoms at the corners of Pt11Pd24 are less energetic in comparison those of Pt35, indicating that alloying Pt nanocrystal with Pd increases the energetic stability of the corner (Pt) atoms. Since a similar analysis could be applied to any nanocrystal in a site-specific manner, using the set of values would clearly be useful in elucidating trends in the size-, shape- and composition-dependent nanocrystal energetics.
3.4 Similarity-based energies
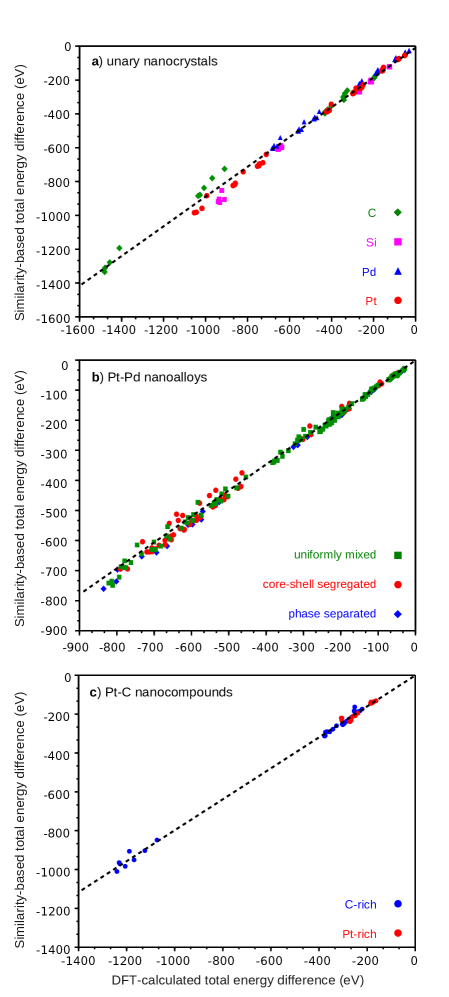
Performing a sum over atoms as in equation (6) enables one to obtain from the set of the atomic contributions , cf. figure 3. It is then crucial to inquire if could be utilized in lieu of (calculated directly) for practical purposes, e.g., in the computer-aided design of nanocrystals. Thus the plot of versus is drawn for the test systems in figure 4 where the calculation results are included for a variety of nanocrystal sizes and shapes as well as a range of alloy/compound compositions with various mixing patterns. Accordingly the upper, middle, and lower panels of figure 4 are devoted to the unary (C, Si, Pd, or Pt) nanocrystals, the Pt-Pd nanoalloys, the Pt-C nanocompounds, respectively. Not only unstrained but also negatively or positively strained systems are included in these panels. Here strained systems are characterized by the value of the interatomic distance which is varied in the range of [1.37,1.55] Å for the C nanocrystals, [2.20,2.45] Å for the Si nanocrystals, [2.57,3.11] Å for the Pd nanocrystals, [2.57,2.91] Å for the Pt nanocrystals, [2.55,3.12] Å for the Pt-Pd nanoalloys, [1.90,2.25] Å for the Pt-C nanocompounds. A power-law regression analysis on the points marked by the filled symbols, which ensures that as , results in the dashed lines shown in the panels of figure 4, which is given by
| (8) |
where both and are in eV, and the coefficients , the exponents , and the error bars are listed in table 1. Note that the closeness of the values of and to unity (in association with a small ) indicates that would follow the same energetics trends as . On the other hand, having either or smaller than unity is an indication that the similarity-based interpolation procedure results in underestimation. The latter turns out to be the case as revealed by inspection of the slopes of the dashed lines in figure 4 as well as the entries of table 1. Yet the standard deviation is relatively small, i.e. on the order of 5% in all cases, i.e., not only for the unary nanocrystals but also for the Pt-Pd nanoalloys and Pt-C nanocompounds. In practice, one could invert equation (8) in order to obtain the total energy differences more accurately for these systems. It should be remarked that this description is not restricted to equilibrium configurations since a relatively wide range of interatomic distances are considered above. Hence, portions of the potential energy surfaces of the nanocrystals are rendered accessible. Further analysis reveals that the scatter of the points about the regression line is much less pronounced for slightly strained systems whereas significantly larger for the highly compressed systems. One should consequently recognize that the similarity-based approach exemplified here would be more suitable in describing a portion of the potential energy surface that is in the vicinity of equilibrium, availability of which is clearly of great service in a multitude of design problems.
| (%) | |||
|---|---|---|---|
| Unary nanocrystals | 1.015 | 0.981 | 5.9 |
| Pt-Pd nanoalloys | 0.929 | 0.989 | 5.9 |
| Pt-C nanocompounds | 0.775 | 1.005 | 4.3 |
It should be emphasized that for a test system is truly obtained by use of the (quantum) similarity of its atoms to the atoms of the database systems. Recall that no member of the test set has been included in the fitting of the tabulated relationships and the database systems are all unary systems. It is thus remarkable that the similarity-based description of the energetics of binary nanoalloys is almost as good as that of unary nanocrystals as seen by comparing figure 4(b) to figure 4(a). The energetics of Pt-C nanocompounds constitute a greater challenge as evidenced by the relatively large deviation of the coefficient from unity, yet the correlation between and for these systems is also significant, cf. figure 4(c), with a standard deviation . The latter gives evidence for the ubiquitous utility of the similarity-based approach developed here since the bonding characteristics of platinum carbide is peculiar[32] owing to the mixed covalent-ionic-metallic interatomic interactions.
4 Conclusion
The results of the present investigation show that there exists an interconnection between the energy differences utilized in the modelling and simulation of nanocrystals and the quantum similarity measures, which is established here by devising two local similarity indices given in equations (2) and (3). We show that this finding leads to the development of a new approach for computing the energy differences and total energies, which is based on the similarity of the nanocrystal atoms to the atoms of a set of database systems. We find that the similarity-based energy differences exhibit the same trends as those obtained directly from the DFT calculations. Subsequently, it is demonstrated that our similarity-based approach could be used to explore the size-, shape- and composition-dependent nanocrystal energetics. It should be remarked that no knowledge of the equilibrium geometries is needed a priori in this approach since it is sufficiently general to cover non-equilibrium configurations. In particular, it is intriguing that the similarity-based description of energetics of the binary systems is nearly as good as that of unary systems -albeit no binary systems are included among the database systems. Furthermore, it is demonstrated that our similarity-based approach provides a means for characterizing the energetic inhomogeneity of the nanocrystals, cf. figure 3. Accordingly, we project that the methodology of this paper would be of great service in informatics-driven approaches, i.e. materials informatics[41]. Besides, we anticipate that the similarity-based approach presented here could be generalized to explore other physicochemical quantities, e.g. (site-specific) adsorption energies, and could then be utilized in the surface engineering of nanocrystals.
References
References
- [1] Trindade T, O’Brien P and Pickett NL 2001 Nanocrystalline semiconductors: Synthesis, properties and perspectives Chem. Mat. 13 3843–3858
- [2] Ferrando R, Jellinek J and Johnston RL 2008 Nanoalloys: From theory to applications of alloy clusters and nanoparticles Chem. Rev. 108 845–910
- [3] Xia Y, Xiong Y, Lim B and Skrabalak SE 2009 Shape-controlled synthesis of metal nanocrystals: Simple chemistry meets complex physics? Angew. Chem.-Int. Edit. 48 60–103
- [4] Willett P, Barnard JM and Downs GM 1998 Chemical similarity searching J. Chem. Inf. Comput. Sci. 38 983–996
- [5] Sheridan RP and Kearsley SK 2002 Why do we need so many chemical similarity search methods? Drug Discov. Today 7 903–911
- [6] Engel T 2006 Basic overview of chemoinformatics J. Chem. Inf. Model. 46 2267–2277
- [7] Carbó R, Leyda L and Arnau M 1980 How similar is a molecule to another - an electron-density measure of similarity between 2 molecular-structures Int. J. Quant. Chem. 17 1185–1189
- [8] Mezey PG 1999 The holographic electron density theorem and quantum similarity measures Mol. Phys. 96 169–178
- [9] Chermette H 1999 Chemical reactivity indexes in density functional theory J. Comput. Chem. 20 129–154
- [10] Karelson M, Lobanov VS and Katritzky AR 1996 Quantum-chemical descriptors in QSAR/QSPR studies Chem. Rev. 96 1027–1043
- [11] Bultinck P and Carbó-Dorca R 2005 Molecular quantum similarity using conceptual DFT descriptors J. Chem. Sci. 117 425–435
- [12] Geerlings P, Boon G, Van Alsenoy C and De Proft F 2005 Density functional theory and quantum similarity Int. J. Quant. Chem. 101 722–732
- [13] Boon G, Langenaeker W, De Proft F, De Winter H, Tollenaere JP and Geerlings P 2001 Systematic study of the quality of various quantum similarity descriptors. Use of the autocorrelation function and principal component analysis J. Phys. Chem. A 105 8805–8814
- [14] Good AC, Peterson SJ and Richards WG 1993 QSARs from similarity-matrices - technique validation and application in the comparison of different similarity evaluation methods J. Med. Chem. 36 2929–2937
- [15] Besalú E, Girones X, Amat L and Carbó-Dorca R 2002 Molecular quantum similarity and the fundamentals of QSAR Accounts Chem. Res. 35 289–295
- [16] Amat L, Besalú E, Carbó-Dorca R and Ponec R 2001 Identification of active molecular sites using quantum-self-similarity measures. J. Chem. Inform. Comput. Sci. 41 978–991
- [17] Rouvray DH 1992 Definition and role of similarity concepts in the chemical and physical sciences J. Chem. Inf. Comput. Sci. 32 580–586
- [18] Bartók AP, Kondor R and Csányi G 2013 On representing chemical environments Phys. Rev. B 87 184115
- [19] Hirshfeld FL 1977 Bonded-atom fragments for describing molecular charge-densities Theor. Chem. Acc. 44 129–138
- [20] De Proft F, Vivas-Reyes R, Peeters A, Van Alsenoy C and Geerlings P 2003 Hirshfeld partitioning of the electron density: Atomic dipoles and their relation with functional group properties J. Comput. Chem. 24 463–469
- [21] Parr RG and Bartolotti LJ 1983 Some remarks on the density functional theory of few-electron systems J. Phys. Chem. 87 2810–2815
- [22] Ayers PW 2000 Density per particle as a descriptor of Coulombic systems Proc. Natl. Acad. Sci. USA 97 1959–1964
- [23] De Proft F, Ayers PW, Sen KD and Geerlings P 2004 On the importance of the “density per particle” (shape function) in the density functional theory J. Chem. Phys. 120 9969-9973
- [24] Kılıç Ç 2010 Size- and shape-dependent energetics of transition-metal nanocrystals Solid State Commun. 150 2333–2336
- [25] Kılıç Ç 2011 Energy-distance relation for fcc transition metal nanocrystals EPL 93 26004
- [26] Behler J 2011 Neural network potential-energy surfaces in chemistry: a tool for large-scale simulations Phys. Chem. Chem. Phys. 13 17930–17955
- [27] Lide D 2008 CRC handbook of chemistry and physics : a ready-reference book of chemical and physical data (Boca Raton, FL: CRC)
- [28] Parretti MF, Kroemer RT, Rothman JH and Richards WG 1997 Alignment of molecules by the monte carlo optimization of molecular similarity indices J. Comput. Chem. 18 1344–1353
- [29] Bultinck P, Kuppens T, Gironés X and Carbó-Dorca R 2003 Quantum similarity superposition algorithm (QSSA): A consistent scheme for molecular alignment and molecular similarity based on quantum chemistry J. Chem. Inf. Comput. Sci. 43 1143–1150
- [30] Bultinck P, Carbó-Dorca R and Van Alsenoy C 2003 Quality of approximate electron densities and internal consistency of molecular alignment algorithms in molecular quantum similarity J. Chem. Inform. Comput. Sci. 43 1208–1217
- [31] Ono S, Kikegawa T and Ohishi Y 2005 A high-pressure and high-temperature synthesis of platinum carbide Solid State Commun. 133 55–59
- [32] Ivanovskii AL 2009 Platinum group metal nitrides and carbides: synthesis, properties and simulation Russ. Chem. Rev. 78 303–318
- [33] Perdew JP, Burke K and Ernzerhof M 1996 Generalized gradient approximation made simple Phys. Rev. Lett. 77 3865–3868
- [34] Blochl PE 1994 Projector augmented-wave method Phys. Rev. B 50 17953–17979
- [35] Kresse G and Fürthmuller J 1996 Efficiency of ab-initio total energy calculations for metals and semiconductors using a plane-wave basis set Comput. Mater. Sci. 6 15–50
- [36] Kresse G and Joubert D 1999 From ultrasoft pseudopotentials to the projector augmented-wave method Phys. Rev. B 59 1758–1775
- [37] Sun GY, Kurti J, Rajczy P, Kertesz M, Hafner J and Kresse G 2003 Performance of the Vienna ab initio simulation package (VASP) in chemical applications J. Mol. Struct. - THEOCHEM 624 37–45
- [38] Monkhorst HJ and Pack JD 1976 Special points for brillouin-zone integrations Phys. Rev. B 13 5188–5192
- [39] Berntsen J, Espelid TO and Genz A 1991 Algorithm 698: Dcuhre: an adaptive multidemensional integration routine for a vector of integrals ACM Trans. Math. Softw. 17 452–456
- [40] Boor C 2001 A practical guide to splines (New York: Springer)
- [41] Rajan K 2005 Materials informatics Mater. Today 8 38–45
5 Supplementary Data
| Dimer | -3.073 | -0.020 | 317.605 | -662.128 | 7537.589 |
|---|---|---|---|---|---|
| Tetrahedron | -3.585 | -0.243 | 131.127 | -681.23 | 6174.054 |
| Octahedron | -4.448 | -0.095 | 142.577 | -87.009 | 3321.910 |
| Cube | -5.212 | -0.223 | 166.607 | -491.447 | 2717.141 |
| Icosahedron | -4.089 | -0.137 | 117.769 | 60.221 | 4425.848 |
| Dodecahedron | -6.384 | -0.008 | 221.448 | -283.245 | 491.922 |
| Cuboctahedron | -4.335 | -1.519 | 144.830 | -354.519 | 3219.137 |
| Icosidodecahedron | -4.978 | -0.373 | 145.124 | -97.645 | 1514.808 |
| Rhombicosidodecahedron | -4.641 | -0.109 | 125.075 | -684.302 | 4934.909 |
| Rhombicuboctahedron | -4.639 | -0.068 | 159.520 | -129.355 | 2021.972 |
| Snub cube | -4.140 | -0.142 | 122.413 | -7.260 | 3077.307 |
| Snub dodecahedron | -4.056 | -0.205 | 95.873 | -328.335 | 4150.783 |
| Truncated cube | -6.163 | -0.008 | 245.263 | -493.121 | 651.689 |
| Truncated cuboctahedron | -6.704 | -0.003 | 242.436 | -347.009 | 452.461 |
| Truncated dodecahedron | -6.403 | -0.003 | 262.507 | -577.442 | 735.888 |
| Truncated icosahedron | -7.155 | -0.001 | 250.095 | -314.456 | 294.125 |
| Truncated icosidodecahedron | -6.803 | -0.001 | 250.759 | -371.083 | 398.845 |
| Truncated octahedron | -6.346 | -0.146 | 220.742 | -3.372 | -833.696 |
| Truncated tetrahedron | -5.547 | -0.038 | 203.429 | -369.196 | 1140.742 |
| Bulk solid (diamond) | -7.408 | -0.019 | 201.196 | -77.268 | 364.538 |
| Dimer | -1.878 | 0.019 | 199.688 | -304.137 | 14483.305 |
|---|---|---|---|---|---|
| Tetrahedron | -2.682 | -0.164 | 79.253 | 66.414 | 5340.125 |
| Octahedron | -3.510 | -0.127 | 84.063 | -21.272 | 2699.598 |
| Cube | -3.468 | -0.114 | 100.733 | -98.621 | 2757.457 |
| Icosahedron | -3.629 | -0.158 | 76.853 | 30.174 | 2700.339 |
| Dodecahedron | -3.673 | 0.260 | 85.190 | -350.766 | 3664.758 |
| Cuboctahedron | -3.501 | -0.135 | 84.383 | -53.555 | 2500.681 |
| Icosidodecahedron | -3.647 | -0.075 | 92.153 | -126.553 | 2048.645 |
| Rhombicosidodecahedron | -3.622 | -0.183 | 85.326 | -77.365 | 1782.164 |
| Rhombicuboctahedron | -3.636 | -0.018 | 74.042 | -10.420 | 2377.063 |
| Snub cube | -3.702 | -0.06 | 65.252 | -56.723 | 2221.128 |
| Snub dodecahedron | -3.650 | -0.178 | 74.868 | -52.119 | 1598.565 |
| Truncated cube | -3.366 | 0.036 | 92.328 | -439.824 | 3800.469 |
| Truncated cuboctahedron | -3.719 | 0.012 | 118.783 | -526.290 | 2871.248 |
| Truncated dodecahedron | -3.396 | -0.101 | 95.441 | -254.356 | 2349.424 |
| Truncated icosahedron | -3.858 | -0.121 | 139.553 | -682.515 | 3016.681 |
| Truncated icosidodecahedron | -3.732 | -0.133 | 122.766 | -747.689 | 3783.626 |
| Truncated octahedron | -3.654 | -0.040 | 111.444 | -98.950 | 1228.149 |
| Truncated tetrahedron | -3.277 | -0.104 | 95.328 | -198.807 | 2581.799 |
| Bulk solid (diamond) | -4.664 | -0.005 | 132.739 | -349.581 | 1444.348 |
| Dimer | -0.840 | -6.400 | 33311.393 | 3721206.184 | 511101393.400 |
|---|---|---|---|---|---|
| Tetrahedron | -1.873 | -2.569 | 16389.493 | 2770276.589 | 261971715.68 |
| Octahedron | -2.117 | -16.320 | 6705.320 | 2202612.455 | 273801033.220 |
| Cube | -2.099 | -16.802 | 9114.439 | 2498668.588 | 251443464.030 |
| Icosahedron | -2.391 | -16.539 | 5770.537 | 1412107.506 | 134315549.540 |
| Dodecahedron | -2.427 | -16.672 | 7362.723 | 2456123.506 | 341325123.540 |
| Cuboctahedron | -2.279 | -15.448 | 6237.267 | 1335147.165 | 149468839.650 |
| Icosidodecahedron | -2.268 | -13.721 | 6534.375 | 1066636.190 | 116535424.090 |
| Rhombicosidodecahedron | -2.436 | -12.002 | 6829.432 | 1021713.153 | 95175168.583 |
| Rhombicuboctahedron | -2.387 | -14.826 | 5718.681 | 1189598.403 | 121041265.850 |
| Snub cube | -2.475 | -17.289 | 4257.951 | 1043419.391 | 104446948.320 |
| Snub dodecahedron | -2.569 | -15.577 | 7444.008 | 890949.576 | 57481732.306 |
| Truncated cube | -1.907 | -13.208 | 5183.779 | 1300439.300 | 201545862.790 |
| Truncated cuboctahedron | -2.143 | -13.097 | 5912.355 | 1114780.637 | 142341680.100 |
| Truncated dodecahedron | -1.906 | -11.746 | 8052.126 | 1226154.160 | 163401620.030 |
| Truncated icosahedron | -2.164 | -11.775 | 6970.046 | 1165244.069 | 123592942.310 |
| Truncated icosidodecahedron | -2.148 | -11.657 | 6461.044 | 1068337.858 | 128956261.350 |
| Truncated octahedron | -2.144 | -11.828 | 6638.110 | 1336198.448 | 150585430.490 |
| Truncated tetrahedron | -1.977 | -11.391 | 8351.823 | 1444832.497 | 202017269.710 |
| Bulk solid (fcc) | -3.901 | -3.186 | 4385.080 | 265509.255 | 30014956.142 |
| Dimer | -2.239 | -1.024 | 6923.321 | 227192.717 | 9823552.539 |
|---|---|---|---|---|---|
| Octahedron | -3.163 | -1.457 | 2765.467 | 81231.426 | 9123526.461 |
| Octahedron | -3.455 | -1.794 | 1539.467 | 89757.477 | 9766553.492 |
| Cube | -3.745 | -1.180 | 2664.201 | 110609.121 | 9235782.643 |
| Icosahedron | -3.965 | -1.680 | 6354.282 | 98651.463 | 8230902.315 |
| Dodecahedron | -3.565 | -1.525 | 9584.201 | 92629.274 | 9256123.345 |
| Cuboctahedron | -3.739 | -10.083 | 1016.310 | 80505.616 | 7794825.247 |
| Icosidodecahedron | -4.087 | -5.506 | 1700.004 | 99336.991 | 4531031.341 |
| Rhombicosidodecahedron | -4.301 | -6.027 | 1741.367 | 85256.841 | 4067693.288 |
| Rhombicuboctahedron | -4.105 | -5.443 | 2020.654 | 100834.379 | 4306097.006 |
| Snub cube | -4.338 | -7.474 | 1609.428 | 73361.770 | 3170892.929 |
| Snub dodecahedron | -4.509 | -7.448 | 1604.538 | 63718.292 | 2772333.570 |
| Truncated cube | -3.719 | -3.514 | 2780.603 | 93706.049 | 3989379.764 |
| Truncated cuboctahedron | -4.095 | -5.643 | 2040.338 | 72807.266 | 3718101.004 |
| Truncated dodecahedron | -3.717 | -0.827 | 2721.354 | 90423.545 | 4418129.817 |
| Truncated icosahedron | -4.100 | -6.002 | 1858.331 | 81242.419 | 4454911.798 |
| Truncated icosidodecahedron | -4.140 | -5.594 | 2066.221 | 74635.086 | 3730411.533 |
| Truncated octahedron | -4.027 | -6.057 | 1886.612 | 98087.942 | 4539336.168 |
| Truncated tetrahedron | -3.603 | -6.091 | 2304.512 | 127671.403 | 6669393.171 |
| Bulk solid (fcc) | -5.858 | -1.159 | 1463.681 | 28636.243 | 1814989.886 |
| Nanocrystal | Shape |
|---|---|
| X35 | Octahedron |
| X51 | Truncated tetrahedron |
| X59 | Truncated tetrahedron |
| X75 | Truncated cube |
| X165 | Octahedron |
| X239 | Truncated cube |
| Y13 | Cuboctahedron |
| Y19 | Octahedron |
| Y35 | Tetrahedron |
| Y55 | Cuboctahedron |
| Y63 | Cube |
| Y85 | Octahedron |
| Y147 | Cuboctahedron |
| Y171 | Cube |
| Y201 | Truncated octahedron |
| Pt Composition | Shape | |
|---|---|---|
| Pt12 Pd | 0.923 | Cuboctahedron |
| Pt12 Pd7 | 0.632 | Octahedron |
| Pt24 Pd11 | 0.686 | Tetrahedron |
| Pt36 Pd19 | 0.655 | Cuboctahedron |
| Pt36 Pd27 | 0.571 | Cube |
| Pt60 Pd25 | 0.706 | Octahedron |
| Pt120 Pd27 | 0.816 | Cuboctahedron |
| Pt144 Pd27 | 0.842 | Cube |
| PtPd12 | 0.077 | Cuboctahedron |
| Pt7 Pd12 | 0.368 | Octahedron |
| Pt11 Pd24 | 0.314 | Tetrahedron |
| Pt19 Pd36 | 0.345 | Cuboctahedron |
| Pt27 Pd36 | 0.429 | Cube |
| Pt25 Pd60 | 0.294 | Octahedron |
| Pt27 Pd120 | 0.184 | Cuboctahedron |
| Pt27 Pd144 | 0.158 | Cube |
| Pt57 Pd144 | 0.284 | Truncated octahedron |
| Pt Composition | Shape | |
|---|---|---|
| PtPd18 | 0.053 | Octahedron |
| PtPd34 | 0.029 | Tetrahedron |
| Pt13Pd42 | 0.236 | Cuboctahedron |
| Pt13Pd50 | 0.206 | Cube |
| Pt19Pd66 | 0.224 | Octahedron |
| Pt13Pd134 | 0.088 | Cuboctahedron |
| Pt19Pd128 | 0.129 | Cuboctahedron |
| Pt55Pd92 | 0.374 | Cuboctahedron |
| Pt158Pd13 | 0.924 | Cube |
| Pt152Pd19 | 0.889 | Cube |
| Pt136Pd35 | 0.795 | Cube |
| Pt116Pd55 | 0.678 | Cube |
| Pt108Pd63 | 0.632 | Cube |
| Pt188Pd13 | 0.935 | Truncated octahedron |
| Pt182Pd19 | 0.905 | Truncated octahedron |
| Pt166Pd35 | 0.826 | Truncated octahedron |
| Pt146Pd55 | 0.726 | Truncated octahedron |
| Pt Composition | Shape | |
|---|---|---|
| Pt4Pd9 | 0.308 | Cuboctahedron |
| Pt5Pd14 | 0.263 | Octahedron |
| Pt13Pd22 | 0.371 | Tetrahedron |
| Pt21Pd34 | 0.382 | Cuboctahedron |
| Pt25Pd38 | 0.397 | Cube |
| Pt30Pd55 | 0.353 | Octahedron |
| Pt61Pd86 | 0.415 | Cuboctahedron |
| Pt73Pd98 | 0.427 | Cube |
| Pt119Pd82 | 0.592 | Truncated octahedron |
| Pt Composition | Shape | |
|---|---|---|
| Pt16C19 | 0.457 | Octahedron |
| Pt20C31 | 0.392 | Truncated tetrahedron |
| Pt28C31 | 0.475 | Truncated tetrahedron |
| Pt32C43 | 0.427 | Truncated cube |
| Pt80C85 | 0.485 | Octahedron |
| Pt104C135 | 0.435 | Truncated cube |
| Pt19C16 | 0.543 | Octahedron |
| Pt31C20 | 0.608 | Truncated tetrahedron |
| Pt31C28 | 0.525 | Truncated tetrahedron |
| Pt43C32 | 0.573 | Truncated cube |
| Pt85C80 | 0.515 | Octahedron |
| Pt135C104 | 0.565 | Truncated cube |