Nucleosynthesis in helium-enriched asymptotic giant branch models: Implications for Heavy Element Enrichment in Centauri
Abstract
We investigate the effect of helium enrichment on the evolution and nucleosynthesis of low-mass asymptotic giant branch (AGB) stars of 1.7 and 2.36 with a metallicity of ([Fe/H] ). We calculate evolutionary sequences with the primordial helium abundance () and with helium-enriched compositions (). For comparison we calculate models of the same mass but at a lower metallicity ([Fe/H] ) with . Post-processing nucleosynthesis calculations are performed on each of the evolutionary sequences to determine the production of elements from hydrogen through to bismuth. Elemental surface abundance predictions and stellar yields are presented for each model. The models with enriched helium have shorter main sequence and AGB lifetimes, and enter the AGB with a more massive hydrogen exhausted core than the primordial helium model. The main consequences are 1) low-mass AGB models with enhanced helium will evolve more than twice as fast, giving them the chance to contribute sooner to the chemical evolution of the forming globular clusters, and 2) the stellar yields will be strongly reduced relative to their primordial helium counterparts. An increase of at a given mass decreases the yields of carbon by up to %, of fluorine by up to 80%, and decreases the yields of the -process elements barium and lanthanum by %. While the yields of first -process peak elements strontium, yttrium and zirconium decrease by up to 50%, the yields of rubidium either do not change or increase.
1 Introduction
The globular cluster (GC) Centauri (NGC 5139) shows a star-to-star spread in iron that spans more than an order of magnitude, from [Fe/H] determined both by photometry and spectroscopy and with a mean metallicity of approximately [Fe/H] (Norris & Da Costa, 1995; Stanford et al., 2006; Kayser et al., 2006; Johnson et al., 2008; Calamida et al., 2009; Johnson & Pilachowski, 2010; Simpson & Cottrell, 2013). The spread in iron and other iron-peak elements is larger than measured in any other Galactic GC including M22 (Da Costa & Marino, 2011; Marino et al., 2011, 2012b). Multiple populations have been observed along various evolutionary stages of the color-magnitude diagram (CMD) from the main sequence (Anderson, 1997; Bedin et al., 2004; King et al., 2012) through the subgiant and red giant branches (e.g., Bellini et al., 2010), to the white dwarf cooling sequence (e.g., Calamida et al., 2008; Bellini et al., 2013). Modeling of the CMD requires stellar isochrones with variations in iron of up to one dex and helium enhancements up to 0.40 (Norris, 2004; Piotto et al., 2005; King et al., 2012).
Omega Cen also shows the abundance patterns between light elements (e.g., C, N, O, Na, Al) that are observed in mono-metallic GCs as well as variations in the Mg isotopes (Johnson et al., 2009; Johnson & Pilachowski, 2010; Pancino et al., 2011b, a; Marino et al., 2012a; Simpson et al., 2012; Simpson & Cottrell, 2013; Da Costa et al., 2013). The first evidence for helium enrichment came from photometry through the split main sequence (Bedin et al., 2004; Norris, 2004; Piotto et al., 2005). Dupree & Avrett (2013) used the near-infrared transition of He I to obtain helium abundances for two red giant branch (RGB) stars, and find a difference of , with the Al-rich star having the highest helium abundance. These data and more illustrate that the chemical evolution of Cen shows a high level of complexity beyond that observed in any other GC.
Of particular importance in the understanding of the evolution of Cen is the relative ages between the various sub-populations. Numerous studies based on CMD analysis combined with the metallicity distribution have yielded conflicting results, with an age spread between 0-5 Gyrs (Norris, 2004; Sollima et al., 2005; Stanford et al., 2006; Villanova et al., 2007). The notable rise of heavy elements produced by the slow neutron capture process (the -process, e.g., La, Ba) with increasing [Fe/H] (Norris & Da Costa, 1995; Johnson & Pilachowski, 2010; Stanford et al., 2010; Marino et al., 2011; D’Orazi et al., 2011) may require a star formation possibly extended over a few Gyrs (Smith et al., 2000; Marcolini et al., 2007; Romano & Matteucci, 2007). On the other hand, isochrone fitting that takes into account helium variations and CNO differences as observed in Cen (Marino et al., 2012a) favors small age spreads between the different sub-populations (Herwig et al., 2012; Joo & Lee, 2013). Rapid-formation scenarios wherein the entire cluster formed within a few times years have also recently been suggested by D’Antona et al. (2011) and Valcarce & Catelan (2011) making this issue highly controversial.
The origin of the helium and light-element abundance correlations observed in Cen have been the subject of much debate. Both result from hot hydrogen burning (e.g., Prantzos et al., 2007), which produces helium via the CNO cycles as well as variations in C, N, O and F. Higher order hydrogen burning reactions alter Na, Mg, and Al via the NeNa and MgAl chains. The two favored polluters include intermediate-mass asymptotic giant branch stars between (Ventura & D’Antona, 2009; D’Antona et al., 2011) and rapidly rotating massive stars (Decressin et al., 2007; Krause et al., 2013), although massive stars in binaries have also been proposed (de Mink et al., 2009). Numerous studies have discussed the merits and problems with each polluter and the various scenarios (e.g., D’Antona et al., 2002; Fenner et al., 2004; Norris, 2004; Karakas et al., 2006; Renzini, 2008; Decressin et al., 2009; D’Ercole et al., 2010). The contribution of massive stars that explode as core collapse supernovae (Type II SNe) is required owing to the spread in iron but the heavy elements have been attributed to the -process acting in low and intermediate-mass AGB stars (Vanture et al., 1994; Smith et al., 2000; Johnson & Pilachowski, 2010; D’Orazi et al., 2011). The mass range of AGB stars responsible for the neutron-capture elements in Cen is unknown but can be constrained from the variations in key elements affected by neutron density including Rb, Zr, Sr, Ba, and Pb. This conclusion is reached by considering how the two main neutron producing reactions effect the predicted abundance distribution of heavy elements. The first reaction identified was e(,n)g, which occurs in massive stars and intermediate-mass AGB stars () when temperatures exceed 300 K (Cameron, 1960; Truran & Iben, 1977; Cosner et al., 1980). The second is the (,n) reaction that has been confirmed observationally and theoretically to be the main neutron source in low-mass AGB stars (e.g., Gallino et al., 1998; Abia et al., 2001). The e(,n)g reaction is predicted to overproduce elements at the first -process peak (e.g., Cu, Rb) over heavier elements such as Ba, La, and Pb. We provide a more detailed introduction to the evolution and nucleosynthesis of low-mass AGB stars in §2.
D’Orazi et al. (2011) find that the Pb measurements in Cen stars suggest that the peak stellar mass contributing to the production of heavy elements in Cen is not dominated by intermediate-mass AGB stars of , which mostly produce Rb (Lugaro et al., 2012; Karakas et al., 2012), or massive stars which produce Cu, Rb and little Ba or Pb (e.g., Cunha et al., 2002; Pignatari et al., 2010; Frischknecht et al., 2012). The Pb observations, extended star formation and possible younger ages of the metal-rich populations suggest that the peak mass contributing to the rise of the process in Cen is probably (see discussions in Stanford et al., 2007).
If low-mass AGB stars are contributing to the chemical evolution of heavy elements in the metal and helium-rich component of Cen, then those AGB stars will themselves be metal and helium rich. The studies on the effect of helium enrichment on the evolution of low and intermediate-mass stars concentrate on the low-mass stars () that influence the color-magnitude diagram of star clusters today (Sweigart, 1987; Gallart et al., 2005; Lee et al., 2005; Valcarce et al., 2012; Joo & Lee, 2013; Campbell et al., 2013). Furthermore, most of the studies do not carry the evolution beyond the horizontal branch to the AGB where the richest nucleosynthesis occurs for stars less than 8. Here for the first time we present helium-enriched stellar yields of stellar models from the main sequence through to the tip of the AGB. We investigate the effect of helium enrichment on the stellar evolution through the giant branches as well as the effect it has on the stellar yields of elements from hydrogen through to bismuth. The focus of our study is on models of (or [Fe/H] = ) because the metal-rich tail of Cen shows evidence for significant helium enrichment. We also calculate models at the same mass at (or [Fe/H] = ) with a primordial helium composition. At this metallicity there is no evidence for a high helium enrichment and will be used for comparison to the metal-rich models.
In §2 we begin with a description of low-mass AGB evolution and nucleosynthesis, in §3 we describe the theoretical models and present the results of the stellar evolution calculations, in §4 we present the numerical method used to calculate the nucleosynthesis predictions, and in §5 we present the stellar yields and nucleosynthesis results. We finish with a discussion and concluding remarks in §6.
2 Low-mass Asymptotic Giant Branch Stars
Stars with masses less than about 8, depending on the global metallicity, , evolve through core hydrogen and helium burning before ascending the giant branch for the second time. At this stage the star is said to be on the asymptotic giant branch. For the rest of this discussion and study we will focus on low-mass AGB stars, which are stars and do not experience hot bottom burning or the second dredge-up.
The structure of an AGB star consists of an electron degenerate C-O core, surrounded by a He-burning shell, a He-rich intershell, and a H-burning shell (for a review see Herwig, 2005). The core and burning shells are surrounded by a large convective envelope that is composed primarily of hydrogen. The He-burning shell thins as the star evolves up the AGB and eventually becomes thermally unstable and flashes or pulses every years or so, depending on the mass of the H-exhausted core (hereafter core mass). The energy produced per thermal pulse (TP) is enormous (a few ) and leads to vigorous convection in the He-intershell which mixes the products of He-nucleosynthesis throughout the entire intershell. The energy from the TP is converted into mechanical energy and drives a strong expansion of the whole star. This pushes the H-shell out to cooler regions where it is essentially extinguished. The rapid cooling caused by the expansion and the extinction of the H-shell may allow convection to develop in regions previously mixed by the flash-driven convection in the He-intershell. This inward movement of the convective envelope is known as third dredge-up (TDU), and is responsible for enriching the surface in and other products of He-burning (e.g., F, e) as well as heavy elements produced by the process (for a review of AGB nucleosynthesis see Busso et al., 1999). Following TDU, the star contracts and the H-shell is re-ignited, providing most of the surface luminosity for the next interpulse period. This sequence of TP–TDU mixing–interpulse phase will occur many times on the AGB, depending on initial mass, metallicity, and the AGB mass-loss rate.
The process occurs in the intershell of AGB stars where helium is abundant and the temperatures are high enough for (,n) reactions to occur. There are two possible neutron sources in AGB stars: the (,n) and the e(,n)g reactions. The e neutron source is activated at temperatures higher than 300 K (MK). These high temperatures can only be reached inside the convective TPs of intermediate-mass AGB stars (Truran & Iben, 1977; Lugaro et al., 2012). The He-intershell of low-mass AGB models less than (at the metallicities in this study) do not reach 300 MK, which means that neutrons are produced by the (,n) reaction. The neutron source is activated at lower temperatures (e.g., 90 MK, Cameron, 1955; Straniero et al., 1997) but requires an additional supply of above that left from CN cycling to make it an efficient neutron source (e.g., Gallino et al., 1998). For this reason some protons must be mixed into the top layers of the He-intershell and this mostly likely occurs at the deepest extent of TDU episodes, where a composition discontinuity forms between the H-rich envelope and the He-rich intershell. The protons are readily captured by the abundant to form and , resulting in the formation of a pocket.
One of the largest unknowns in process calculations is the physical mechanism that causes the formation of pockets as well as the extent in mass of the protons mixed into the intershell. This means that the size of the pocket can be essentially treated as a free parameter, although the extent can be constrained using data from AGB stars, barium and CH stars, post-AGB stars, and planetary nebulae (e.g., Busso et al., 2001; Bonačić Marinović et al., 2007a; Shingles & Karakas, 2013). We refer to Lugaro et al. (2012) for a detailed discussion (see also Gallino et al., 1998; Goriely & Mowlavi, 2000; Herwig, 2005; Cristallo et al., 2009).
3 Helium-enriched Stellar Evolutionary Models
In this study we evolve stellar models of mass 1.7 and 2.36 with global metallicities of and ([Fe/H] respectively) from the pre-main sequence to the tip of the AGB. The mass of 1.7 was chosen as representative of a low-mass AGB star that produces an -process distribution typical of radiative burning (see discussion in Lugaro et al., 2012). The 2.36 was chosen because the core mass of the primordial model with at the beginning of the AGB is similar to the core mass of the helium-enriched 1.7 model with and can therefore be used for comparison. Furthermore, all the 2.36 models show marginal activation of the e(,n)g neutron source and is therefore a borderline case between low and intermediate mass behavior.
We calculate one model at each mass at with a primordial helium composition of . These lower metallicity models are evolved for comparison to the models of , which are the focus of this study. At we evolve four separate stellar models with initial helium abundances of and . The model will be referred to as the primordial helium model. While varying helium we keep the global metallicity constant at which means that the initial hydrogen abundance decreases. The initial composition of C, N, and O are scaled solar and the same in all the model calculations (note that we consider an -enhancement of dex on the nucleosynthesis of the primordial models). The stellar models are calculated using an updated version of the Mount Stromlo Stellar Evolution Code (Lattanzio, 1986; Frost & Lattanzio, 1996; Karakas & Lattanzio, 2007; Karakas et al., 2010). We use the same version of the code described in Kamath et al. (2012) which includes the latest C, N-rich low temperature opacity tables from AESOPUS (Marigo & Aringer, 2009). In contrast to the models of Kamath et al. (2012) no convective overshoot was applied to the border of the convective envelope in order to obtain third dredge-up. Convection is approximated using the Mixing-length Theory with a mixing-length parameter of in all calculations. We assume no mass loss on the RGB and use the Vassiliadis & Wood (1993) mass-loss formulation on the AGB.
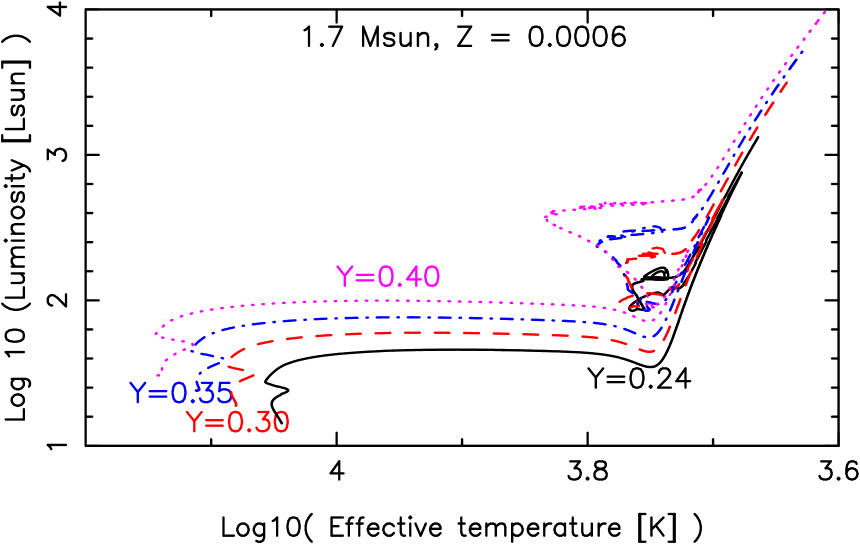
In Figure 1 we show the evolutionary tracks of the 1.7, models from the main sequence to the start of the thermally-pulsing AGB. This figure illustrates the effect of an enhanced helium abundance on the surface luminosity and effective temperature as a function of evolution. At a given evolutionary phase the model with increased helium is hotter and more luminous. The hotter temperatures and higher luminosities arise because of the higher mean molecular weight imposed by the enhanced helium mass fraction at the beginning of the main sequence compared to the primordial helium model. Higher temperatures also lead to a larger hydrogen exhausted core at the end of the main sequence and this carries through to the beginning of the AGB.
Table 1 is a summary of the properties of the stellar models. We include the main sequence lifetime, ; the RGB lifetime, and the core helium burning lifetime, . We then show the core mass at the first TP, ; the core mass at the first TDU episode, ; the total number of thermal pulses during the AGB; the total mass dredged up into the envelope, ; the maximum dredge-up efficiency, ; which is calculated according to , where is the amount of material dredged into the envelope and is the amount by which the H-exhausted core grew during the preceding interpulse phase. We then include the maximum temperature reached during a TP, ; and the maximum mass of the flash-driven convective zone in the He-intershell at the last TP, , which is a good approximation to the total mass of the He-intershell at the final TP. The final stellar mass, core mass, and envelope mass () at the last time step are included, along with the total stellar lifetime, . For the 2.36 models we also include the maximum temperature at the base of the convective envelope, . Lifetimes are in Myr ( years), masses in solar units () and temperatures in Kelvin.
For the 1.7 models, the envelope masses for each stellar evolutionary sequence are small () except for the model. The model has of envelope left, which is less than what was lost between the last two TPs (). The primordial models are evolved to the white dwarf cooling track and have no envelope left. A small final means that all mixing episodes that will affect the final expelled yields have been calculated. This is the case of the 1.7 models, and the primordial 2.36 models which have of envelope left. Calculations of the helium-enhanced 2.36 models experienced convergence problems before the models lost their envelopes. These models lose of envelope between TPs during the superwind, which indicates that the models may experience one more TP, while the may experience up to two more TPs. The occurrence of thermal pulses do not always lead to TDU and there is some evidence that the TDU efficiency, , decreases with decreasing (e.g., Straniero et al., 1997; Karakas et al., 2002). Given the uncertainty it is unclear how many more mixing episodes would occur. For these models we take the stellar yields as lower limits. Note that the stellar lifetimes in Table 1 are accurate even if we miss one or two TPs. This is because the interpulse periods are short relative to the total stellar lifetime and missing two means we are missing Myr for the 1.7 models and Myr for the 2.36 models.
The models with higher helium appear to evolve as more massive stars of the same metallicity during their pre-AGB evolution and this is also somewhat the case during the AGB. The models with increasing helium show thinner helium intershells (as measured in mass), higher helium-shell burning temperatures, and even mild hot bottom burning in the case of the 2.36 model with . This model also experiences second dredge-up after core helium burning, the only model to do so. For the models of 1.7 we also find increasing interior temperatures and core masses in models of increasing helium. While the dredge-up efficiencies and helium-shell burning temperatures increase in all helium-enhanced models, they do not increase as much as we would expect in a star of the same core mass but born with a primordial composition (and therefore higher total mass). To illustrate this, the 1.7 model with enters the TP-AGB with a similar core mass to the 2.36, model. Helium shell temperatures in the 1.7 model with never exceed 300 MK and . In contrast, by the 8th TP, the 2.36 model with has peak temperatures of 318 MK and dredge-up efficiencies .
The amount of material mixed into the envelope during the AGB is a crucial parameter for determining the level of chemical enrichment. Interestingly models with the same mass, helium content but different (comparing the to 0.0003 models, so a factor of two change), show a similar AGB evolution, dredging up approximately the same amount of material and finishing with roughly the same core mass. Helium on the other hand, is a much more significant parameter. From Table 1 we see that the total amount of matter dredged into the envelope is lower in the helium-enriched models. For example, the 1.7 model with dredges up a factor of less helium-shell material during the AGB while the 2.36 model with dredges almost a factor of 6 less material (while experiencing more thermal pulses). The helium-enhanced 1.7 models experience fewer TPs than the primordial model; this combined with smaller He-intershells reduces the total amount of dredge-up material. The reduction in the mass of the He-intershell is particularly significant in the helium-enhanced 2.36 models where the model has a He-intershell that is a factor of lower in mass than the primordial model (c.f. only a factor of 2 in the 1.7). This reduction in He-shell mass is the main reason for the reduction in total dredged-up material, because as shown by Table 1 the dredge-up efficiency stays approximately the same at in the 2.36 models.
Also crucial for the chemical enrichment is the total stellar lifetime. From Table 1 we see that the lifetime of the helium-enriched 1.7 models are less than 1 Gyr, whereas the lifetime of the 2.36 helium-enriched models ( Myr) become comparable to intermediate-mass AGB stars of . This indicates that while low-mass primordial composition AGB stars with may not have time to contribute to the chemical evolution of Cen, those stars born out of helium and metal-enriched mixtures will. These stars will also contribute less material to the interstellar medium. This could lead to a plateau in the chemical evolution of -process elements, as found by Norris & Da Costa (1995) as we discuss in more detail in §6.
4 Stellar Nucleosynthesis Models
To study the nucleosynthesis of the elements up to bismuth we use a post-processing code that takes the stellar evolutionary sequences as input. The stellar inputs are the temperature, density, and convective velocities (for convective regions) at each mass shell in the model star as a function of time. Convective velocities are needed because the code includes in the equations to be solved for the abundances both the changes due to nuclear reactions and those due to mixing. The code has been previously described in detail by, e.g., Cannon (1993), Lugaro et al. (2012), and Karakas et al. (2012). The nuclear network we use is a network of 320 species and 2,336 reactions, where most of the isotopes are located along the valley of -stability. The nuclear reaction network is based on the JINA REACLIB database as of 2012 (Cyburt et al., 2010).
The models have an [Fe/H] whereas the models have [Fe/H] using (Fe)⊙ = 7.54 and the standard spectroscopic notation where [X/Fe] = (X/Fe)(X/Fe)⊙. This places the models near the metal-rich tail of stars in Cen (e.g., Johnson et al., 2008). Note that we use the proto-solar abundances for C, N, O, and Fe from Table 5 of Asplund et al. (2009). In the post-processing calculations we take the initial hydrogen and helium abundances from the evolution calculations. For the primordial helium models, we set the initial abundances to be scaled solar, with the exception of the -elements [O, Ne, Mg, Si/Fe] = . For the helium-enriched models we set all initial abundances to be scaled solar. We base these choices of the initial C, N, and O on the observed abundances of Cen stars from Marino et al. (2012a). The abundances of elements lighter than Fe do not affect the predictions of -process elements but can provide some indication of the level of pollution expected.
The He-intershell of the 1.7 models do not reach 300 MK (see Table 1) which means that neutrons only come from the (,n) reaction. For the 2.36 model the temperature in the He-shell reaches over 300 MK which also leads to activation of the e(,n)g neutron source. This is measurable by the change in isotopic ratios of Mg as well as the ratios of Rb to Sr and Zr (Abia et al., 2002; Karakas et al., 2012). The inclusion of the neutron source is performed during the post-processing by forcing the code to mix a small amount of protons from the envelope into the intershell at the deepest extent of each TDU. The procedure we use is the same as outlined in detail by Lugaro et al. (2012) (and similar to Goriely & Mowlavi, 2000) where we apply the assumption that the proton abundance in the intershell decreases from the envelope value of 0.7 to a minimum value of 10-4 at a given point in mass located at “” below the base of the envelope. We keep the value of constant from pulse to pulse. The value of is chosen such that the resultant pocket is about 1/10th of the mass of the He-intershell, and is set at in the 1.7 models and in the 2.36 models. In the most helium-rich 1.7 and 2.36 models with = 0.004 and 0.002 respectively, the resultant pocket may extend to cover up to 20% of the helium intershell, owing to a thinner shell relative to the primordial model.
While we treat the size of the partially mixed zone as a free parameter, it can be constrained by comparison to observations. Observations suggest that stochastic variations in the effectiveness (or size) of the pocket in AGB stars are present. Bonačić Marinović et al. (2007a) find that galactic disk objects are reproduced by a spread of a factor of 2–3 in the effectiveness of the pocket, whereas Busso et al. (2001) required a spread of a factor of . Comparisons to lower metallicity post-AGB stars require larger spreads of a factor of 3–6 (Bonačić Marinović et al., 2007b; De Smedt et al., 2012). Comparisons of theoretical predictions to observed abundances of carbon enhanced metal-poor stars suggest that the size of the pocket could vary up to a factor of 10 or more (Bisterzo et al., 2011; Lugaro et al., 2012). In summary, there is observational evidence that a spread in effectiveness of the pocket is needed in theoretical models, but there is no consensus on how large that spread actually is. This problem indicates a significant lack of understanding on the mechanism(s) responsible for the formation of pockets in AGB stars and is related to the treatment of convection in stellar codes (see discussions in Goriely & Mowlavi, 2000; Lattanzio & Lugaro, 2005; Herwig, 2005). Note that we do not consider the effect of rotation on AGB models, which are known to affect process predictions (Herwig et al., 2003; Piersanti et al., 2013).
5 Nucleosynthesis and Stellar Yields
We calculate the elemental stellar yields, which are available as on-line data tables for all stellar evolutionary sequences listed in Table 1. We provide two tables for download, one containing all the yields for the models (called “z0003.yields.tab”) and another for all the models in this study (called “z0006.yields.tab”). All the data, including additional data tables for models, are available in a .tar.gz package in the electronic edition. Table 2 shows a portion of the yield table for the models and is published in its entirety in the electronic edition. Each table begins with a table header that lists the initial mass (in ), metallicity, helium content, and size of used in the calculations. The second row is another header that provides the final mass (in ) and the total mass expelled into the interstellar medium (ISM) (in ). The total expelled mass is simply the initial mass minus the final core mass, using values from Table 1. The columns in Table 2 are the element symbol, the atomic number (), and the abundance in terms of , where is the abundance by number of element . Next we provide the [X/H] and [X/Fe] ratios and the mass fraction of element X. All abundances are calculated from the average composition of the ejected stellar wind.
In the final column of Table 2 we include the stellar yield, which we define here as the mass of X expelled into the ISM over the stellar lifetime. The mass expelled into the ISM is calculated according to
| (1) |
where is the yield of species (in solar masses), is the current mass-loss rate, is the current mass fraction of species , and is the total lifetime of the stellar model. The yield as defined here is always positive.
We include elemental yields for all stable elements except Li, Be, B; the radioactive Tc is included because it is a tracer of the process but the un-stable elements Pm and Po are not included. We have assumed that radioactive species have decayed to their daughter products (e.g., l has decayed to g) with the exception of Tc. After the elemental yields are listed, we also include the -process indicators, which are obtained from the ejected composition of the stellar wind: [Rb/Zr], [ls/Fe], [hs/Fe], [hs/ls], and [Pb/hs], where [ls/Fe] and [hs/Fe] are defined according to [ls/Fe] = ([Sr/Fe] + [Y/Fe] + [Zr/Fe)/3, and [hs/Fe] = ([Ba/Fe] + [La/Fe] + [Ce/Fe])/3.
5.1 Summary of Abundance Predictions
In Table 3 we show representative predicted abundance ratios (in [X/Fe]) of elements produced by AGB stars including C, N, F, and Na as well as the neutron-capture elements Kr, Rb, and Pb, and the process indicators [ls/Fe] and [hs/Fe]. Abundance predictions are from the models with different helium abundances, as noted in the table, and calculated with the same .
Table 3 shows that the abundances of the light elements C, N, F, and Na are enhanced by AGB nucleosynthesis in all calculations to some extent. The elements traditionally synthesized by AGB models such as C and F are particularly enriched (at the level of [X/Fe] ). Other elements (e.g., N, O, Na) are only marginally enhanced at the level of dex (e.g., oxygen). Mg and Al are not produced in the 1.7 models and marginally produced at 2.36 at the level of dex for Mg and 0.15 dex for Al. The intermediate-mass elements from Si to Fe are not produced by AGB stars (Karakas et al., 2009; Cristallo et al., 2011) although P and Sc can be made by neutron captures during convective thermal pulses. We find maximum enhancements on the level of 0.55 dex for P and about 0.30 dex for Sc. Iron group elements are not produced by AGB stars and although some Fe is consumed by the process, the overall change to the elemental Fe abundance is very small. The enhancement of elements heavier the Ni, including Cu and Zn which are at the beginning of the -process path, show some increase depending on the mass, helium content, and size of . Eu and other elements associated with the process (e.g., Pt, Au) are enhanced on the level of dex. Although the chemical evolution of these elements is dominated by the process, low-metallicity low-mass AGB stars can synthesize some amount of e.g., Eu (Cristallo et al., 2009; Bisterzo et al., 2010; Lugaro et al., 2012). The amounts produced are always lower than traditional -process elements (Sr, Ba, Pb), e.g., [Ba/Eu] = 1.0 and [Pb/Eu] in the 1.7 models.
The two lower metallicity 1.7 and 2.36 models with and produce a similar nucleosynthesis abundance pattern to their more metal-rich counterparts at . In all cases we find a stronger level of chemical enrichment in the lower metallicity models, when measured by the [X/Fe] ratios.
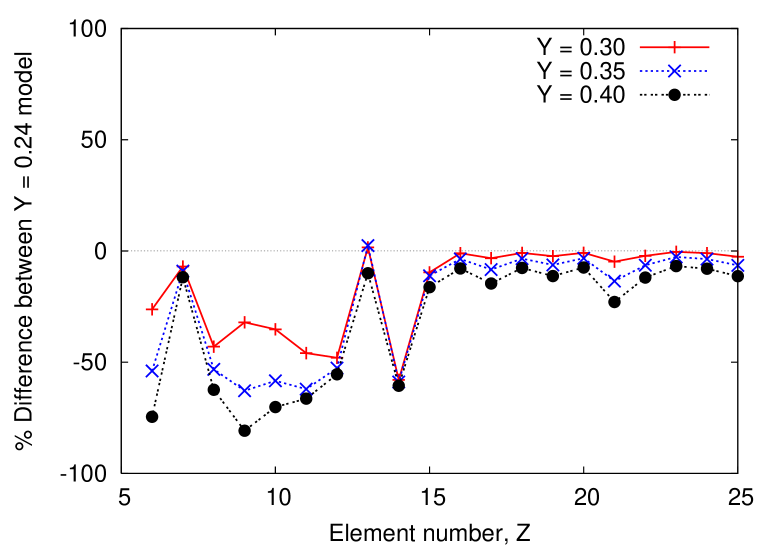
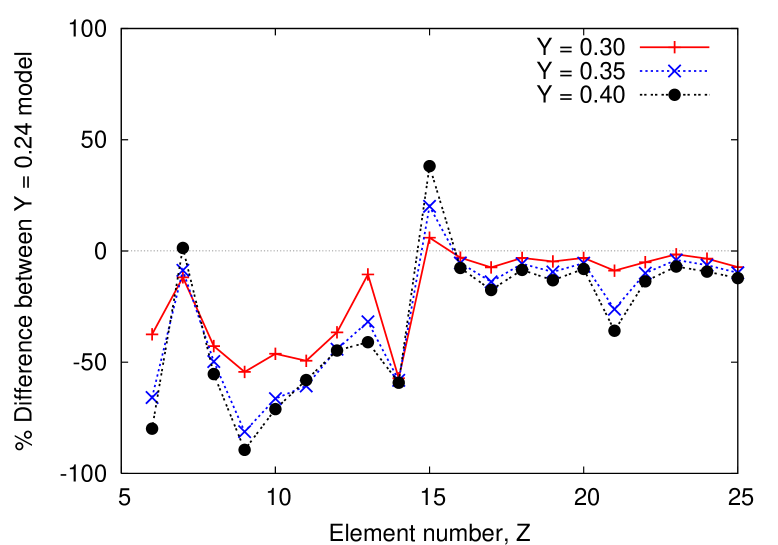
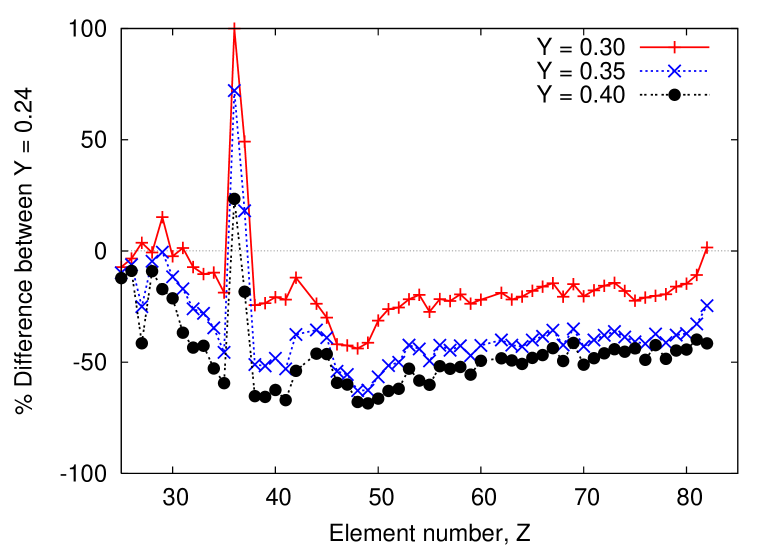
In order to discuss how variations in helium affect the stellar yield calculations we show the percentage difference between the yields calculated from the helium-enriched models relative to the yields from the model for 1.7, in Figure 2 and for 2.36, in Figure 3. Increasing the helium content by in low-mass AGB models results in a reduction in the stellar yields by up to 65% for C, 80% for F, and roughly 45% for the -process elements Ba and La. While the yields of the first -process peak elements Sr, Y, and Zr decrease by up to 50%, the yields of Rb either do not change or increase.
Models with increasing helium do expel less material into the ISM but it is only on the order of %. For example, the 1.7 model primordial composition model expels 1.038 whereas the model expels a total 0.937, a reduction of about 10%. Figure 3 however shows that the yield differences are higher than 50% between these two models for some elements. Elements most affected are those produced by AGB nucleosynthesis (e.g., C, F, -process elements). Intermediate-mass and Fe-peak elements are seen to vary at the level of %, as expected from variations in total expelled matter.
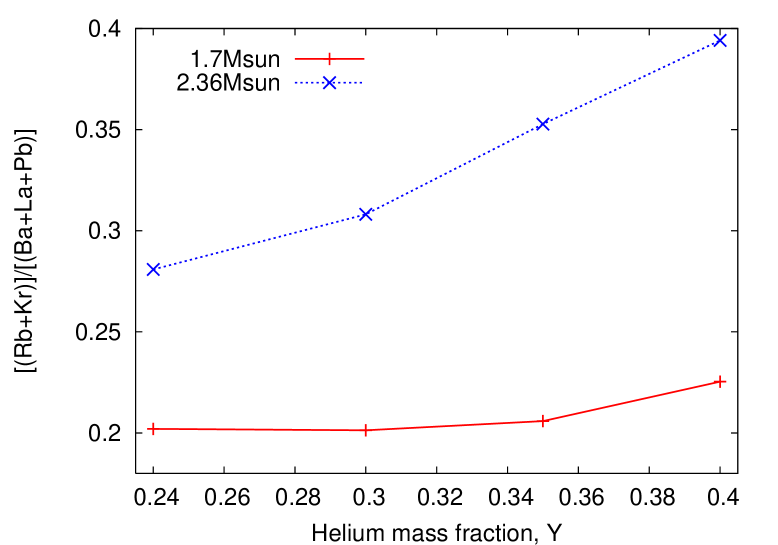
Figures 2 and 3 show that the stellar yields of P, Cu, Kr, and Rb show a reversed trend (i.e., an increase with increasing helium abundance). We further illustrate this in Figure 4, which shows the ratio of [(RbKr)]/[(BaLaPb)] from the 1.7 and 2.36 models with . Out of these elements, Rb and Kr vary the most with yield increases of up to 50%, with the Cu and P increases being reasonably small (roughly 15% and 40% for Cu and P respectively, see Figures 2 and 3). Out of Kr and Rb, only Rb is observed in low-mass GC giants111Kr has been measured to be enhanced in the spectra of planetary nebulae (Sterling & Dinerstein, 2008).. The increase in the yields of P, Kr and Rb is much more pronounced for the 2.36 case (Figures 3 and 4) than in the 1.7 model. This is because helium enrichment causes higher He-shell temperatures which leads to partial activation of the e()g reaction during convective thermal pulses.
5.2 Results for Heavy Elements
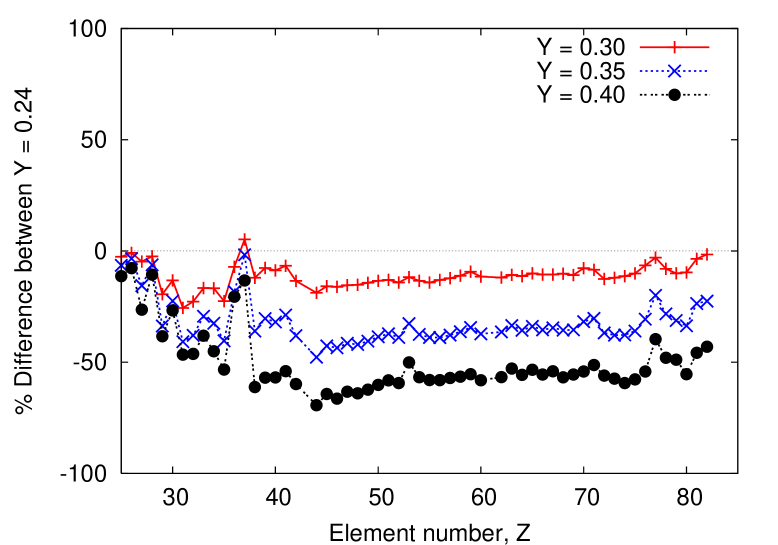
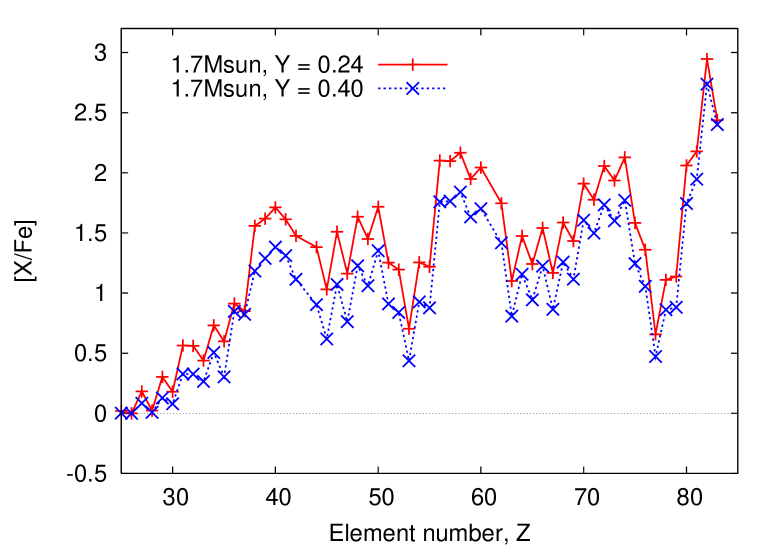
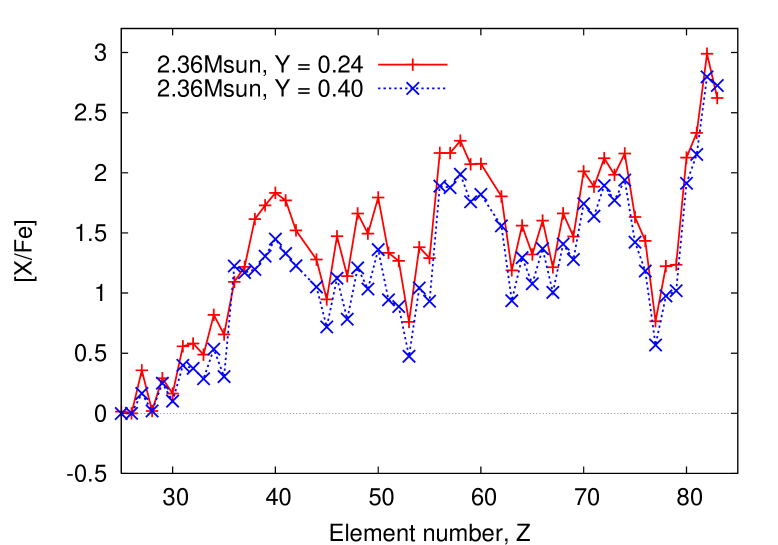
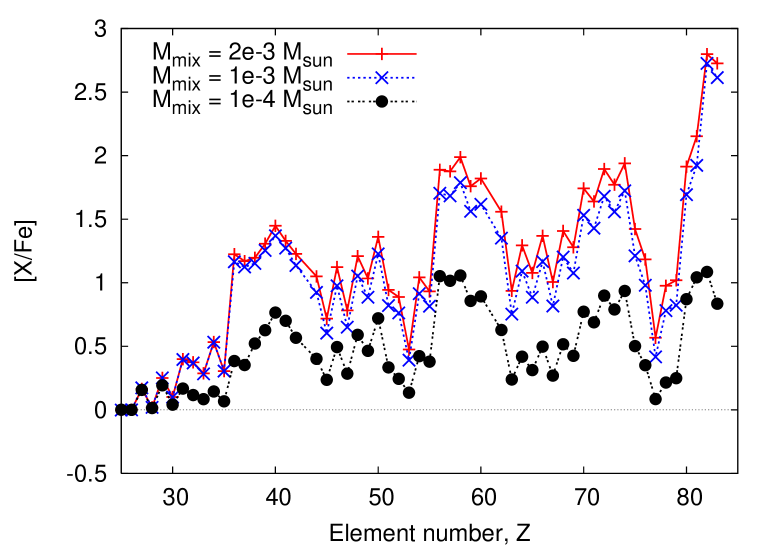
In Figure 5 we show the surface abundances in the ejected wind (in [X/Fe]) for elements heavier than iron for the 1.7 (top panel) and 2.36 (lower panel) models with a primordial helium composition and with . The figure illustrates that models with enriched helium display a typical -process pattern associated with low-mass, low-metallicity AGB stars, albeit at lower [X/Fe] values than models with a primordial helium composition. The lower [X/Fe] values show in Figure 5 are the result of less TDU material being mixed into the envelope during the TP-AGB lifetime.
We can measure if changing the initial helium content of the stellar evolutionary sequence changes the -process distribution. We can measure the shape of the distribution by comparing the values of the process indicators: [Rb/Zr], [ls/Fe], [hs/Fe], [hs/ls], and [Pb/hs]. The ratios [Rb/Zr] and [ls/Fe] measure the level of enrichment at the first -process peak around Y-Sr-Zr while the second measures the level enrichment at the second peak at around Ba. The ratio [hs/ls] is a particularly useful diagnostic because it is essentially independent of the amount of TDU, mass-loss rate uncertainties and depends on thermodynamic conditions in the He-intershell, which in turn determine the number of neutrons available for the process (e.g., Busso et al., 2001; Bisterzo et al., 2010; Lugaro et al., 2012).
We find that varying helium in the stellar evolutionary model changes the evolutionary behavior and the structural details during the TP-AGB but it does not have a significant effect on the -process distribution. For example, we obtain the same [hs/ls] in the 1.7, models with and when using the same . Similarly for [Pb/hs], which measures the amount of Pb synthesized relative to elements at the second peak around Ba, we obtain very similar values in the and models of [Pb/hs] = 0.82 and 0.95, respectively. These similar values indicate that the overall -process distribution varies little between the 1.7 models, regardless of their initial helium content and the total amount of TDU.
This is also the case for the 2.36, model although in the most helium-enriched cases we see small increases of in the -process indicator [hs/ls] and [Pb/hs] in models of the same partially mixed zone. These increases can be attributed to the the size of the partially mixed zone relative to the mass of the He-intershell. In the most helium enriched models the mass of the He-intershell decreases as shown in Table 1. This means that the ratio of the mass of the resultant pocket relative to the mass of the He-intershell is larger in the helium-enriched models.
Models with higher helium content have higher He-shell temperatures. For the 2.36 models the maximum temperature in the He-intershell is reached in the most helium-enriched models with and many TPs have peak temperatures well above 300 MK. This means that there will be some activation of the e()g neutron source and this increases the overall amount of -process enrichments. We can measure this by examining the [Rb/Zr] and [Rb/Sr] ratios. Low-mass AGB stars produce more Sr and Zr than Rb as a result of the neutron density staying below n cm-3 and the dominance of the () reaction (Busso et al., 2001; Abia et al., 2002; van Raai et al., 2012). The [Rb/Zr,Sr] ratios are therefore an important observational diagnostic (e.g., Abia et al., 2002; McWilliam et al., 2013). Positive ratios indicate efficient operation of the e(,n)g source whereas negative ratios indicate low-mass AGB stars and the operation of the (,n) reaction.
In the stellar models considered here, the [Rb/Sr] and [Rb/Zr] ratios are always negative. The primordial 1.7 models give [Rb/Sr] and [Rb/Zr] , where there is little variation with pocket size. Focusing only on [Rb/Zr], an increase of increases the [Rb/Zr] ratio in all models except the 2.36 model with a small . In the following we compare predictions from models with and models with . At 1.7, the difference in [Rb/Zr] between the helium-rich and primordial model is 0.09, 0.16, and 0.21, respectively for the three different choices for of 0.001, 0.002, and . At 2.36, the [Rb/Zr] ratio first decreases by 0.07 and then strongly increases by 0.38 and 0.36, respectively for equal to 0.0001, 0.001, and .
The size of the partially mixed zone, , determines the size of the pocket that forms in the He-intershell following a thermal pulse and consequently the number of neutrons available for the process. In Figure 6 we show the abundances in the wind for the 2.36, models of with three different sizes for . We can draw two conclusions from Figure 6. The first is that changing by a factor of leads to smaller changes to the overall level of predicted chemical enrichment relative to changing the helium abundance. Second, large changes to of a factor of 10 or more result in the most striking changes to the level of processing in the nucleosynthesis models. This is not entirely surprising as the process requires a pocket for efficient activation in low-mass AGB stars (Gallino et al., 1998; Busso et al., 2001; Karakas et al., 2007), regardless of the depth of TDU or other stellar evolutionary details that change when changing .
6 Discussion and Conclusions
Omega Centauri represents a suitable laboratory to test the predictions from helium-enhanced AGB yields. Observations reveal that this cluster has experienced a complex star-formation history with likely many kind of polluters at work (supernovae, AGB of various masses, rotating massive stars, and/or binaries). The complexity of its chemical evolution, which occurred in a complex sequence of multiple and/or continuous bursts of star formation, is reflected in many peculiar chemical patterns such as the large variation in metallicity, -process elements, and helium, and O-Na/C-N anti-correlations observed at various ranges of metallicities. The understanding of the whole observed chemical pattern in Cen is challenging, and requires complex models of chemical evolution that will eventually take into consideration not just the candidate polluters of various types, but even different initial abundances for the same polluters.
We apply the theoretical yields calculated here to Cen, focusing on the possible contribution to the chemical enrichment from low-mass AGB stars with both primordial and enhanced helium compositions. The first generations of stars in Cen were low metallicity ([Fe/H] ) with a primordial helium composition (; Piotto et al., 2005). The AGB stars at various masses from this primordial stellar population would have provided the ISM with large amounts of material converted into stars at various epochs. In particular, low-mass AGB stars from this stellar generation would produce substantial amounts of -process elements (e.g., similar to the =0.0003 model yields presented here) on relatively short times scales ( 500 Myr if we consider stars of 2.3). Here we assume that subsequent generations of stars were formed out of a higher metallicity gas that was also helium enriched. According to the models presented here, low-mass AGB stars from these generations would expel roughly the same amount of material but with yields that are much less enriched relative to their lower metallicity and primordial helium counterparts. The stellar yields calculated here show a decrease of roughly 50% for elements produced by low-mass AGB stars when increasing helium by .
What are the consequences? For elements produced by low-mass AGB stars such Ba and La the truncation in the stellar yields could explain the observed “ceiling” in -process elements seen by e.g., Norris & Da Costa (1995). That is, the first generations expel a lot, especially relative to the initial amount of heavy elements present in the ISM. The second (and later) generations of helium-enriched stars expel much less Ba and La so there would only be a small incremental rise in the chemical evolution.
If the chemical evolution of elements such as Ba, La and Pb are a consequence of their lower production in helium-enriched models, our models predict that the evolution of Kr and Rb are expected to rise, at least until the most helium-enriched AGB stars have formed. The sample by Smith et al. (2000) consists of Rb measurements for seven stars covering the metal-rich range observed in Centauri, 1.5[Fe/H]0.7, with three out the seven stars re-analysed from a previous study (Vanture et al., 1994) to place the Rb abundances on a common scale. Despite the small number of stars and the limited range in metallicity, the data display an increasing [Rb/Fe] with iron and unlike the behavior of the heavier -process elements, the abundances of [Rb/Fe] in the metal-rich stars ([Fe/H]1.0) seems to keep increasing. The ratio of [Rb/Zr] shown in Fig. 14 from Smith et al. (2000) shows a possible increase with increasing [Fe/H] from to , consistent with our models, although error bars are large and there are few stars (see also Fig. 16 from McWilliam et al., 2013). Note that D’Orazi et al. (2011) also measure Rb but only for one star. They found [Rb/Zr] , consistent with low-mass AGB nucleosynthesis.
If this chemical pattern for Rb and Zr could be confirmed for a statistically significant sample of stars, it may qualitatively support the idea that helium-enhanced low-mass AGB stars have contributed to the chemical enrichment of Cen. The helium-enriched AGB stars would also evolve much more quickly than their primordial counterparts and would have time to expel Rb (and less Sr, Zr etc) into the ISM before the star formation of Cen has finished.
As previously mentioned, the observed chemical pattern for the light elements C, N, O, and Na is very complex in Cen, as these elements show large variations at all metallicities (see Fig. 7 in Marino et al., 2012a). A significant contribution to the evolution of these elements may be a result of the high-temperature H-burning that occurred in intermediate mass AGB stars as outlined by D’Antona et al. (2011). The helium-enhanced lower mass models are expected to significantly under-produce these elements (e.g., C) relative to primordial helium models. Regardless, it is difficult to qualitatively compare our predictions with observations, as the abundance of these elements is likely the result of a mixture of polluters that may contribute in opposite directions to the ISM enrichment. We point out here that the abundance of [C/Fe] is not observed to decline with metallicity. The [C/Fe] increase with [Fe/H] is less pronounced for Na-rich (likely He-rich) stars (Marino et al., 2011), and this could qualitatively support the idea that low-mass, helium-rich AGB yields produce less carbon.
The total CNO over Fe predicted from AGB with different helium enhancement varies by 0.6 dex, with lower values for highly helium-enhanced AGB models. A CNO increase with metallicity has been observed in Cen (Marino et al., 2012a), but it is considerably lower (by 1 dex) than what is predicted from the helium-normal, low-mass AGB models. Unaccounted for effects such as dilution may also decrease the CNO abundance with respect to the predicted yields. We note that the increase of CNO is expected to drop when applying helium-enhanced AGB yields.
Knowledge of the timescales over which star formation occurred in Cen is fundamental to understanding the chemical evolution of this cluster. The heavy to light -process elemental ratio, [hs/ls], is sensitive to the progenitor AGB masses (e.g., Busso et al., 1999), but chemical abundances reported in the literature do not provide unique information regarding the AGB mass range that may have contributed to the chemical enrichment of this cluster. Smith et al. (2000) found that the increase in heavy -process elements, such as Ba, La, and Nd is larger than that in the lighter elements Y, Zr, and Mo, suggesting that the observations are better reproduced by lower mass AGB polluters of . Consequently, the star formation for Cen would have proceeded for a long period of at least 1–3 Gyrs. On the other hand, D’Orazi et al. (2011) found that light -process elements Y and Zr vary more than the second-peak ones La and Ce, suggesting that the main -process component active in Cen tends towards masses , reducing enrichment timescales from 1-3 Gyr, to a few hundred million years.
From the lifetimes given in Table 1, the helium-enriched stellar models of follow the relationship,
| (2) |
This means that either an increase in of 0.05 or of the initial mass by 11% will decrease the lifetime of the star by 24%.
Following the D’Ercole et al. (2010) scenario for the mono-metallic GC NGC 2808, extremely helium-enhanced stars are expected to form immediately after the primordial stellar generation, and, later on, mildly helium-enhanced stars form from diluted material. If a similar scenario is applicable to Cen, we expect the contribution from higher mass AGB that produced extremely He-enhanced stars to have occurred early in the cluster chemical enrichment history. Later on, lower-mass helium-enhanced AGB stars would have formed, evolving much faster than their lower-helium counterparts.
Our results imply that the contribution from these polluters is expected to occur even if the evolution of the cluster had been confined to a few hundred Myrs and up to 2 Gyrs. This would diminish the apparent discrepancy between recent scenarios for a fast cluster evolution (e.g., D’Antona et al., 2011), supported by recent isochrone fitting taking into account helium and CNO variations (e.g., Herwig et al., 2012; Joo & Lee, 2013), and the slow enrichment expected from the chemical pattern of -process elements.
One caveat to all of this is that the decrease in the lifetime means that the helium-enriched AGB stars might actually be contributing more gas. For example, if we assume that both stellar populations have a Salpeter initial mass function; that there was 100 million years between the first and second generations and that the second generation absorbed all the gas; that the last supernovae in the second generation took 40 Myr to occur; that ; that the first generation and second generation have equal mass once the last supernovae from the second generation has gone off; then we get that the fraction of gas that is from second generation stars billion years into the cluster’s life is 50%. So in other words, it is plausible that half the non-pristine gas from the third generation comes from the second generation. That would lead to a lower required amount of dilution by pristine gas in chemical evolution models of globular clusters with three generations. However, note that the total dilution required might still increase. Even though the yields of second generation stars are lower, these stars will start off with enriched abundances of some elements, and so the final released abundance might be higher.
Large helium enhancements have also been inferred for other Galactic globular clusters besides Cen including M22 (Joo & Lee, 2013), NGC 2808 (D’Antona et al., 2005; Pasquini et al., 2011; Marino et al., 2014), NGC 2419 (di Criscienzo et al., 2011), Terzan 5 (D’Antona et al., 2010), NGC 6388 and NGC 6441 (Busso et al., 2007; Caloi & D’Antona, 2007; Yoon et al., 2008). With the exception of M22, none of these clusters have been demonstrated to show clear evidence for star-to-star variations in -process elements which suggests that low-mass AGB stars have not had time to contribute to the chemical evolution of these systems. The effect of helium enrichment on the stellar yields of intermediate-mass AGB stars is unknown but if it has a similar effect as in low-mass AGB models, the yields are likely to be strongly reduced. Helium enrichment could help increase the mass-loss rate via an increase in the stellar luminosity and reduce the level of chemical enrichment from stellar models. This may also help truncate the AGB lifetime without the need for faster mass-loss rates (e.g., D’Orazi et al., 2013).
Stars in the cluster NGC 1851 show a spread in the abundances of CN and -process elements (Yong et al., 2009; Lardo et al., 2012) but helium variations in NGC 1851 are likely smaller than (where , Joo & Lee, 2013). M22 shows a spread in iron and -process elements (Da Costa et al., 2009; Marino et al., 2009; Roederer et al., 2011), and Joo & Lee (2013) determine that from a comparison between the CMD and theoretical stellar models. While the age spreads of M22 and NGC 1851 are smaller than Cen, at Myr for M22 (Marino et al., 2012b; Joo & Lee, 2013) and 300–500 Myr for NGC 1851 (Cassisi et al., 2008; Milone et al., 2008; Joo & Lee, 2013), the abundance spreads suggest the contribution from low-mass AGB stars, although perhaps higher in mass () than we considered here. For these clusters, stellar yields similar to ours that take into account variations of helium may be necessary in order to reproduce the chemical evolution of these systems.
Globular clusters are not the only systems with claims of extremely helium-enhanced subpopulations. An increase in helium for the Galactic bulge has also been suggested based on observations of the red giant branch bump (Nataf et al., 2011), and the discrepancy between its photometric and spectroscopic turnoff ages (Nataf & Gould, 2012). Helium-enhanced subpopulations have also been suggested for ellipticals and galactic spheroids (Chung et al., 2011; Bekki, 2012) as a solution to the phenomenon of the UV-upturn (Code & Welch, 1979; Brown, 2004; Atlee et al., 2009). Given that in both the case of the Galactic bulge and of extragalactic spheroids, the helium enrichment is associated with metal-rich populations, it may be the case that further insights could be gleaned from fitting abundance trends predicted by chemical evolution models to measurements made of metal-rich stars and of the integrated light of metal-rich systems. Further investigations of globular clusters could be used to gauge the reliability of helium-enhanced AGB models, and thus their potential applicability to field populations.
Finally, our results confirm that a new dimension needs to be included when considering stellar yields from stars and the chemical evolution of galaxies and stellar systems. It may not be enough to simply evolve grids of stellar evolutionary sequences covering a range in mass and metallicity. We show that variations in helium mass fraction have a significant impact on the stellar yields and may be an important third parameter.
| 1.7 models | |||||
|---|---|---|---|---|---|
| 871 | 880 | 629 | 481 | 367 | |
| 252 | 276 | 187 | 128 | 81.5 | |
| 124 | 110 | 118 | 114 | 107 | |
| 0.574 | 0.568 | 0.607 | 0.655 | 0.726 | |
| 0.587 | 0.586 | 0.627 | 0.672 | 0.741 | |
| Number of TPs | 16 | 17 | 16 | 15 | 13 |
| 0.082 | 0.071 | 0.0495 | 0.030 | 0.016 | |
| 0.64 | 0.62 | 0.60 | 0.58 | 0.57 | |
| Maximum | 287 | 285 | 288 | 289 | 292 |
| Maximum | 0.0186 | 0.0160 | 0.0150 | 0.0110 | 0.0074 |
| Final stellar mass | 0.665 | 0.662 | 0.692 | 0.806 | 0.980 |
| Final core mass | 0.665 | 0.662 | 0.683 | 0.712 | 0.763 |
| Final | 0.0 | 0.0 | 0.01 | 0.09 | 0.22 |
| 1418 | 1436 | 943.3 | 730.7 | 563.2 | |
| 2.36 models | |||||
| 348 | 373 | 280 | 218 | 169 | |
| 46.7 | 40.0 | 27.2 | 20.6 | 15.8 | |
| 99.6 | 117 | 88.1 | 68.2 | 52.5 | |
| 0.682 | 0.658 | 0.733 | 0.803 | 0.864 | |
| 0.688 | 0.667 | 0.736 | 0.808 | 0.868 | |
| Number of TPs | 19 | 18 | 16 | 17 | 20 |
| 0.159 | 0.158 | 0.090 | 0.045 | 0.027 | |
| 0.94 | 0.92 | 0.95 | 0.94 | 0.90 | |
| Maximum | 319 | 318 | 319 | 329 | 327 |
| Maximum | 0.0138 | 0.0161 | 0.0115 | 0.0063 | 0.0039 |
| Maximum | 10.7 | 8.05 | 14.7 | 23.9 | 40.0 |
| Final stellar mass | 0.832 | 0.816 | 1.074 | 1.274 | 1.493 |
| Final core mass | 0.708 | 0.693 | 0.752 | 0.818 | 0.879 |
| Final | 0.123 | 0.123 | 0.32 | 0.46 | 0.61 |
| 506.6 | 541.3 | 402.6 | 312.4 | 241.1 | |
| # El | e(X) | [X/H] | [X/Fe] | X(i) | Mass(i) | |
|---|---|---|---|---|---|---|
| p | 1 | 12.000000 | 0.000000 | 0.000000 | 7.10959E-01 | 7.37975E-01 |
| he | 2 | 11.024580 | 0.094580 | 1.470952 | 2.98779E-01 | 3.10132E-01 |
| c | 6 | 9.187603 | 0.717603 | 2.093975 | 1.30487E-02 | 1.35445E-02 |
| n | 7 | 7.051185 | 0.818815 | 0.557558 | 1.11151E-04 | 1.15375E-04 |
| o | 8 | 7.919069 | 0.810930 | 0.565442 | 9.36582E-04 | 9.72173E-04 |
| f | 9 | 5.169071 | 0.749071 | 2.125443 | 1.97771E-06 | 2.05287E-06 |
| ne | 10 | 7.795207 | 0.174793 | 1.201580 | 8.88203E-04 | 9.21955E-04 |
| na | 11 | 5.719754 | 0.520246 | 0.856126 | 8.50504E-06 | 8.82823E-06 |
| … | ||||||
| #[Rb/Zr], [ls/Fe], [hs/Fe], [hs/ls], [Pb/hs]aaWe also show the last two lines of the yield table for this particular model. | ||||||
| 0.8824 1.4041 1.8718 0.4678 0.7845 | ||||||
Note. — Stellar lifetimes are in years (Myr); masses in solar masses () and temperatures in K (MK).
Note. — Each table starts with a header that lists the initial mass, metallicity (), helium content (), size of , the final core mass, and the total amount of mass ejected. All masses are in solar units.
| Mass | [C/Fe] | [N/Fe] | [F/Fe] | [Na/Fe] | [Kr/Fe] | [Rb/Fe] | [ls/Fe] | [hs/Fe] | [Pb/Fe] | |
|---|---|---|---|---|---|---|---|---|---|---|
| 1.70 | 0.24 | 2.09 | 0.56 | 2.13 | 0.86 | 0.68 | 0.61 | 1.41 | 1.87 | 2.66 |
| 1.70 | 0.40 | 1.55 | 0.53 | 1.41 | 0.39 | 0.64 | 0.64 | 1.19 | 1.60 | 2.53 |
| 2.36 | 0.24 | 2.21 | 0.52 | 2.49 | 1.10 | 0.86 | 0.99 | 1.50 | 1.95 | 2.73 |
| 2.36 | 0.40 | 1.58 | 0.54 | 1.51 | 0.64 | 1.17 | 1.12 | 1.26 | 1.72 | 2.72 |
References
- Abia et al. (2001) Abia, C., Busso, M., Gallino, R., Domínguez, I., Straniero, O., & Isern, J. 2001, ApJ, 559, 1117
- Abia et al. (2002) Abia, C., Domínguez, I., Gallino, R., Busso, M., Masera, S., Straniero, O., de Laverny, P., Plez, B., & Isern, J. 2002, ApJ, 579, 817
- Anderson (1997) Anderson, J. 1997, PhD thesis, UC Berkeley
- Asplund et al. (2009) Asplund, M., Grevesse, N., Sauval, A. J., & Scott, P. 2009, ARA&A, 47, 481
- Atlee et al. (2009) Atlee, D. W., Assef, R. J., & Kochanek, C. S. 2009, ApJ, 694, 1539
- Bedin et al. (2004) Bedin, L. R., Piotto, G., Anderson, J., Cassisi, S., King, I. R., Momany, Y., & Carraro, G. 2004, ApJ, 605, L125
- Bekki (2012) Bekki, K. 2012, ApJ, 747, 78
- Bellini et al. (2013) Bellini, A., Anderson, J., Salaris, M., Cassisi, S., Bedin, L. R., Piotto, G., & Bergeron, P. 2013, ApJ, 769, L32
- Bellini et al. (2010) Bellini, A., Bedin, L. R., Piotto, G., Milone, A. P., Marino, A. F., & Villanova, S. 2010, AJ, 140, 631
- Bisterzo et al. (2010) Bisterzo, S., Gallino, R., Straniero, O., Cristallo, S., & Käppeler, F. 2010, MNRAS, 404, 1529
- Bisterzo et al. (2011) —. 2011, MNRAS, 418, 284
- Bonačić Marinović et al. (2007a) Bonačić Marinović, A., Izzard, R. G., Lugaro, M., & Pols, O. R. 2007a, A&A, 469, 1013
- Bonačić Marinović et al. (2007b) Bonačić Marinović, A., Lugaro, M., Reyniers, M., & van Winckel, H. 2007b, A&A, 472, L1
- Brown (2004) Brown, T. M. 2004, Ap&SS, 291, 215
- Busso et al. (2007) Busso, G., Cassisi, S., Piotto, G., Castellani, M., Romaniello, M., Catelan, M., Djorgovski, S. G., Recio Blanco, A., Renzini, A., Rich, M. R., Sweigart, A. V., & Zoccali, M. 2007, A&A, 474
- Busso et al. (2001) Busso, M., Gallino, R., Lambert, D. L., Travaglio, C., & Smith, V. V. 2001, ApJ, 557, 802
- Busso et al. (1999) Busso, M., Gallino, R., & Wasserburg, G. J. 1999, ARA&A, 37, 239
- Calamida et al. (2009) Calamida, A., Bono, G., Stetson, P. B., Freyhammer, L. M., Piersimoni, A. M., Buonanno, R., Caputo, F., Cassisi, S., Castellani, M., Corsi, C. E., Dall’Ora, M., Degl’Innocenti, S., Ferraro, I., Grundahl, F., Hilker, M., Iannicola, G., Monelli, M., Nonino, M., Patat, N., Pietrinferni, A., Prada Moroni, P. G., Primas, F., Pulone, L., Richtler, T., Romaniello, M., Storm, J., & Walker, A. R. 2009, ApJ, 706, 1277
- Calamida et al. (2008) Calamida, A., Corsi, C. E., Bono, G., Stetson, P. B., Prada Moroni, P., Degl’Innocenti, S., Ferraro, I., Iannicola, G., Koester, D., Pulone, L., Monelli, M., Amico, P., Buonanno, R., Caputo, F., D’Odorico, S., Freyhammer, L. M., Marchetti, E., Nonino, M., & Romaniello, M. 2008, ApJ, 673, L29
- Caloi & D’Antona (2007) Caloi, V. & D’Antona, F. 2007, A&A, 463, 949
- Cameron (1955) Cameron, A. G. W. 1955, ApJ, 121, 144
- Cameron (1960) —. 1960, AJ, 65, 485
- Campbell et al. (2013) Campbell, S. W., D’Orazi, V., Yong, D., Constantino, T. N., Lattanzio, J. C., Stancliffe, R. J., Angelou, G. C., Wylie-de Boer, E. C., & Grundahl, F. 2013, Nature, 498, 198
- Cannon (1993) Cannon, R. C. 1993, MNRAS, 263, 817
- Cassisi et al. (2008) Cassisi, S., Salaris, M., Pietrinferni, A., Piotto, G., Milone, A. P., Bedin, L. R., & Anderson, J. 2008, ApJ, 672, L115
- Chung et al. (2011) Chung, C., Yoon, S.-J., & Lee, Y.-W. 2011, ApJ, 740, L45
- Code & Welch (1979) Code, A. D. & Welch, G. A. 1979, ApJ, 228, 95
- Cosner et al. (1980) Cosner, K., Iben, Jr., I., & Truran, J. W. 1980, ApJ, 238, L91
- Cristallo et al. (2011) Cristallo, S., Piersanti, L., Straniero, O., Gallino, R., Domínguez, I., Abia, C., Di Rico, G., Quintini, M., & Bisterzo, S. 2011, ApJS, 197, 17
- Cristallo et al. (2009) Cristallo, S., Straniero, O., Gallino, R., Piersanti, L., Domínguez, I., & Lederer, M. T. 2009, ApJ, 696, 797
- Cunha et al. (2002) Cunha, K., Smith, V. V., Suntzeff, N. B., Norris, J. E., Da Costa, G. S., & Plez, B. 2002, AJ, 124, 379
- Cyburt et al. (2010) Cyburt, R. H., Amthor, A. M., Ferguson, R., Meisel, Z., Smith, K., Warren, S., Heger, A., Hoffman, R. D., Rauscher, T., Sakharuk, A., Schatz, H., Thielemann, F. K., & Wiescher, M. 2010, ApJS, 189, 240
- Da Costa et al. (2009) Da Costa, G. S., Held, E. V., Saviane, I., & Gullieuszik, M. 2009, ApJ, 705, 1481
- Da Costa & Marino (2011) Da Costa, G. S. & Marino, A. F. 2011, Publ. Astron. Soc. Aust., 28, 28
- Da Costa et al. (2013) Da Costa, G. S., Norris, J. E., & Yong, D. 2013, ApJ, 769, 8
- D’Antona et al. (2005) D’Antona, F., Bellazzini, M., Caloi, V., Pecci, F. F., Galleti, S., & Rood, R. T. 2005, ApJ, 631, 868
- D’Antona et al. (2002) D’Antona, F., Caloi, V., Montalbán, J., Ventura, P., & Gratton, R. 2002, A&A, 395, 69
- D’Antona et al. (2011) D’Antona, F., D’Ercole, A., Marino, A. F., Milone, A. P., Ventura, P., & Vesperini, E. 2011, ApJ, 736, 5
- D’Antona et al. (2010) D’Antona, F., Ventura, P., Caloi, V., D’Ercole, A., Vesperini, E., Carini, R., & Di Criscienzo, M. 2010, ApJ, 715, L63
- de Mink et al. (2009) de Mink, S. E., Pols, O. R., Langer, N., & Izzard, R. G. 2009, A&A, 507, L1
- De Smedt et al. (2012) De Smedt, K., Van Winckel, H., Karakas, A. I., Siess, L., Goriely, S., & Wood, P. R. 2012, A&A, 541, A67
- Decressin et al. (2007) Decressin, T., Charbonnel, C., & Meynet, G. 2007, A&A, 475, 859
- Decressin et al. (2009) Decressin, T., Charbonnel, C., Siess, L., Palacios, A., Meynet, G., & Georgy, C. 2009, A&A, 505, 727
- D’Ercole et al. (2010) D’Ercole, A., D’Antona, F., Ventura, P., Vesperini, E., & McMillan, S. L. W. 2010, MNRAS, 407, 854
- di Criscienzo et al. (2011) di Criscienzo, M., D’Antona, F., Milone, A. P., Ventura, P., Caloi, V., Carini, R., D’Ercole, A., Vesperini, E., & Piotto, G. 2011, MNRAS, 414
- D’Orazi et al. (2013) D’Orazi, V., Campbell, S. W., Lugaro, M., Lattanzio, J. C., Pignatari, M., & Carretta, E. 2013, MNRAS, 433, 366
- D’Orazi et al. (2011) D’Orazi, V., Gratton, R. G., Pancino, E., Bragaglia, A., Carretta, E., Lucatello, S., & Sneden, C. 2011, A&A, 534, A29
- Dupree & Avrett (2013) Dupree, A. K. & Avrett, E. H. 2013, ApJ, 773, L28
- Fenner et al. (2004) Fenner, Y., Campbell, S., Karakas, A. I., Lattanzio, J. C., & Gibson, B. K. 2004, MNRAS, 353, 789
- Frischknecht et al. (2012) Frischknecht, U., Hirschi, R., & Thielemann, F.-K. 2012, A&A, 538, L2
- Frost & Lattanzio (1996) Frost, C. A. & Lattanzio, J. C. 1996, ApJ, 473, 383
- Gallart et al. (2005) Gallart, C., Zoccali, M., & Aparicio, A. 2005, ARA&A, 43, 387
- Gallino et al. (1998) Gallino, R., Arlandini, C., Busso, M., Lugaro, M., Travaglio, C., Straniero, O., Chieffi, A., & Limongi, M. 1998, ApJ, 497, 388
- Goriely & Mowlavi (2000) Goriely, S. & Mowlavi, N. 2000, A&A, 362, 599
- Herwig (2005) Herwig, F. 2005, ARA&A, 43, 435
- Herwig et al. (2003) Herwig, F., Langer, N., & Lugaro, M. 2003, ApJ, 593, 1056
- Herwig et al. (2012) Herwig, F., VandenBerg, D. A., Navarro, J. F., Ferguson, J., & Paxton, B. 2012, ApJ, 757, 132
- Johnson & Pilachowski (2010) Johnson, C. I. & Pilachowski, C. A. 2010, ApJ, 722, 1373
- Johnson et al. (2009) Johnson, C. I., Pilachowski, C. A., Michael Rich, R., & Fulbright, J. P. 2009, ApJ, 698, 2048
- Johnson et al. (2008) Johnson, C. I., Pilachowski, C. A., Simmerer, J., & Schwenk, D. 2008, ApJ, 681, 1505
- Joo & Lee (2013) Joo, S.-J. & Lee, Y.-W. 2013, ApJ, 762, 36
- Kamath et al. (2012) Kamath, D., Karakas, A. I., & Wood, P. R. 2012, ApJ, 746, 20
- Karakas et al. (2010) Karakas, A. I., Campbell, S. W., & Stancliffe, R. J. 2010, ApJ, 713, 374
- Karakas et al. (2006) Karakas, A. I., Fenner, Y., Sills, A., Campbell, S. W., & Lattanzio, J. C. 2006, ApJ, 652, 1240
- Karakas et al. (2012) Karakas, A. I., García-Hernández, D. A., & Lugaro, M. 2012, ApJ, 751, 8
- Karakas & Lattanzio (2007) Karakas, A. I. & Lattanzio, J. C. 2007, Publ. Astron. Soc. Aust., 24, 103
- Karakas et al. (2002) Karakas, A. I., Lattanzio, J. C., & Pols, O. R. 2002, Publ. Astron. Soc. Aust., 19, 515
- Karakas et al. (2007) Karakas, A. I., Lugaro, M., & Gallino, R. 2007, ApJ, 656, L73
- Karakas et al. (2009) Karakas, A. I., van Raai, M. A., Lugaro, M., Sterling, N. C., & Dinerstein, H. L. 2009, ApJ, 690, 1130
- Kayser et al. (2006) Kayser, A., Hilker, M., Richtler, T., & Willemsen, P. G. 2006, A&A, 458, 777
- King et al. (2012) King, I. R., Bedin, L. R., Cassisi, S., Milone, A. P., Bellini, A., Piotto, G., Anderson, J., Pietrinferni, A., & Cordier, D. 2012, AJ, 144, 5
- Krause et al. (2013) Krause, M., Charbonnel, C., Decressin, T., Meynet, G., & Prantzos, N. 2013, A&A, 552, A121
- Lardo et al. (2012) Lardo, C., Milone, A. P., Marino, A. F., Mucciarelli, A., Pancino, E., Zoccali, M., Rejkuba, M., Carrera, R., & Gonzalez, O. 2012, A&A, 541, A141
- Lattanzio (1986) Lattanzio, J. C. 1986, ApJ, 311, 708
- Lattanzio & Lugaro (2005) Lattanzio, J. C. & Lugaro, M. A. 2005, Nuclear Physics A, 758, 477
- Lee et al. (2005) Lee, Y.-W., Joo, S.-J., Han, S.-I., Chung, C., Ree, C. H., Sohn, Y.-J., Kim, Y.-C., Yoon, S.-J., Yi, S. K., & Demarque, P. 2005, ApJ, 621, L57
- Lugaro et al. (2012) Lugaro, M., Karakas, A. I., Stancliffe, R. J., & Rijs, C. 2012, ApJ, 747, 2
- Marcolini et al. (2007) Marcolini, A., Sollima, A., D’Ercole, A., Gibson, B. K., & Ferraro, F. R. 2007, MNRAS, 382, 443
- Marigo & Aringer (2009) Marigo, P. & Aringer, B. 2009, A&A, 508, 1539
- Marino et al. (2012a) Marino, A. F., Milone, A. P., Piotto, G., Cassisi, S., D’Antona, F., Anderson, J., Aparicio, A., Bedin, L. R., Renzini, A., & Villanova, S. 2012a, ApJ, 746, 14
- Marino et al. (2009) Marino, A. F., Milone, A. P., Piotto, G., Villanova, S., Bedin, L. R., Bellini, A., & Renzini, A. 2009, A&A, 505, 1099
- Marino et al. (2011) Marino, A. F., Milone, A. P., Piotto, G., Villanova, S., Gratton, R., D’Antona, F., Anderson, J., Bedin, L. R., Bellini, A., Cassisi, S., Geisler, D., Renzini, A., & Zoccali, M. 2011, ApJ, 731, 64
- Marino et al. (2014) Marino, A. F., Milone, A. P., Przybilla, N., Bergemann, M., Lind, K., Asplund, M., Cassisi, S., Catelan, M., Casagrande, L., Valcarce, A. A. R., Bedin, L. R., Cortés, C., D’Antona, F., Jerjen, H., Piotto, G., Schlesinger, K., Zoccali, M., & Angeloni, R. 2014, MNRAS, 437, 1609
- Marino et al. (2012b) Marino, A. F., Milone, A. P., Sneden, C., Bergemann, M., Kraft, R. P., Wallerstein, G., Cassisi, S., Aparicio, A., Asplund, M., Bedin, R. L., Hilker, M., Lind, K., Momany, Y., Piotto, G., Roederer, I. U., Stetson, P. B., & Zoccali, M. 2012b, A&A, 541, A15
- McWilliam et al. (2013) McWilliam, A., Wallerstein, G., & Mottini, M. 2013, ApJ, 778, 149
- Milone et al. (2008) Milone, A. P., Bedin, L. R., Piotto, G., Anderson, J., King, I. R., Sarajedini, A., Dotter, A., Chaboyer, B., Marín-Franch, A., Majewski, S., Aparicio, A., Hempel, M., Paust, N. E. Q., Reid, I. N., Rosenberg, A., & Siegel, M. 2008, ApJ, 673, 241
- Nataf & Gould (2012) Nataf, D. M. & Gould, A. P. 2012, ApJ, 751, L39
- Nataf et al. (2011) Nataf, D. M., Udalski, A., Gould, A., & Pinsonneault, M. H. 2011, ApJ, 730, 118
- Norris (2004) Norris, J. E. 2004, ApJ, 612, L25
- Norris & Da Costa (1995) Norris, J. E. & Da Costa, G. S. 1995, ApJ, 447, 680
- Pancino et al. (2011a) Pancino, E., Mucciarelli, A., Bonifacio, P., Monaco, L., & Sbordone, L. 2011a, A&A, 534, A53
- Pancino et al. (2011b) Pancino, E., Mucciarelli, A., Sbordone, L., Bellazzini, M., Pasquini, L., Monaco, L., & Ferraro, F. R. 2011b, A&A, 527, A18
- Pasquini et al. (2011) Pasquini, L., Mauas, P., Käufl, H. U., & Cacciari, C. 2011, A&A, 531, A35
- Piersanti et al. (2013) Piersanti, L., Cristallo, S., & Straniero, O. 2013, ApJ, 774, 98
- Pignatari et al. (2010) Pignatari, M., Gallino, R., Heil, M., Wiescher, M., Käppeler, F., Herwig, F., & Bisterzo, S. 2010, ApJ, 710, 1557
- Piotto et al. (2005) Piotto, G., Villanova, S., Bedin, L. R., Gratton, R., Cassisi, S., Momany, Y., Recio-Blanco, A., Lucatello, S., Anderson, J., King, I. R., Pietrinferni, A., & Carraro, G. 2005, ApJ, 621, 777
- Prantzos et al. (2007) Prantzos, N., Charbonnel, C., & Iliadis, C. 2007, A&A, 470, 179
- Renzini (2008) Renzini, A. 2008, MNRAS, 391, 354
- Roederer et al. (2011) Roederer, I. U., Marino, A. F., & Sneden, C. 2011, ApJ, 742, 37
- Romano & Matteucci (2007) Romano, D. & Matteucci, F. 2007, MNRAS, 378, L59
- Shingles & Karakas (2013) Shingles, L. J. & Karakas, A. I. 2013, MNRAS, 431, 2861
- Simpson & Cottrell (2013) Simpson, J. D. & Cottrell, P. L. 2013, MNRAS, 433, 1892
- Simpson et al. (2012) Simpson, J. D., Cottrell, P. L., & Worley, C. C. 2012, MNRAS, 427, 1153
- Smith et al. (2000) Smith, V. V., Suntzeff, N. B., Cunha, K., Gallino, R., Busso, M., Lambert, D. L., & Straniero, O. 2000, AJ, 119, 1239
- Sollima et al. (2005) Sollima, A., Pancino, E., Ferraro, F. R., Bellazzini, M., Straniero, O., & Pasquini, L. 2005, ApJ, 634, 332
- Stanford et al. (2010) Stanford, L. M., Da Costa, G. S., & Norris, J. E. 2010, ApJ, 714, 1001
- Stanford et al. (2006) Stanford, L. M., Da Costa, G. S., Norris, J. E., & Cannon, R. D. 2006, ApJ, 647, 1075
- Stanford et al. (2007) —. 2007, ApJ, 667, 911
- Sterling & Dinerstein (2008) Sterling, N. C. & Dinerstein, H. L. 2008, ApJS, 174, 158
- Straniero et al. (1997) Straniero, O., Chieffi, A., Limongi, M., Busso, M., Gallino, R., & Arlandini, C. 1997, ApJ, 478, 332
- Sweigart (1987) Sweigart, A. V. 1987, ApJS, 65, 95
- Truran & Iben (1977) Truran, J. W. & Iben, Jr., I. 1977, ApJ, 216, 797
- Valcarce & Catelan (2011) Valcarce, A. A. R. & Catelan, M. 2011, A&A, 533, A120
- Valcarce et al. (2012) Valcarce, A. A. R., Catelan, M., & Sweigart, A. V. 2012, A&A, 547, A5
- van Raai et al. (2012) van Raai, M. A., Lugaro, M., Karakas, A. I., García-Hernández, D. A., & Yong, D. 2012, A&A, 540, A44
- Vanture et al. (1994) Vanture, A. D., Wallerstein, G., & Brown, J. A. 1994, PASP, 106, 835
- Vassiliadis & Wood (1993) Vassiliadis, E. & Wood, P. R. 1993, ApJ, 413, 641
- Ventura & D’Antona (2009) Ventura, P. & D’Antona, F. 2009, A&A, 499, 835
- Villanova et al. (2007) Villanova, S., Piotto, G., King, I. R., Anderson, J., Bedin, L. R., Gratton, R. G., Cassisi, S., Momany, Y., Bellini, A., Cool, A. M., Recio-Blanco, A., & Renzini, A. 2007, ApJ, 663, 296
- Yong et al. (2009) Yong, D., Grundahl, F., D’Antona, F., Karakas, A. I., Lattanzio, J. C., & Norris, J. E. 2009, ApJ, 695, L62
- Yoon et al. (2008) Yoon, S.-J., Joo, S.-J., Ree, C. H., Han, S.-I., Kim, D.-G., & Lee, Y.-W. 2008, ApJ, 677, 1080