Early X-ray emission from Type Ia supernovae originating from symbiotic progenitors or recurrent novae
Abstract
One of the key observables for determining the progenitor nature of Type Ia supernovae is provided by their immediate circumstellar medium, which according to several models should be shaped by the progenitor binary system. So far, X-ray and radio observations indicate that the surroundings are very tenuous, producing severe upper-limits on the mass loss from winds of the progenitors. In this study, we perform numerical hydro-dynamical simulations of the interaction of the SN ejecta with circumstellar structures formed by possible mass outflows from the progenitor systems and we estimate numerically the expected numerical X-ray luminosity. We consider two kinds of circumstellar structures: a) A circumstellar medium formed by the donor star’s stellar wind, in case of a symbiotic binary progenitor system; b) A circumstellar medium shaped by the interaction of the slow wind of the donor star with consecutive nova outbursts for the case of a symbiotic recurrent nova progenitor system. For the hydro-simulations we used well-known Type Ia supernova explosion models, as well as an approximation based on a power law model for the density structure of the outer ejecta. We confirm the strict upper limits on stellar wind mass loss, provided by simplified interpretations of X-ray upper limits of Type Ia supernovae. However, we show that supernova explosions going off in the cavities created by repeated nova explosions, provide a possible explanation for the lack of X-ray emission from supernovae originating from symbiotic binaries. Moreover, the velocity structure of circumstellar medium, shaped by a series of nova explosion matches well with the Na absorption features seen in absorption toward several Type Ia supernovae.
keywords:
hydrodynamics – supernovae: general – novae, cataclysmic variables1 Introduction
Despite decades of research, the exact nature of the type Ia supernova (SN Ia) progenitors remains unknown, making it one of the key unsolved problems in stellar evolution. This lack of basic information regarding SNe Ia is quite remarkable, given that SNe Ia are cosmological standard candles, which have provided key evidence that the expansion of the Universe is accelerating (Perlmutter et al., 1998; Garnavich et al., 1998), and given the importance of SNe Ia for the chemical evolution of the Universe, as they are a dominant source of iron-group elements (Kauffmann, White & Guiderdoni, 1993).
There is a consensus that SNe Ia are the thermonuclear explosions of CO white dwarfs (WDs, Bloom et al., 2012), but within this framework there are two main scenarios for the progenitor binary systems that may lead to such explosions: 1) the single-degenerate scenario (SD, Whelan & Iben 1973) and 2) the double-degenerate scenario (DD, Iben & Tutukov 1984; Webbink 1984). In the SD scenario, a CO WD accretes hydrogen-rich or helium-rich material from a non-degenerate companion star. The companion could be either a main-sequence (MS) or a near main-sequence star in a close binary, or a star in the red giant branch (RG) or in the asymptotic giant branch (AGB) in a wider binary, called symbiotic systems. In the DD scenario, two CO WDs in a binary system are brought together by the loss of angular momentum through the emission of gravitational radiation, after which they merge. Population synthesis studies of SN Ia suggest that the total population contains a mixture of these two possible scenarios, with the prompt channel mainly populated by SD progenitors, while the delayed channel mainly populated by DD progenitors (e.g. Greggio, 2010; Claeys et al., 2014).
In order to test both scenarios, various studies have been done, which can be divided into two categories: a) directly observing the progenitor system or its left-overs; b) indirectly, by observing the effects of the interaction of the SN with its surrounding. The direct methods include the detection of progenitor systems, either through the X-ray emission that accompanies the accretion process (Voss & Nelemans, 2008), or by the identification of the donor star itself (Maoz & Mannucci, 2008), either in archival pre-explosion images, or by searching for the surviving donor star in the centres of SN Ia supernova remnants (SNRs, Ruiz-Lapuente et al., 2004; Kerzendorf et al., 2009; Schaefer & Pagnotta, 2012). While these methods could provide strong constraints on the properties of the progenitor system, the method can only be applied to nearby galaxies. These methods, therefore, provide limited statistics. In contrast, the indirect methods are applicable to a larger number of SNe Ia, although the information they provide is related to the ambient medium in which the explosion occurs, rather than the progenitor system itself.
A promising indirect method is the study of the interaction of the SN blast wave with the ambient medium in which it expands. Considering the DD scenario, for which the components of the binary are two WDs, it is generally expected that the ambient medium has been little affected by the progenitor system. However, recently it has been suggested that circumstellar structures are also possible to be formed in the DD regime, either through successively nova explosions prior the the final merger (Shen, Guillochon & Foley, 2013), or by the common envelope if the latter was ejected in the recent past of the SN Ia explosion (Pakmor et al., 2013; Livio & Riess, 2003).
In contrast, for the SD scenario, substantial mass outflows are possible, either from the wind of the secondary star, or from outflows accompanying the accretion process, such as WD accretion winds (Hachisu, Kato & Nomoto, 1996) or nova explosions (Sokoloski et al., 2006). These various outflow mechanisms will modify the circumstellar medium (CSM) substantially. The subsequent SN Ia will interact with this modified CSM and the result of the SN Ia/CSM interaction will be reflected in the optical, UV/X-ray and radio emission.
The study of SN Ia/CSM interactions has, so far, provided contradicting results. On the one hand several SN Ia show variable, blueshifted, sodium absorption lines (Patat et al., 2007; Dilday et al., 2012; Sternberg et al., 2011), indicating that the SNe Ia were surrounded by some sort of dense expanding shell(s). However, studies directed at identifying the interaction of SN Ia blast waves with CSM modified by the stellar winds of the companions show negative results. Stellar winds result in a density profile that scales as , with the distance from the wind source. This means that, in the early phase of the explosion, strong emission is expected caused by the interaction of the blast wave with the dense, inner regions of the wind. This emission has not yet been detected in the optical (Mattila et al., 2005), radio (Panagia et al., 2006; Chomiuk et al., 2012) and X-rays (Immler et al. 2006, Russell & Immler 2012), providing strong constraints on the stellar wind mass-loss parameters. For example, Mattila et al. (2005) presented early time high-resolution and late time low-resolution optical spectra of the SN Ia, SN 2001el, and derived an upper limit for the mass-loss rate of the companion of and for wind velocities of and respectively. Panagia et al. (2006) performed radio surveys of 27 SNe Ia with VLA and derived an upper limit of . The most constraining limit comes from the recent nearby SN Ia, SN 2011fe,111 While finishing this paper news broke out of a new nearby Type Ia supernova SN2014J, in M82. This supernova will likely provide even more stringent upper limits, or as we would hope a detection of radio and/or X-ray emission. for which the lack of radio emission in the early phase implies an upper limit on the wind parameters of for a wind velocity of km s-1(Chomiuk et al., 2012). Russell & Immler (2012) considered 53 SNe Ia observed with Swift X-ray Telescope, and their upper limit was , based on a simple model for the X-ray emission resulting from a blast-wave-wind interaction. Together these results exclude massive or evolved companions as donor stars, such as expected in the symbiotic system scenario. But they do agree with small or main-sequence companions, or with double degenerate systems.
However, the circumstellar structure around the SN Ia could substantially deviate from a density profile, because of other mass outflow mechanisms, emanating from the progenitor system, e.g. nova explosions. It has been shown that, in contrast with classical novae, where the WD mass is decreasing after every nova outburst, recurrent novae (RNe) may eventually result in SN Ia explosions, as the WD is steadily increasing its mass (Hachisu & Kato, 2001). These symbiotic RNe systems appear to be promising SN Ia progenitors, with the most famous example of potential SN Ia progenitor being the nova RS Oph (Patat et al., 2011), whereas an example of a supernova originating from such a system being PTF 11kx (Dilday et al., 2012), which shows evidence for surrounding nova shells. Moreover, Wood-Vasey & Sokoloski (2006) have proposed that prior to the SN 2002ic explosion, a nova shell from the RN progenitor system created an evacuated region around the explosion centre.
In this study, we report on our numerical hydrodynamic studies of single-degenerate SN Ia explosions and their interactions with the CSM shaped by either progenitor winds and/or recurrent nova shells. In Sect. 2 we investigate the mechanism of the early X-ray emission for a SN Ia interacting with CSM formed by the donor star’s stellar wind in a symbiotic binary progenitor system. We calculate the expected numerical luminosity of the X-rays and we re-evaluate previous studies on the specific energy band. In Sect. 3 we discuss the symbiotic recurrent nova system and we develop a model for the structure of the CSM shaped by consecutive nova outbursts. Moreover, we calculate the expected numerical luminosities of a SN Ia occurring in such a circumstellar structure. In Sect. 4, we discuss the implications of our study, verifying the X-ray upper limits in the case of the symbiotic progenitor system, and providing a physical explanation regarding the non-detection of the thermal X-rays in the case of a symbiotic recurrent nova progenitor system. In Sect. 5 we summarise our results.
2 The early X-ray emission
We model the X-ray radiation during the early SN phase (150 days after the explosion) considering that the SN is expanding inside a wind bubble, shaped by the stellar wind of the donor star. As such this study is a refinement of the model of Immler et al. (2006), who used some approximations for the blast wave properties and the X-ray emission resulting from the blast-wave/CSM interactions.
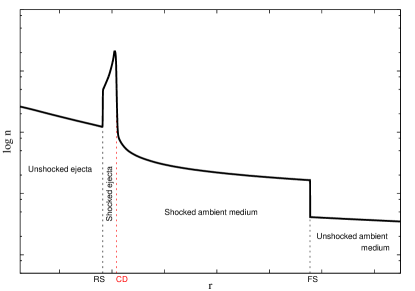
The general structure of a SN that expands in such an environment is illustrated in Fig. 1. From the centre outward we have: a) the freely expanding material ejected by the SN, b) the shocked ejecta shell, in which the ejected material is slowed down by the reverse shock, c) a contact discontinuity that separates the shocked ejecta material from the shocked ambient-medium material, d) the forward shock, which propagates supersonically into the undisturbed ambient medium, and e) the unshocked ambient medium.
In this kind of configuration, X-rays are expected to be emitted from the region between the reverse and the forward shock, as there the plasma has been heated and compressed by the two shocks. The X-ray luminosity, , is
| (1) |
where , are respectively the electron and ion number density of the shocked plasma, is the cooling function in X-rays of the plasma with composition and temperature , and is the volume of the emitting material.
In the stellar wind scenario, the density of the unshocked wind is given by , where is the mass-loss rate of the donor star, the terminal velocity of the stellar wind and is the distance from the mass losing object. Immler et al. (2006) studied the early X-ray properties of eight well observed SNe Ia aiming to find traces of such a SN - stellar wind interaction. To correlate the observed X-ray emission with the stellar wind properties of the donor star the authors made the following assumptions. They considered that the blast wave is moving with a velocity of (Chevalier & Fransson, 2006), shock-heating the stellar wind to a constant temperature of . For the 0.3-2 keV X-ray emission they assumed a constant cooling function of (Fransson, Lundqvist & Chevalier, 1996). Substituting this in Eq. 1, they obtained for the X-ray emission from the shocked stellar wind shell
| (2) |
where is the mean mass per particle ( for a H+He plasma).
Finally, they considered that the X-ray luminosity of the shocked ejecta is 30 times higher than that of the shocked-wind shell (Chevalier & Fransson, 2006). Using the possible detection of early X-ray emission from SN 2005ke in the 0.3 - 2 keV band, they estimated the mass-loss rate of the progenitor’s system to be , assuming a terminal velocity of the stellar wind equal to . None of the other seven SNe Ia was detected in X-rays, and thus, they placed this mass loss estimation as the upper limit that a donor star can have.
2.1 Hydrodynamical Simulations
In order to refine the estimates of Immler et al. (2006) and Russell & Immler (2012), we performed numerical simulations, using the hydrodynamic code AMRVAC (Keppens et al., 2003). AMRVAC solves the Euler equations in the conservative form, using an adaptive mesh refinement strategy, in order to refine the grid at specific positions, where large gradients in density and energy appear.
We performed calculations on an one dimensional (1D) grid, with a radial span of , assuming spherical symmetry. On the base level we used 540 grid cells and we allowed for seven refinement levels, at which of each the resolution is doubled. As a result, the maximum effective resolution becomes .
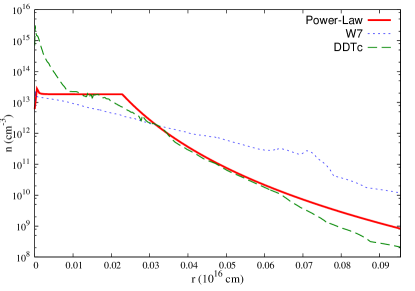
We filled the grid with a density profile, representing the cold stellar wind bubble of the donor star . We performed our calculations, using the wind parameters that Immler et al. (2006) have derived, so the wind bubble density is described as with and . At the inner boundary of the grid, we introduced the SN ejecta. For our modelling we use three different SN Ia ejecta profiles. Firstly, we used a power-law density profile with index , with and . The specific density distribution is widely used for SN Ia studies (Chevalier, 1982). In addition, we used two more ejecta density distributions, derived from two SN Ia explosion models: the W7 model (Nomoto, Thielemann & Yokoi, 1984), a carbon deflagration model; and the DDTc model (Bravo & García-Senz, 2006), a delayed detonation model. The initial ejecta density distributions are presented in Fig. 2. We advanced the supernova calculations for a time interval corresponding to 150 days. AMRVAC provides all the thermodynamical properties of the resulted SN structure, for selected snapshots in time. Moreover, we implemented a routine in order to locate the position of the reverse shock, the forward shock and the contact discontinuity. This was achieved by taking into account the Rankine-Hugoniot jump conditions and by introducing so-called composition tracers, in order to distinguish, as the system advances, the ejecta from the circumstellar material. The outcome of the specific routine is the positions of the shocks and the contact discontinuity as a function of time.
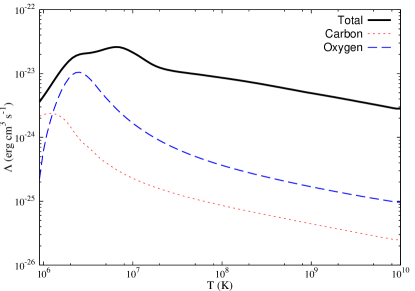
Following the procedure developed by Schure et al. (2009), we constructed new cooling curves at the energy band where the observations of Immler et al. (2006) have been conducted. We used the SPEX package, version 2.03.03 (Kaastra, Mewe & Nieuwenhuijzen, 1996), in order to calculate the emissivity of a plasma, assuming collisional ionisation equilibrium. We calculated spectra for a logarithmic grid of temperatures from to , with a step of , assuming solar abundances. The cooling curves are presented in Fig. 3. The emissivity is calculated by integrating the spectrum over the desired energy range of . We have also calculated the contribution of the different elements at the cooling function, in order to be able to construct cooling curves of the shocked ejecta for each studied model.
For the SN evolution modelling, we incorporated our cooling curves to the hydrodynamical simulations. For the CSM, we assumed solar metallicity, whereas for the shocked ejecta the chemical composition was directly obtained from the explosion models. For the power-law density-distribution model, we assumed a chemical composition of C-O at 50% each222 Since our study concerns the early phase of SN evolution we assumed that only the unprocessed, outer layers of the WD have been heated by the reverse shock.. The electron density is calculated by assuming that the plasma is fully ionised.
The X-ray luminosity is given by
| (3) |
where is the luminosity from the shocked ejecta, is the luminosity from the shocked CSM, and the subscripts , , refer to the radius of the reverse shock, the contact discontinuity and the forward shock respectively.
2.2 Results of the hydrodynamical models for SN-wind interactions
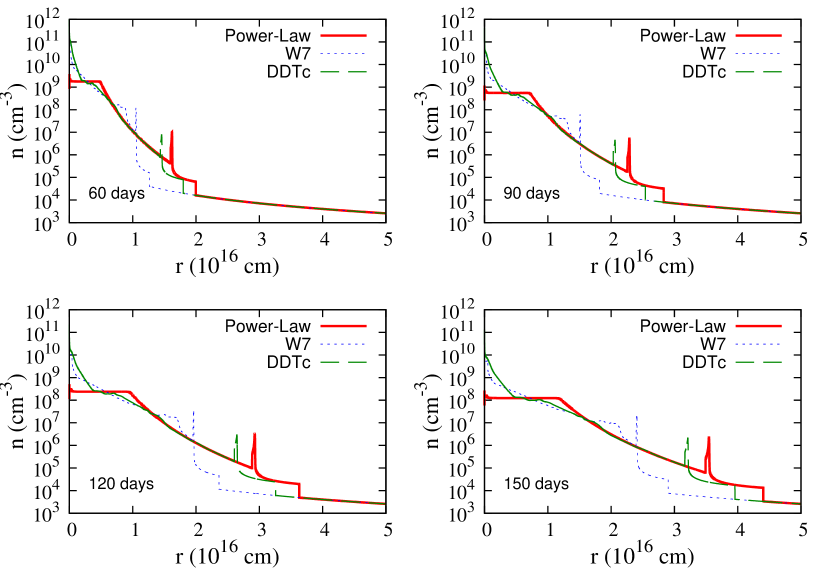
Fig. 4 shows four snapshots of the SN evolution at . As the SN evolves, the densities of the shocked ejecta and the shocked CSM decrease, while each model expands in the wind bubble with a different velocity. Note the quite different evolution of the W7 explosion model, compared with the power-law and the DDTc models.
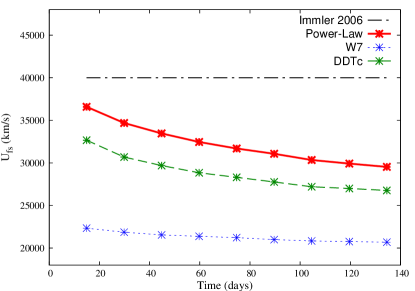
Fig. 5 shows the time evolution of the forward shock velocity. From this plot, it is clear that the assumption of a constant shock velocity of by Immler et al. (2006) overestimates the shock velocity as compared to our more detailed numerical calculations. Moreover, in the numerical simulations the shock velocity is not constant, but decreases as a function of time.
Table 1 lists the temperatures of the shocked CSM, the values of the (averaged) cooling function, the luminosity of the shocked CSM and the ratio of both the numerical calculations and the values obtained by Immler et al. (2006).
| Immler | ||||
|---|---|---|---|---|
| Power-Law | ||||
| W7 | ||||
| DDTc |
Based on our calculations, and depending on the explosion model we used, we find that the assumption for the temperature of the shocked CSM is an underestimation, since the numerical simulations indicate values that are an order of magnitude higher. For the cooling function, we find values , which are an order of magnitude lower than Immler et al. (2006). The same deviation, an order of magnitude lower, is found for the luminosity of the shocked CSM. As for the ratio , we find that the assumption of is an underestimation, as we find values .
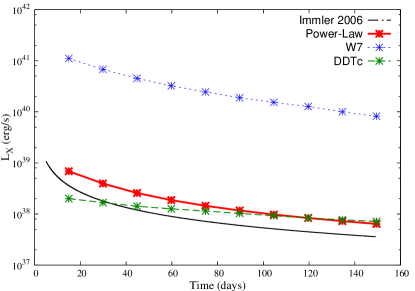
Fig. 6 shows the total X-ray luminosities expected from the early phase of SN Ia, as a function of time. It is clear that, although we found deviations in our numerical results, regarding the assumptions made by Immler et al. (2006), eventually the total luminosity calculated in our models is similar for the DDTc and power law models and even higher for the W7 model. This similarity can be explained by taking into account the re-evaluation of the assumptions made by the authors. The total overestimation of the the cooling function and the luminosity of the shocked CSM is in the range of two orders of magnitude and is cancelled by the underestimation of .
3 Symbiotic Nova systems
Nova explosions are the result of thermonuclear runaway outbursts of the WD’s surface material, for those cases in which the accreted material does not burn steadily, but builds up over time. Theoretical studies show that the nova outburst properties, such as ejecta mass, ejecta composition and nova recurrence time, depend on the mass and temperature of the accreting WD, the composition of the accreted material, and the mass accretion rate (Yaron et al., 2005; Townsley & Bildsten, 2004). Novae with more than one recorded outburst are called recurrent novae (RNe). The RNe systems consist of a WD with mass close to the Chandrasekhar limit () which accretes mass from its companion with a rate of () (Livio & Truran, 1992; Yaron et al., 2005).
The binaries that host recurrent novae have been considered to be possible SNe Ia progenitors (Hachisu & Kato, 2001; Wood-Vasey & Sokoloski, 2006) as in these systems the WD mass appears to be increasing. RNe can occur in both short period binaries (cataclysmic variables RNe, e.g. T Pyx) and in long period binaries (symbiotic RNe, e.g. RS Oph). In the latter case the donor star is a RG or an AGB. The resulting CSM around symbiotic RNe (SyRNe) is shaped by the interaction of the continuous slow wind, emanating for the donor star, with the periodical, fast moving nova ejecta.
Wood-Vasey & Sokoloski (2006) suggested that the lack of X-ray emission at the early SNe Ia phase is consistent with a SyRNe progenitor for which the fast moving nova shells sweep up the dense wind material and form a low density cavity around the binary system. Consequently, a low X-ray luminosity is expected from SN Ia resulting from these systems, as the blast wave of the SN Ia explosion, during the early phase, will interact with this low density environment, rather than with the dense CSM formed by the donor’s stellar wind.
In this section, we investigate whether the suggestion of Wood-Vasey & Sokoloski (2006) is feasible. For this purpose we simulate the CSM formed by SyRNe and we calculate the X-ray luminosity of the subsequent SNe Ia that are evolving in such SyRNe modified CSM.
3.1 Hydrodynamical Simulations
3.1.1 Symbiotic recurrent novae
We performed calculations on an 1D grid, with a radial span of , assuming spherical symmetry. At the base level we used 540 grid cells and we allowed for eight refinement levels, with each refinement doubling the resolution. As a result, the maximum effective resolution is .
Firstly, we simulated the CSM that is formed due to nova outbursts, interacting with the wind of the donor star. The final outcome depends on the wind properties () and the RNe mass, energy and recurrence time. We used the wind parameters derived as upper limits by Immler et al. (2006) (, ) , in order to enable an easy comparison with a wind-only CSM. The wind is simulated by a continuous inflow at the inner boundary of the grid with density and momentum per unit mass .

In this grid we periodically introduce the nova ejecta, at the inner boundary, and we let it evolve. The nova ejecta mass is given by , where the mass accretion rate, the novae recurrence time and the fraction of the ejected mass over the accreted one. As for the case of RNe the WD increases its mass, . Considering that the RNe recurrence time is of the order of 10 -100 yr, while the novae outburst occur for M, we get M⊙. The ejecta mass of the 2006 outburst of RS Oph was measured to be M⊙ (Sokoloski et al., 2006; Hachisu, Kato & Luna, 2007). In this work we use . For the RNe explosion energy we adopt the value of Orlando & Drake (2012), estimated for the the 2010 outburst of V407 Cyg: erg. Finally, we describe the nova ejecta with a constant density profile and a homologous velocity profile ( ). Although this ejecta profile description is simplified, we claim that it does not affect the final outcome of our simulation as due to the low mass nova ejecta, the RN evolves to the Sedov - Taylor phase few days after the explosion (Moore & Bildsten, 2012; Sokoloski et al., 2006). In this phase the evolution of the novae have lost any information about the initial properties of the ejecta.
Figure 7 depicts four snapshots of the nova cavity evolution in a SyRNe system. In this simulation we considered a nova recurrence time of 100 yr and we let the system advance for 1000 years. The first nova explosion occurs and evolves in the dense wind bubble. Due to the low mass of the nova ejecta and the high density of the CSM, the nova passes to the Sedov - Taylor phase just one day after the explosion and in eleven days at the momentum driven phase. Due to the efficient cooling the shocked CSM collapses in a very thin shell, while the following nova ejecta has been homogenized as the nova reverse shock has reach the explosion centre. A similar initial evolution is expected to be followed by the second nova explosion, as at the beginning the shock wave propagates in the dense wind that in the meanwhile has partially filled the cavity formed by the first nova. However, year later the nova forward shock penetrates the dense wind bubble and starts to propagate into the low density cavity formed by the first nova. Consequently, when the forward shock reaches the cavity it accelerates while the shocked wind shell expands in order to retain the pressure equilibrium. Then the nova is moving with a constant velocity as the swept up mass of the nova cavity is negligible. Inevitably, the second nova shell will collide with the first one. Due to this collision a reflected shock is formed which is propagating inwards - in the free expanding nova ejecta rest frame - till it will be swept up by the following nova. This process is repeated for all the subsequent nova explosions. In the final snapshot of our simulation (bottom right of Fig. 7), six of the total nine nova shells have collided and merged with the edge of the cavity while the remaining three are still evolving in the cavity.

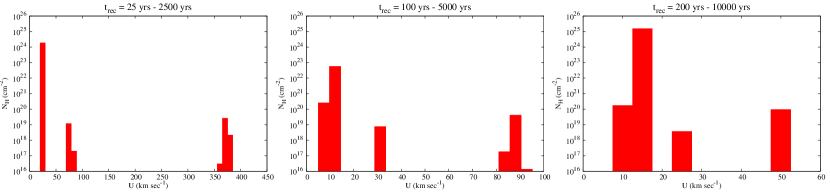
Fig. 8 (upper row) shows a more evolved nova cavity in a SyRNe system. To test the dependence of the CSM structure on the recurrence time, we consider three cases: 25, 100 and 200 yr. We advanced the system for 2500, 5000 and 10000 years allowing for the formation and evolution of 99, 49 and 49 subsequent novae, respectively. The general shape of the CSM is similar to that of Fig. 7. Most of the novae have reached and collided with the edge of the nova cavity while the rest are still evolving with a constant velocity, into the low density medium, forming separate shells of shocked-wind material. The densities in between the nova shells are tenuous - compared to the nova shells - in the order of .
The nova recurrence time does not affect the general properties of the CSM. However, increasing the recurrence time, more wind material is entered into the cavity till the next outburst will occur. As a result, each nova sweeps up more wind material leading to a CSM characterized by more massive shells which are moving with lower velocities as compared to the cases with lower recurrence time. The cavity itself evolves slower due to the high swept up mass and the more efficient radiation losses from the dense shell material. For these simulations, the cavities extend from (), up to (). The plasma velocity is ranging from up to , depending on the recurrence time of the simulation.
3.1.2 SN evolution in the nova cavity and its X-ray emission
Having established the general structure of the CSM formed by a SyRN progenitor, we introduce the SN Ia ejecta in the inner boundary of the grid depicted in Fig. 7. The evolution of the supernova blast-wave is similar for the three recurrence times investigated. For illustrative purposes we limit ourselves here to the nova shells created by a nova with a recurrence time of = 100 yr. For our calculations, we choose a small grid size of while we advanced the SyRN system up to one thousand years. Although the SyRNe phase of Type Ia progenitors last up to yr revealing thousands to tens of thousands novae outbursts (Hachisu, Kato & Nomoto, 2008), we show in the previous section that the CSM properties close to the explosion centre are not appreciable affected by the number of nova explosions and the time of the nova cavity evolution. Thus, without loss of generality, a small grid size allows us to resolve the inner structure of the supernovae with sufficient detail without being too computational expensive. The maximum, effective resolution we get is .
The SN Ia ejecta density distribution is described by a power law with index , assuming a chemical composition of C-O at 50% each. As shown in Sect. 2, this model is quite comparable with the DDTc model. Similarly to the models described in section 2, we calculated the expected X-ray luminosity of a SN Ia evolving in such a SyRNe modified CSM. The outer edge of the SN ejecta is at cm, corresponding to a starting time for the calculations of days after the explosion.
We used two possible CSM structures, representing two extreme cases. For ‘Case 1’ we advanced the SyRN system for 910 yr, and describes the case in which the nova explosion occurred right before the SN Ia. In this configuration, the donor star’s stellar wind had too little time (10 years) to start filling the cavity and the innermost CSM is described by the low density nova ejecta . For ‘Case 2’, the SyRNe’s outflows were evolving for 1000 yr. Therefore, the SN explosion occurred just before the subsequent nova explosion. In this case, the wind has been filling the cavity for 100 years, so the SN Ia will first interact with material originating from the donor star’s stellar wind. In Fig. 9, the initial density distribution for the two cases is illustrated. For Case 1, the SN will first interact with the small wind bubble of radius , and then expand in the low dense nova cavity. For Case 2 the radius of the wind bubble is .
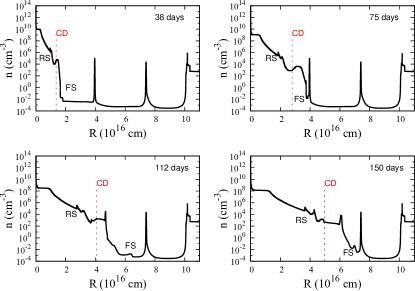
The evolution of the SN, for the Case 1 and Case 2, is shown in Fig. 10 and Fig. 11 respectively. For Case 1 (Fig. 10), at the time of the SN Ia explosion, the first nova shell is located at a distance of , and the SN Ia starts interacting with this shell at . The collision of the SN Ia blast wave with the nova shell forms a pair of reflected and transmitted shocks, which are propagating inward and outward respectively in the local plasma’s rest frame. At , the forward shock of the SN Ia reaches the second nova shell, located at distance . Our simulation ends at , just before the SN Ia interacts with the third nova shell.
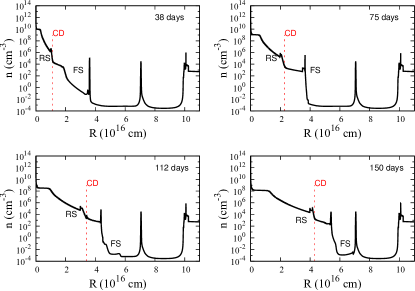
For Case 2 (Fig. 11), the SN Ia occurs just before the last nova explosion (at time of the simulation depicted in Fig. 7). The wind has filled the cavity for 100 years and its termination shock is located at . When the SN Ia occurs, it interacts with this wind bubble density profile, and it overcomes it within 10 days. The first nova shell is located at . It is reached by the forward shock at . This collision creates a reflected shock that reaches the shocked ejecta shell at .
Fig. 12 shows the total expected numerical X-ray luminosities as a function of time, for the Case 1 and 2 described above. In order to calculate more precisely the expected luminosities, we used a smaller time interval than the work that we performed in section 2. The luminosities are calculated every 1.5 days, and an interpolation scheme using of natural smoothing splines has been applied. The total expected numerical X-ray luminosity derived for a power law SN ejecta profile ejecta evolving in the stellar wind (Sect. 2) is also presented for comparison.
For Case 1, the luminosity at the start is decreasing, from down to . At time , the luminosity starts to increase, up to , reaching a maximum around , and then starts to decrease again, up to . This transition period at time until marks the time when the SN blast wave collides with the first nova shell and the reflected shock formed by this collision propagates inward heating the shocked ejecta and thus increasing its luminosity.
For Case 2, the luminosity is initially similar to the wind-only model, as the blast-wave interacts with the donor wind filling the nova cavity. But the luminosity rapidly decreases as the blast wave reaches the end of the wind, entering the nova cavity. As a result the luminosity decreases from down to .
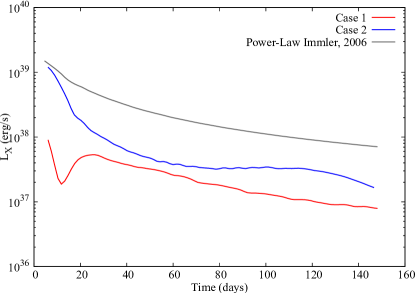
In general, the extracted luminosities of the SN Ia/SyRNe models reveal a more complex and non-monotonous function with time as compared to these of the SN Ia/wind models and they strongly depends on the time delay between the last nova and the SN Ia. However, for both Case 1 and Case 2 - which represent the two extreme cases of this time delay - the SN Ia/SyRNe luminosity is at least one order of magnitude lower that this of the SN Ia/wind model. Thus, we conclude that the non-detection of X-rays following SN Ia explosions can potentially be explained by a relatively low density environment caused by nova outbursts.
4 Discussion
In Sect. 2, we performed numerical calculations in order to investigate the thermal X-ray emission due to interaction of the SN Ia blast wave with CSM formed by the donor star’s stellar wind. We found that even though the assumptions made by Immler et al. (2006) deviate from the numerical results, eventually the total luminosities extracted from our model are similar, or higher, depending on the choice of the explosion model. Thus, our work verifies the existing constraints on the mass loss rate of the donor star ( ) or even imposes stricter limits in the case of the W7 deflagration model. Such a result excludes an evolved RG/AGB companion stars, in the SD regime, but allows a main-sequence donor star, which stellar wind is much more tenuous (, ). Moreover, a double degenerate white dwarf system is also not excluded, as long as the ejection of the common envelope (CE) occurred well before the final merger of the two WDs, leaving a ‘clean’ environment around the explosion centre.
In Sect. 3, we simulated the interaction of a SN Ia with the CSM shaped by the mass outflows of a SyRNe system. The motivation for this simulation was the suggestion of Wood-Vasey & Sokoloski (2006) that a nova explosion that occurred before the SN Ia, creates an evacuated region around the explosion centre and therefore can naturally explain the lack of X-ray emission at the early SN Ia phase. In addition, SyRNe systems have been proposed as viable candidates of SNe Ia progenitors (Mikołajewska, 2013; Dilday et al., 2012; Patat et al., 2011) and thus it is worthwhile to investigate if these systems are aligned with the X-ray observations of SNe Ia. The outcome of our work is that nova outbursts are capable of creating a low dense ambient medium in which the subsequent SN Ia evolution is not detectable in X-rays.
4.1 Similarities of SyRNe CSM with observed SNe Ia
Although our intention was not to model any specific SN Ia, and our approach of modelling a SN Ia explosion in a SyRNe system is somewhat simplified (see Mohamed, Booth & Podsiadlowski 2013, for a detailed 3D simulation the SyRN RS Oph), the similarities between our SyRNe models and the recently observed properties of the CSM that appear to surround a number of SNe Ia justifies a closer comparison.
The idea of an evacuated region around the explosion centre shaped by a nova explosion was first suggested to explain the density variations in the CSM of the remarkable SN Ia SN 2002ic (Wood-Vasey & Sokoloski, 2006). SN 2002ic showed no signs of CSM interaction during the first 5 - 20 days after the explosion (there are no observations prior to day 5). However, 22 days after the explosion, its brightness increased sharply revealing strong -line emission (Hamuy et al., 2003). A second brightening occurred around 60 days after the explosion, implying a second increase in the CSM density. Such a non-monotonous density distribution suggests the existence of periodic shells around the SN. Wood-Vasey & Sokoloski (2006) showed that a nova explosion in a symbiotic binary system that took place years before the SN Ia forms an evacuated region with a radius of cm. Such a structure can explain brightness evolution during the first 22 days of SN 2002ic. Finally, they interpreted the secondary rise of the SN light curve (at 60 days) is the result of the collision of the SN blast wave with a second shell, formed by the previous nova explosion. Our SyRNe simulations reveal a similar multiple-shell structure, while the first two shells are located to similar radii with these predicted by Wood-Vasey & Sokoloski (2006). For instance for the ‘Case 1 model’ (see Fig. 10) the first nova shell is placed at a radius of cm, and the second shell at cm. The interaction of the SN with the first shell takes place for the model days after the SN explosion, while the interaction with the second shell at 75 days (top right of Fig. 10).
Another recent SN Ia that reveals evidence of a multiple shell structure around the explosion centre is the PTF 2011kx (Dilday et al., 2012). The time variability of the optical absorption lines detected in the spectra of this SN suggests the existence of an inner shell at a radius of cm with an expansion velocity of km s-1, which was surrounded by a more distant, second shell moving at km s-1. Two other SN Ia, SN 2006X (Patat et al., 2007) and SN 2007le (Simon et al., 2009), also showed a similar variability of optical absorption lines during the early SN phase, indicating the presence a dense CSM (, needed to satisfy the required recombination timescale) at a distance of cm from the explosion centre moving outwards with a velocity of 50 - 100 km s-1.
The results of our hydrodynamical simulations are in accordance with these observations. The histograms in Fig. 8 show the column density distribution as a function of the plasma velocity for SyRNe CSM, depicted in the same figure. In these plots we took into account only the plasma with temperatures K, as only for these temperatures neutral, absorbing material is expected. In the three cases, the column density distribution is characterized by three components. The low velocity component showing up around km s-1, corresponds to the stellar wind that has partially filled the cavity, the medium velocity component corresponds the plasma that has been accumulated at the edge of the cavity, and the high velocity component is formed by the first 2-3 shells inside the nova cavity, which are located at radii of cm. The first component should not be observable in SN Ia, as by the time the SN is detected the blast wave has already reached the end of the wind bubble. The second component is at a far distance from the SN, and can therefore not contribute to the variability of the absorption lines, as it will not be ionized by the SN. Therefore, the component that is most relevant for the absorption lines in SN Ia is the third one. The velocity range of this component is up to while the corresponding column densities are in the range of . The velocity range is in agreement with the observations. As for the column density, Simon et al. (2009) estimated that the Na column density around SN 2007le is around . Considering solar abundances for Na, this value corresponds to a total hydrogen column density toward the the explosion centre of , consistent with our simulations.
Shen, Guillochon & Foley (2013) attribute the absorption line variability to shells formed by a sequence of nova explosions that potentially can take place prior to the final merger of the two white dwarfs, in the DD regime. In their model, similar to ours, a shell of swept up ambient medium material is formed by the fast moving nova ejecta which at the moment of the SN Ia explosion has a radius and velocity similar to what is observed in SN 2006X, 2007le and PTF 2011kx. However, in this model the nova ejecta are evolving in the interstellar medium, rather than in a dense wind bubble. Consequently, in the absence of any kind of hydrodynamical instability or clumpiness, the cooling timescales of the nova shells are much higher than the dynamical ones. As a result, no efficient cooling takes place, and the temperatures of the shells are not consistent with the presence of neutral, absorbing material. Moreover, this model can only produce one shell, as any subsequent nova is evolving from the start within the low density nova cavity, and without sweeping up any appreciable amount of mass, it will collide with the shell formed by previous novae.
Recently Soker et al. (2013) suggested that the consecutive shells around PTF 2011kx can be also be explained by the violent merger scenario. According to this scenario, after a common envelope episode that takes place at the progenitor binary, the WD merges with the hot core that remained from the companion star. The multiple shell structure, in this case, is formed by the interaction of the wind of the AGB progenitor and the ejected mass of the common envelope. Hydrosimulations are needed in order a firm conclusion to be drawn about the validity of this model.
5 Summary
The results of the present work are summarised as follows:
-
1.
We simulated the interaction of SNe Ia with circumstellar wind bubbles and calculated the resulting X-ray luminosity. The results differ from the simple model of Immler et al. (2006). We find that Immler et al. (2006) assumptions overestimate the forward shock velocity, the cooling function and the luminosity of the shocked CSM region, while the temperature of the forward shock region and the ratio region are underestimated.
-
2.
The expected total luminosity of our numerical models is almost equal to or even higher than that of Immler et al. (2006) analytical predictions, depending on the SN Ia explosion model used for our simulations. In particular, we note the significantly larger X-ray luminosity predicted for the W7 explosion model.
-
3.
We confirm the X-ray upper limits of the mass-loss rate of the donor star in a symbiotic progenitor system, placed by Immler et al. (2006), and in case of the W7 explosion model, stricter upper limits should be imposed.
-
4.
We simulated the mass outflows expected from SyRN systems in which the CSM is shaped by the interaction of a slow stellar wind with periodical nova explosions. The resulted CSM consists of various nova shells with low density environments in between them.
-
5.
We simulated the interaction of SNe Ia with this wind-nova CSM. We find that the total SN X-ray luminosity is at least one order of magnitude less than that of a SN evolving in a wind bubble. We conclude that SNe Ia originating from SyRNe systems are not detectable in the X-rays during the early SN phase.
-
6.
Our SyRN models reveal similar characteristics with the CSM of SNe Ia which show time variable brightness (SN 2002ic) or time variable line abortion features (SN 2006X, 2007le, PTF 2011kx ).
Acknowledgments
We are grateful to Carles Badenes and Eduardo Bravo for providing us with the DDTc Type Ia model and Rony Keppens for providing us with the AMRVAC code. We thank Sander Walg and K.M. Schure for their helpful discussions that improved the manuscript. Finally, it is a pleasure to thank the Lorentz Center Leiden for hosting a workshop on Type Ia progenitor systems in September 2013. This paper profited from the many discussion that took place there.
References
- Bloom et al. (2012) Bloom J. S. et al., 2012, ApJL, 744, L17
- Bravo & García-Senz (2006) Bravo E., García-Senz D., 2006, ApJL, 642, L157
- Chevalier (1982) Chevalier R. A., 1982, ApJ, 258, 790
- Chevalier & Fransson (2006) Chevalier R. A., Fransson C., 2006, ApJ, 651, 381
- Chomiuk et al. (2012) Chomiuk L. et al., 2012, ApJ, 750, 164
- Claeys et al. (2014) Claeys J. S. W., Pols O. R., Izzard R. G., Vink J., Verbunt F. W. M., 2014, ArXiv e-prints
- Dilday et al. (2012) Dilday B. et al., 2012, Science, 337, 942
- Fransson, Lundqvist & Chevalier (1996) Fransson C., Lundqvist P., Chevalier R. A., 1996, ApJ, 461, 993
- Garnavich et al. (1998) Garnavich P. M. et al., 1998, ApJ, 509, 74
- Greggio (2010) Greggio L., 2010, MNRAS, 406, 22
- Hachisu & Kato (2001) Hachisu I., Kato M., 2001, ApJ, 558, 323
- Hachisu, Kato & Luna (2007) Hachisu I., Kato M., Luna G. J. M., 2007, ApJL, 659, L153
- Hachisu, Kato & Nomoto (1996) Hachisu I., Kato M., Nomoto K., 1996, ApJL, 470, L97
- Hachisu, Kato & Nomoto (2008) Hachisu I., Kato M., Nomoto K., 2008, ApJ, 679, 1390
- Hamuy et al. (2003) Hamuy M. et al., 2003, Nature, 424, 651
- Iben & Tutukov (1984) Iben, Jr. I., Tutukov A. V., 1984, ApJS, 54, 335
- Immler et al. (2006) Immler S. et al., 2006, ApJL, 648, L119
- Kaastra, Mewe & Nieuwenhuijzen (1996) Kaastra J. S., Mewe R., Nieuwenhuijzen H., 1996, in UV and X-ray Spectroscopy of Astrophysical and Laboratory Plasmas, Yamashita K., Watanabe T., eds., pp. 411–414
- Kauffmann, White & Guiderdoni (1993) Kauffmann G., White S. D. M., Guiderdoni B., 1993, MNRAS, 264, 201
- Keppens et al. (2003) Keppens R., Nool M., Tóth G., Goedbloed J. P., 2003, Computer Physics Communications, 153, 317
- Kerzendorf et al. (2009) Kerzendorf W. E., Schmidt B. P., Asplund M., Nomoto K., Podsiadlowski P., Frebel A., Fesen R. A., Yong D., 2009, ApJ, 701, 1665
- Livio & Riess (2003) Livio M., Riess A. G., 2003, ApJL, 594, L93
- Livio & Truran (1992) Livio M., Truran J. W., 1992, ApJ, 389, 695
- Maoz & Mannucci (2008) Maoz D., Mannucci F., 2008, MNRAS, 388, 421
- Mattila et al. (2005) Mattila S., Lundqvist P., Sollerman J., Kozma C., Baron E., Fransson C., Leibundgut B., Nomoto K., 2005, A&A, 443, 649
- Mikołajewska (2013) Mikołajewska J., 2013, in IAU Symposium, Vol. 281, IAU Symposium, Di Stefano R., Orio M., Moe M., eds., pp. 162–165
- Mohamed, Booth & Podsiadlowski (2013) Mohamed S., Booth R., Podsiadlowski P., 2013, in Astronomical Society of the Pacific Conference Series, Vol. 469, 18th European White Dwarf Workshop., Krzesiń, ski J., Stachowski G., Moskalik P., Bajan K., eds., p. 323
- Moore & Bildsten (2012) Moore K., Bildsten L., 2012, ApJ, 761, 182
- Nomoto, Thielemann & Yokoi (1984) Nomoto K., Thielemann F.-K., Yokoi K., 1984, ApJ, 286, 644
- Orlando & Drake (2012) Orlando S., Drake J. J., 2012, MNRAS, 419, 2329
- Pakmor et al. (2013) Pakmor R., Kromer M., Taubenberger S., Springel V., 2013, ApJL, 770, L8
- Panagia et al. (2006) Panagia N., Van Dyk S. D., Weiler K. W., Sramek R. A., Stockdale C. J., Murata K. P., 2006, ApJ, 646, 369
- Patat et al. (2007) Patat F. et al., 2007, Science, 317, 924
- Patat et al. (2011) Patat F., Chugai N. N., Podsiadlowski P., Mason E., Melo C., Pasquini L., 2011, A&A, 530, A63
- Perlmutter et al. (1998) Perlmutter S. et al., 1998, Nature, 391, 51
- Ruiz-Lapuente et al. (2004) Ruiz-Lapuente P. et al., 2004, Nature, 431, 1069
- Russell & Immler (2012) Russell B. R., Immler S., 2012, ApJL, 748, L29
- Schaefer & Pagnotta (2012) Schaefer B. E., Pagnotta A., 2012, Nature, 481, 164
- Schure et al. (2009) Schure K. M., Kosenko D., Kaastra J. S., Keppens R., Vink J., 2009, A&A, 508, 751
- Shen, Guillochon & Foley (2013) Shen K. J., Guillochon J., Foley R. J., 2013, ApJL, 770, L35
- Simon et al. (2009) Simon J. D. et al., 2009, ApJ, 702, 1157
- Soker et al. (2013) Soker N., Kashi A., García-Berro E., Torres S., Camacho J., 2013, MNRAS, 431, 1541
- Sokoloski et al. (2006) Sokoloski J. L., Luna G. J. M., Mukai K., Kenyon S. J., 2006, Nature, 442, 276
- Sternberg et al. (2011) Sternberg A. et al., 2011, Science, 333, 856
- Townsley & Bildsten (2004) Townsley D. M., Bildsten L., 2004, ApJ, 600, 390
- Voss & Nelemans (2008) Voss R., Nelemans G., 2008, Nature, 451, 802
- Webbink (1984) Webbink R. F., 1984, ApJ, 277, 355
- Whelan & Iben (1973) Whelan J., Iben, Jr. I., 1973, ApJ, 186, 1007
- Wood-Vasey & Sokoloski (2006) Wood-Vasey W. M., Sokoloski J. L., 2006, ApJL, 645, L53
- Yaron et al. (2005) Yaron O., Prialnik D., Shara M. M., Kovetz A., 2005, ApJ, 623, 398