Underluminous Type II Plateau Supernovae:
II. Pointing towards moderate mass precursors
Abstract
We present new data for five under-luminous type II-plateau supernovae (SNe IIP), namely SN 1999gn, SN 2002gd, SN 2003Z, SN 2004eg and SN 2006ov. This new sample of low-luminosity SNe IIP (LL SNe IIP) is analyzed together with similar objects studied in the past. All of them show a flat light curve plateau lasting about 100 days, an under luminous late-time exponential tail, intrinsic colours that are unusually red, and spectra showing prominent and narrow P–Cygni lines. A velocity of the ejected material below 103 km s-1 is inferred from measurements at the end of the plateau. The 56Ni masses ejected in the explosion are very small ( 10-2 M⊙). We investigate the correlations among 56Ni mass, expansion velocity of the ejecta and absolute magnitude in the middle of the plateau, confirming the main findings of Hamuy (2003), according to which events showing brighter plateau and larger expansion velocities are expected to produce more 56Ni. We propose that these faint objects represent the low luminosity tail of a continuous distribution in parameters space of SNe IIP. The physical properties of the progenitors at the explosion are estimated through the hydrodynamical modeling of the observables for two representative events of this class, namely SN 2005cs and SN 2008in. We find that the majority of LL SNe IIP, and quite possibly all, originate in the core-collapse of intermediate mass stars, in the mass range 10-15 M⊙.
keywords:
supernovae: general - supernovae: individual: SN 1999gn, SN 2002gd, SN 2003Z, SN 2004eg, SN 2006ov - galaxies: individual: NGC 4303, NGC 7537, NGC 2742, UGC 30531 Introduction
In recent years, a number of under-luminous transient events observed in nearby galaxies, with peculiar observed properties have provoked interest in their physical origins and explosion mechanisms. They lie in the gap of the absolute magnitude vs. photometric evolutionary timescales diagram ( mag, see Kulkarni et al., 2007; Rau et al., 2009) separating the brightest novae and the faintest known supernovae (SNe). These new discoveries include a number of faint, 56Ni-poor, low expansion velocity hydrogen free SNe (e.g. SN 2008ha, Valenti et al., 2009; Foley et al., 2009), some ultra-faint objects with type IIn SN-like spectra and shape of the light curves resembling those of type IIL or type IIP SNe (NGC300 OT2008-1, Bond et al., 2009; Berger et al., 2009; SN 2008S, Botticella et al., 2009; Smith et al., 2009; M85 OT2006-1, Kulkarni et al., 2007; Pastorello et al., 2007), and even a sub-luminous SN 1987A-like event (SN 2009E, Pastorello et al., 2012).
Whilst the nature of many of these objects is still far from being unveiled (unusual eruptive events or real SNe; partial deflagrations or low-energy genuine SNe; electron-capture SNe from moderate-mass stars or fall-back core-collapse supernovae from massive progenitors), major progresses has been made during the past decade for a specific class of under-luminous transients: the faint type IIP SNe (Pastorello et al., 2004).
The prototype of this class is SN 1997D. It was discovered on January 14.15 UT in NGC 1536 (de Mello, Benetti, & Massone, 1997) and it was at that time the faintest and the most sub energetic Type II SN ever discovered. The comparison of the light curve with those of other Type II SNe, suggested the ejection of very low amount of 56Ni (Turatto et al., 1998, Benetti et al., 2001). Unfortunately SN 1997D was discovered when it was quite old, so the explosion epoch was not well constrained. It had unusually red spectra suggesting low continuum temperatures, and narrow spectral lines indicative of slow-moving ejecta (1000 km s-1, that is 3-4 times lower than in normal type IIP SN explosions). All of this suggested a rather low explosion energy for SN 1997D (of the order of 10-1 foe).
In past years, two alternative scenarios have been proposed to explain SN 1997D.
The first invokes a low-energy explosion of a high mass (more than 25 M⊙) star
(Turatto et
al., 1998) in which a large
amount of stellar material remains bound to the core after the collapse,
and falls back onto it, increasing its
mass (Zampieri, Shapiro,
& Colpi, 1998). In this case the compact remnant may be either
a black hole or a neutron star. The crucial parameter to discriminate between
the two types of remnants is indeed the amount of stellar
material falling-back onto the core.
An alternative scenario was proposed by Chugai
& Utrobin (2000), in which the
precursor star of moderate mass (8-11 M⊙) develops a degenerate NeO core (see e.g. Pumo, 2007, Pumo et al., 2009 and references therein, for a discussion on the evolution of this stellar type) and undergoes a core collapse triggered by electron capture (Nomoto, 1984; Takahashi, Yoshida,
& Umeda, 2013). In this case the fall back is negligible and the explosion leaves behind a neutron star.
As mentioned above, the explosion epoch of SN 1997D was poorly constrained. Several models assumed a plateau duration of about 40-60 days (e.g. Chugai & Utrobin, 2000), while others a more conventional length of about 100 days (e.g. Zampieri et al., 2003).
Subsequent discoveries of a number of SN 1997D-like events established that most of them had long-lasting plateau ( 100 days), implying that the results obtained from the preliminary modelling to the data of SN 1997D needed to be revised. Several objects were indeed discovered very close to the explosion epoch and proved that their plateaus were significantly longer than thought before (e.g SNe 1999br, 2001dc and 2003Z, Pastorello et al., 2004). These new observations allowed a consistent calibration of the explosion dates also for events discovered at later phases, such as SN 1997D, and hence their explosion and ejecta parameters were better constrained.
With more complete data sets and/or recalibrated explosion epochs, the masses inferred from hydrodynamic models were initially estimated to be relatively high. Zampieri et al. (2003) found a progenitor of about 16 M⊙ for SN 1999br and 19 M⊙ for SN 1997D. Similar results were obtained by Utrobin, Chugai, & Pastorello (2007) with a mass in the range 14.4-17.4 M⊙ for the progenitor of SN 2003Z, while Utrobin & Chugai (2008) and Pastorello et al. (2009) estimated the red supergiant precursor of SN 2005cs to be 18.21.0 M⊙ and 10-15 M⊙, respectively. Therefore, based on SN data modelling, the masses of low-luminosity SNe IIP progenitor were estimated in the range 10-19 M⊙.
An independent estimate of the masses of the SN progenitor is based on the direct detection of the precursor star in archive images obtained before the SN explosion (Van Dyk, Li, & Filippenko, 2003; Smartt et al., 2004, 2009; Smartt, 2009 and reference therein). The detection of a progenitor (or the measurement of deep upper magnitude limits) on images obtained with different filters allows us to estimate the absolute luminosity and the colours (and, from these, the temperature) of the putative progenitor star. Hence, from matching theoretical evolutionary tracks, it is possible to estimate its mass. In the last decade a handful of LL SNe IIP have been studied with this method: SN 2005cs (Maund, Smartt, & Danziger, 2005; Li et al., 2006; Eldridge, Mattila, & Smartt, 2007; Maund, Reilly, & Mattila, 2013), SN 2008bk (Pignata et al. in prep., Mattila et al., 2008; Van Dyk et al., 2012; Maund et al., 2013) and SN 2009md (Fraser et al., 2011) for which lower mass progenitors of 8-13 M⊙ were inferred. For two additional LL SNe IIP, SN 1999br (Maund & Smartt, 2005; Smartt et al., 2009) and SN 2006ov (Crockett et al., 2011), progenitor mass limits of M 15 M⊙ and M 10 M⊙, respectively, were estimated.
Currently the masses of precursors of LL SNe IIP are still uncertain, with conflicting results obtained through hydrodynamic modelling of SN data, which indicates a distribution extending to rather massive progenitors (10-20 M⊙) or from the direct detection of progenitors in pre-SN images, which suggests lower mass (8-13 M⊙) stars. The problem of this discrepancy has been raised by Utrobin & Chugai (2009), that tentatively attributed an over-estimate of the ejecta masses to the one-dimensional approximation of the hydrodynamical models. Dessart et al. (2013) suggested it may be related to the pre-supernova structure being not well understood.
On the other hand it is fair to say that estimate from the
direct detection of the progenitor presents a number of caveats.
First of all this method can be applied only to nearby objects within a small volume,
e.g. those that explodes within 30 Mpc.
Uncertainties in the stellar evolutionary models used to
infer the progenitor mass (e.g. treatment of
overshooting and mass loss) can also lead to different inferred
masses, although none of the codes available differ by large factors
Smartt et al., 2009.
Finally reliable extinction estimates are essential and there is a
risk of underestimating the mass of the progenitor
(Walmswell
& Eldridge, 2012).
Kochanek et al. (2012) also note that the extinction by circumstellar dust may be significantly different from that of interstellar dust and that
the effect of
CSM dust may not raise progenitor estimates as significantly as
proposed by Walmswell
& Eldridge (2012).
Systematic studies of a larger number of well-followed faint SNe IIP will allow to
improve our knowledge of these events and, in particular, of the parameters describing the progenitor star and its explosion
(including 56Ni mass, total ejected mass, initial radius, kinetic energy).
In this paper we present new data (both photometry and spectroscopy)
for five sub-luminous supernovae classified as LL SNe IIP: SN 2002gd, SN 2003Z, SN
2004eg, SN 1999gn and SN 2006ov. These supernovae, in analogy with SN 1997D, are intrinsically
faint compared with more canonical SNe IIP (the typical luminosity in the plateau phase for a normal type IIP is L 1042 - 1043 erg s-1).
Together with other LL SNe IIP presented in
previous works i.e. SN 1994N, SN 1997D, SN 1999br, SN 1999eu, SN 2001dc, SN 2005cs
(Turatto et
al., 1998; Benetti et
al., 2001; Pastorello et
al., 2004, 2006, 2009) and other events
recently published, i.e. SN 2008bk (Pignata et al. in prep., Van Dyk et
al., 2012), SN 2008in (Roy et al., 2011),
SN 2009N (Takáts et
al., 2013), SN 2009md (Fraser et al., 2011) and SN 2010id (Gal-Yam et
al., 2011), we collect
an extensive sample of LL SNe IIP.
As the best observed
underluminous SN IIP, SN 2005cs (Pastorello et
al., 2006, 2009; Tsvetkov et
al., 2006; Brown et al., 2007; Dessart et
al., 2008) can be considered as a template for this SN family.
In particular, the multi-wavelength study of SN 2005cs is useful to
derive the bolometric light curves of all other LL SNe IIP (with
caveats described in the text).
In addition, the properties of its red supergiant progenitor star were extensively
discussed (Maund, Smartt,
& Danziger, 2005; Li et al., 2006; Takáts
& Vinkó, 2006; Eldridge, Mattila,
& Smartt, 2007; Dessart et
al., 2008; Utrobin
& Chugai, 2008), and -likely- well
constrained. These results will be compared with our findings for other LL SNe IIP.
This paper is organized as follows: in section 2 we present the new LL SN IIP sample and introduce the properties of the host galaxies. In section 3 we give a summary of the observations with a brief description of the instruments used. Photometric data are presented in section 4, including light curves (section 4.1), colour curves (section 4.2) and bolometric light curves (section 4.3). Spectroscopic data are shown in section 5: properties of individual objects are illustrated in section 5.1, while the common properties for the entire group are discussed in section 5.2. Estimates of the physical parameters of our SN sample and a discussion on the implications for the nature of the progenitor stars are in Sections 6 and 7, respectively. Finally a summary follows in section 8.
2 The new sample: supernovae and host galaxies
We present here relevant data for the new LL SNe sample and their host galaxies. Except in the case of SN1999gn and SN 2006ov (see section 2.4) for which a Tully-Fisher distance is adopted, in all other cases the supernova distances are estimated using the recessional velocity corrected for Local Group infall into the Virgo Cluster (vVir parameter from the HYPERLEDA database111http://leda.univ-lyon1.fr/) assuming an Hubble Constant H0 = 72 km s-1 Mpc-1.
No evidence of extinction within the host galaxies were found, therefore we consider only the Galactic contribution estimated by Schlafly & Finkbeiner (2011).
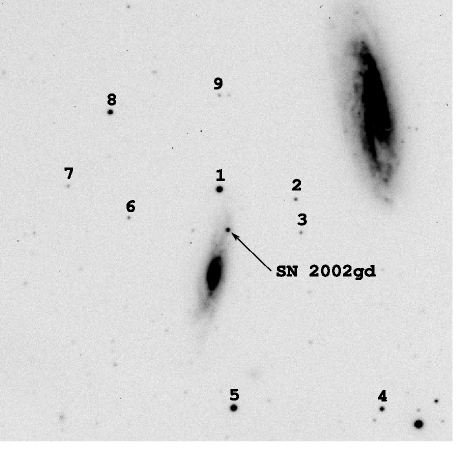
2.1 SN 2002gd
SN 2002gd (Fig. 1) was independently discovered by Klotz, Puckett & Langoussis (2002). The earliest detection was recorded on 2002 October 5.31 UT at an unfiltered CCD magnitude of 18.9 (Klotz & Jasinski, 2002). Nothing was visible at the position of the SN on September 15.95 UT (Klotz & Jasinski, 2002), indicating that the SN was caught very young, during the steep rise to the maximum light. Puckett provided the position of the SN at = 23h14m3698 and = +0430057 (equinox 2000.0), that was 368 East and 108 North of the nucleus of the galaxy NGC 7537. The SN was spectroscopically classified as a young SN II with a very blue continuum and H Balmer and He I 5876 Å lines showing low–contrast P–Cygni profiles. The position of the blue-shifted minima provide an expansion velocity v 5000 km s-1 (Hamuy, 2002), which is relatively low for such an early epoch (Benetti et al., 2002; Filippenko & Chornock, 2002). From the characteristics of the early time spectra and light curve evolution, we can constrain the explosion epoch with a small uncertainty to be 2002 October 4th, i.e. JD = 2452552 2.
The host galaxy of SN 2002gd, NGC 7537, is of Sbc type. Relevant data for SN 2002gd and the host galaxy are reported in Tab.1.
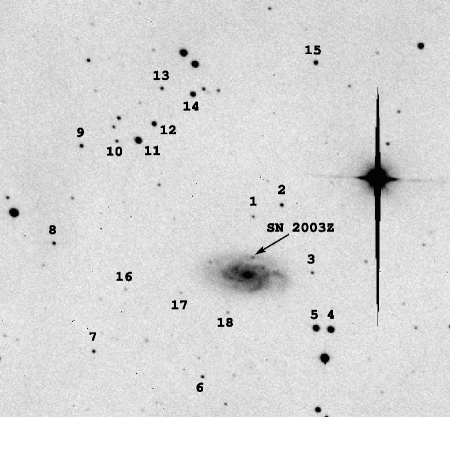
2.2 SN 2003Z
SN 2003Z (Fig. 2) was discovered by Qiu Hu (Boles et al., 2003) with the Beijing Astronomical Observatory (BAO) 0.6m telescope on 2003 January 29.7, when the SN magnitude was 16.7, and confirmed with Katzman Automatic Imaging Telescope (KAIT) on 2003 January 30.4 (magnitude 16.5). It was located at = 09h07m3246 and = +6029175 (equinox 2000.0), close to an arm of NGC 2742 (8′′.4 West and 31′′.0 North of the nucleus of the host galaxy). Another BAO image obtained on 2003 January 20.7 showed nothing at the SN position, suggesting that SN 2003Z was discovered shortly after the explosion (JD = 2452665 4.5). Matheson et al., 2003 obtained a spectrum on 2003 January 31.36 showing a very blue continuum with well–defined P–Cygni lines of H and HeI. The estimated expansion velocity as derived from the minimum of H was 6800 km s-1 (Matheson et al., 2003), again rather low in comparison with the velocity of canonical SNe IIP a few days after the explosion.
NGC 2742 belongs to the small group of galaxies LGG 167 (Garcia, 1993) that has a mean radial velocity of 1475 km s-1. The peculiar velocity of NGC 2742 inside the group is +66 km s-1. The correction for peculiar motion was taken into account in the distance modulus estimation.
Information on SN 2003Z and its host galaxy is in Tab.1.
2.3 SN 2004eg
SN 2004eg (Fig. 3) was first detected in UGC 3053 by Young using the Table Mountain observatory 0.60-m reflector on 2004 September 1.488 UT (Young, Boles, & Li, 2004). The SN was located at , = +21 39 183 (equinox 2000.0), 20′′ West and 1′′.4 South of the nucleus of UGC 3053. The SN was not present on the Sky Survey images dating 1988-1991 (limiting red mag 20.8-21.5; limiting blue mag 21.5-22.5) and it was classified as a type II SN by Filippenko et al. (2004). The line velocity in the classification spectrum was found to be extremely low, roughly 500 km s-1 (Filippenko et al., 2004), as measured from the position of the absorption minima of the P–Cygni profiles.
The adopted explosion epoch is JD = 2453170 30 inferred from the colour evolution (see section 4.2). Main data of SN 2004eg and its host galaxy UGC 3053 are in Tab.1.

2.4 SN 1999gn and SN 2006ov in M61
M61 (NGC 4303) is one of the largest galaxies in the Virgo cluster; its 6’ diameter correspond to about 100,000 light years, similar to the diameter of the Milky Way. To date, 6 SNe have been registered in this galaxy : SN 1926A (type IIL, mag 12.8), SN 1961I (type II, mag 13), SN 1964F (type I, mag 12), SN 1999gn and SN 2006ov (type IIP, this paper) and, more recently, the type IIP SN 2008in (see Sect. 7). A Tully-Fisher distance d = 12.6 2.4 Mpc ( = 30.5 0.4) is adopted for M61, in agreement with Li et al. (2007) and Smartt et al. (2009).
SN 1999gn was discovered with a 0.50-m telescope by A. Dimai on 1999 december 17.22 UT at , = +04 27 45 (31′′.7 East and 39′′.8 South of the nucleus of the galaxy), when the object had magnitude 16.0. The new object was confirmed on the subsequent day through a KAIT image at a magnitude of about 15.5. The supernova was clearly discovered in the rising phase to the maximum light (Dimai & Li, 1999). In a KAIT image taken on Nov. 26.5 no source was detected at the position of the transient to a limiting mag of about 19.0. The spectroscopic classification of SN 1999gn as type II was assigned by Ayani & Yamaoka (1999) from a wide-band spectrum (range 400-800 nm, resolution 0.6 nm) obtained with the Bisei Astronomical Observatory 1.01-m telescope. The spectrum exhibited a blue continuum with overimposed broad H and H P–Cygni profiles. The expansion velocity of the supernova was 5300 km/s, as derived from the position of the H absorption minimum (Ayani & Yamaoka, 1999).
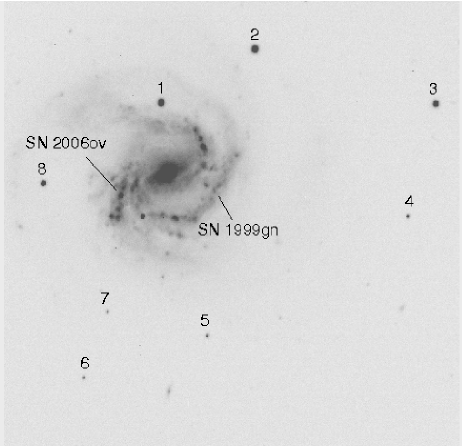
SN 2006ov was discovered by Nakano & Itagaki (Nakano, Itagaki, & Kadota, 2006) on 2006 November 24.86 UT with a 0.60-m reflector. The magnitude at discovery was 14.9. This object was located at , = +04 29 16 (equinox 2000.0), which is 5”.5 East and 51” North of the center of the galaxy. Nothing was visible at this location on an exposure obtained on 2006 May 4 (to a limiting mag 19.5). Blondin et al. (2006) reported that a spectrogram (range 350-740 nm) of 2006ov obtained by P. Berlind on Nov. 25.56 UT with the F. L. Whipple Observatory 1.5-m telescope (+ FAST), showed that SN 2006ov was a type-II supernova roughly one month past explosion. Indeed the spectrum was similar to that of the type IIP SN 2005cs at 36 days past explosion. Adopting a recessional velocity of 1570 km s-1 for the host galaxy (from “The Updated Zwicky Catalog”), the absorption minimum of the H line (rest 656.3 nm) indicates an expansion velocity of 4000 km s-1 (Blondin et al., 2006).
The adopted explosion epochs are JD = 2451520 10 and JD = 2453974 6 for SN 1999gn and SN 2006ov respectively, as inferred from spectroscopic and photometric informations (see section 4.2 and 5.1). Main data of SN 1999gn and SN 2006ov and their host galaxy are reported in Tab.1.
| SN Data | 2002gd | 2003Z | 2004eg | 1999gn | 2006ov | |||||
| (J2000.0) | 23h14m3698 | 09h07m3246 | 04h28m0826 | 12h21m5702 | 12h21m5530 | |||||
| (J2000.0) | ||||||||||
| Offset SN-Gal.Nucleus | 36E, 10′′.8N | 8′′.4W, 31′′.0N | 20′′W, 1′′.4S | 31E, 39S | 5E, 51′′N | |||||
| Discovery Date (UT) | 2002 Oct 5.31 | 2003 Jan 29.7 | 2004 Sept 1.488 | 1999 Dec 17.22 | 2006 Nov 24.86 | |||||
| Discovery Julian Date | 2452552.81 | 2452669.2 | 2453249.5 | 2451529.7 | 2454064 | |||||
| Adopted Explosion Epoch (JD) | 2452552 | 2452665 | 2453170 | 2451520 | 2453974 | |||||
| Discovery Magnitude | m=18.9 | m=16.7 | m=19.5 | m=16.0 | m=14.9 | |||||
| 17.56 | 17.53 | 19.16 | - | 15.73 | ||||||
| Total Extinction | 0.243 | 0.141 | 1.635 | 0.081 | 0.081 | |||||
| Host Galaxies Data | NGC 7537 | NGC 2742 | UGC 3053 | NGC 4303 | ||||||
| (J2000.0) | 23h14m3450 | 09h07m3353 | 04h28m096 | 12h21m549 | ||||||
| (J2000.0) | ||||||||||
| Morph. Type | SAbc: | SA(s)c: | Scd: | SAB(rs)bc | ||||||
| B Magnitude | 13.86 | 12.03 | 14.75 | 10.18 | ||||||
| Galactic Extinction | 0.243 | 0.141 | 1.635 | 0.081 | ||||||
| Diameters | 2’.2 x 0’.6 | 3’.0 x 1’.5 | 0’.9 x 0’.7 | 6’.5 x 5’.8 | ||||||
| (km s-1) | 2698 | 1511 | 2434 | 1616 | ||||||
| (=72 km s-1 Mpc-1) | 32.87 | 31.7 | 32.64 | 30.5 | ||||||
| Dimai & Li (1999); this paper; Nakano, Itagaki, & Kadota (2006); NED; Schlafly & Finkbeiner (2011); HYPERLEDA; | ||||||||||
| Klotz & Jasinski (2002); Boles et al. (2003); Young, Boles, & Li (2004). | ||||||||||
3 Summary of the observations
In this paper we present new data for five type II-P SNe for the first time, along with other data available in the literature. Images and spectra of the 5 SNe were obtained using the following instruments:
- the 1.82-m Copernico Telescope with AFOSC (Asiago-Mt. Ekar, Italy);
- the 0.8-m Teramo-Normale Telescope (TNT) with TK512CB1-1 CCD (Teramo, Italy);
- the ESO 3.6m with EFOSC2 (La Silla, Chile);
- the ESO 3.58-m New Technology Telescope (NTT) with EMMI (La Silla, Chile);
- the 2.3-m telescope at the Siding Spring Observatory (SSO) with DBS (Australia);
- the 74-inch telescope of the Mount Stromlo Observatory (MSO) plus B&C (Australia);
- the Calar Alto (CAHA) 2.2-m telescope with CAFOS (Calar Alto Observatory, Spain);
- the 2.5-m Irénée du Pont telescope plus WFCCD (Las Campanas Observatory, Chile);
- the 1.0-m SWOPE telescope (Las Campanas Observatory, Chile);
- the 2.0-m Faulkes Telescope (FT) North with HawkCam (Haleakala, Hawaii, USA);
- the 2.0-m MAGNUM with MIP (Haleakala, Hawaii, USA)222Yoshii (2002); Yoshii, Kobayashi, & Minezaki (2003);
- the 2.0-m Liverpool Telescope (LT) plus RATCam (La Palma, Spain);
- the 2.56-m Nordic Optical Telescope (NOT) plus ALFOSC (La Palma, Spain);
- the 4.2-m William Herschel Telescope (WHT) equipped with ISIS (La Palma, Spain);
- the 1.0m Jacobus Kapteyn Telescope (JKT) with JAG (La Palma, Spain);
- the 3.58-m Telescopio Nazionale Galileo (TNG) with Dolores (La Palma, Spain);
- the 0.41-m Newton Telescope (Nw 0.4m) of the Gruppo Astrofili di Padova (GAP) equipped with an Apogee AP47p CCD Camera (Padova, Italy).
After the usual initial (bias, overscan, normalized flat-fields) corrections, photometric data were reduced following standard prescriptions (see e.g. Pastorello et al., 2007) using tasks developed by the Asiago-Padova SN Group in the IRAF environment, while the spectroscopic data were reduced using traditional IRAF tasks. Two different methods were used to obtain the SN magnitudes: template subtraction and point spread function (PSF) - fitting technique, depending on the characteristics of the background where the supernova exploded and/or the availability of pre-explosion images of the SN site in the given bands. The explosion epochs of all SNe of our sample were estimated through spectroscopic and photometric comparisons with the well studied SN 2005cs for which the explosion date was well constrained (about 0.5 days, Pastorello et al., 2009). The underlying assumption is that low luminosity type IIP SNe have intrinsically similar properties (see section 4.2).
4 Light curves
Photometric data for SN 2002gd, SN 2003Z, SN 2004eg and SN 2006ov are presented here but we regret that no photometric follow up was performed for SN 1999gn.
4.1 Individual objects
4.1.1 SN 2002gd
The contribution of a large number of facilities allowed an extensive observational campaign for this SN during the photospheric phase in the optical bands. These are complemented by few near-infrared (NIR) data in the late plateau phase calibrated using the 2MASS catalogue (Skrutskie et al., 2006). Optical and NIR magnitudes of SN 2002gd are reported in Tab. 2 while the magnitudes of the local sequence stars (with associated errors) are in Tab. 3.
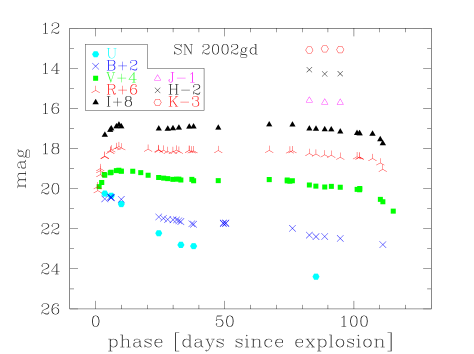
After the steep rise observed during the first few days after discovery, the SN reached the maximum in the optical bands around October 13, 2002. After the maximum the luminosity declined slightly in all bands (especially in B) for about 20 days. Then the SN entered the plateau phase with a constant luminosity. The plateau of SN 2002gd lasted about three months, although a further minor rebrightening was observed at 70 days. The U band light curve had a different behaviour, showing a monotonic decline.
At about 110 days after the explosion, the SN luminosity dropped steeply, that usually takes the light curve to the radioactive tail. Unfortunately this transition was observed only in the initial phase because SN 2002gd was lost behind the Sun. We tried to recover the SN during the nebular phase but the SN was not visible and only upper limits in the SN luminosity were obtained.
These limits allow us to estimate an upper limit for the 56Ni mass ejected in the explosion of SN 2002gd, that turned out to be very small, 0.003M⊙. Missing a real detection and, therefore, an estimate of the late–time magnitude decline rate, we cannot exclude a dimming of the luminosity due to dust formation into the ejecta that could lead us to underestimate the upper limit of the mass of 56Ni.
| Date | JD (2400000+) | U | B | V | R | I | J | H | K | Instr. |
| SN 2002gd | ||||||||||
| 08/10/02 | 52555.52 | – | – | – | 17.40 (0.01) | – | – | – | – | 1 |
| 08/10/02 | 52555.55 | 16.25 (0.01) | 17.51 (0.01) | 17.33 (0.01) | 17.38 (0.01) | 17.33 (0.02) | – | – | – | 1 |
| 10/10/02 | 52557.66 | – | 17.43 (0.01) | 17.21 (0.01) | 17.14 (0.01) | 17.08 (0.01) | – | – | – | 2 |
| 10/10/02 | 52557.67 | – | – | – | 17.14 (0.01) | – | – | – | – | 2 |
| 10/10/02 | 52558.04 | 16.36 (0.03) | 17.43 (0.01) | 17.19 (0.02) | 17.07 (0.02) | 17.01 (0.03) | – | – | – | 3 |
| 10/10/02 | 52558.04 | – | 17.46 (0.01) | – | – | – | – | – | – | 3 |
| 12/10/02 | 52560.04 | – | – | 17.10 (0.02) | 16.95 (0.01) | 16.90 (0.01) | – | – | – | 3 |
| 13/10/02 | 52561.02 | – | – | 17.08 (0.07) | 16.90 (0.13) | 16.82 (0.09) | – | – | – | 3 |
| 14/10/02 | 52561.93 | – | – | 17.14 (0.01) | – | – | – | – | – | 3 |
| 14/10/02 | 52561.95 | 16.77 (0.02) | 17.54 (0.02) | 17.13 (0.01) | 16.96 (0.01) | 16.91 (0.01) | – | – | – | 3 |
| 18/10/02 | 52566.41 | – | – | 17.13 (0.11) | – | – | – | – | – | 4 |
| 24/10/02 | 52572.34 | – | – | 17.34 (0.06) | 17.03 (.06) | – | – | – | – | 5 |
| 28/10/02 | 52576.38 | – | – | – | 17.05 (0.12) | – | – | – | – | 4 |
| 28/10/02 | 52576.44 | 18.23 (0.05) | 18.42 (0.02) | 17.45 (0.02) | 17.08 (0.02) | 17.02 (0.02) | – | – | – | 6 |
| 30/10/02 | 52578.30 | – | 18.48 (0.12) | 17.48 (0.08) | 17.08 (0.09) | – | – | – | – | 5 |
| 01/11/02 | 52579.92 | – | 18.54 (0.03) | 17.51 (0.02) | 17.14 (0.02) | 17.02 (0.02) | – | – | – | 7 |
| 03/11/02 | 52581.93 | – | 18.55 (0.11) | 17.54 (0.03) | 17.14 (0.02) | 17.00 (0.02) | – | – | – | 7 |
| 04/11/02 | 52583.31 | – | 18.56 (0.15) | 17.53 (0.03) | 17.08 (0.05) | – | – | – | – | 5 |
| 05/11/02 | 52584.23 | – | 18.60 (0.04) | 17.53 (0.02) | 17.14 (0.02) | 16.97 (0.04) | – | – | – | 6 |
| 06/11/02 | 52585.01 | 18.81 (0.17) | 18.65 (0.04) | 17.57 (0.04) | – | – | – | – | – | 3 |
| 09/11/02 | 52588.23 | – | – | – | 17.09 (0.20) | – | – | – | – | 5 |
| 09/11/02 | 52588.26 | – | – | – | 17.09 (0.10) | 16.92 (0.08) | – | – | – | 5 |
| 10/11/02 | 52589.26 | – | 18.75 (0.20) | 17.54 (0.11) | 17.11 (0.04) | – | – | – | – | 4 |
| 11/11/02 | 52589.94 | 18.87 (0.33) | 18.78 (0.04) | 17.61 (0.03) | 17.11 (0.02) | 16.91 (0.02) | – | – | – | 3 |
| 20/11/02 | 52599.45 | – | – | 17.60 (0.04) | 17.10 (0.04) | 16.93 (0.10) | – | – | – | 5 |
| 22/11/02 | 52601.44 | – | 18.71 (0.08) | – | – | – | – | – | – | 8 |
| 22/11/02 | 52601.45 | – | 18.74 (0.08) | – | – | – | – | – | – | 8 |
| 23/11/02 | 52602.34 | – | 18.72 (0.10) | – | – | – | – | – | – | 8 |
| 23/11/02 | 52602.35 | – | 18.74 (0.13) | – | – | – | – | – | – | 8 |
| 23/11/02 | 52602.44 | – | 18.72 (0.28) | – | – | – | – | – | – | 8 |
| 10/12/02 | 52619.25 | – | – | 17.55 (0.12) | 17.09 (0.04) | 16.81 (0.02) | – | – | – | 4 |
| 17/12/02 | 52626.20 | – | – | 17.60 (0.05) | – | – | – | – | – | 5 |
| 18/12/02 | 52627.25 | – | – | 17.63 (0.09) | 17.12 (0.03) | – | – | – | – | 4 |
| 19/12/02 | 52628.23 | – | 19.06 (0.10) | 17.65 (0.05) | 17.12 (0.05) | 16.83 (0.17) | – | – | – | 5 |
| 26/12/02 | 52634.77 | – | 19.55 (0.03) | 17.84 (0.02) | 17.28 (0.02) | 17.01 (0.02) | 16.60 (0.04) | 16.07 (0.05) | 16.09 (0.04) | 9 |
| 28/12/02 | 52637.35 | 20.85 (0.30) | 19.57 (0.04) | 17.86 (0.02) | 17.29 (0.02) | 17.04 (0.04) | – | – | – | 10 |
| 01/01/03 | 52640.74 | – | 19.64 (0.03) | 17.92 (0.02) | 17.35 (0.02) | 17.11 (0.02) | 16.70 (0.06) | 16.28 (0.04) | 16.03 (0.08) | 9 |
| 03/01/03 | 52643.28 | – | – | 17.95 (0.05) | 17.39 (0.05) | 17.13 (0.05) | – | – | – | 6 |
| 07/01/03 | 52646.74 | – | 19.70 (0.03) | 18.03 (0.03) | 17.48 (0.02) | 17.18 (0.02) | 16.71 (0.04) | 16.27 (0.06) | 16.07 (0.07) | 9 |
| 13/01/03 | 52653.24 | – | – | 18.04 (0.14) | 17.41 (0.12) | 17.24 (0.30) | – | – | – | 5 |
| 14/01/03 | 52654.21 | – | – | 18.06 (0.03) | 17.44 (0.03) | 17.24 (0.03) | – | – | – | 6 |
| 14/01/03 | 52654.27 | – | – | 17.99 (0.08) | 17.42 (0.08) | 17.26 (0.13) | – | – | – | 5 |
| 14/01/03 | 52654.28 | – | – | 18.03 (0.11) | 17.42 (0.15) | – | – | – | – | 6 |
| 19/01/03 | 52659.23 | – | – | – | 17.50 (0.05) | 17.28 (0.03) | – | – | – | 4 |
| 22/01/03 | 52662.25 | – | – | 18.54 (0.11) | 17.72 (0.20) | 17.55 (0.07) | – | – | – | 5 |
| 23/01/03 | 52663.24 | – | 19.79 (0.09) | 18.66 (0.06) | 18.04 (0.03) | 17.75 (0.02) | – | – | – | 6 |
| 27/01/03 | 52667.25 | – | – | 19.12 (0.30) | – | – | – | – | – | 5 |
| 03/06/03 | 52794.09 | – | – | – | – | – | 19.8 | 19.2 | 18.1 | 9 |
| 04/06/03 | 52795.07 | – | 22.7 | 22.6 | 22.8 | 22.0 | – | – | – | 9 |
| 08/06/03 | 52799.09 | – | – | – | – | – | 19.8 | – | – | 9 |
| 23/08/03 | 52874.54 | – | – | – | 22.90 | 22.67 | – | – | – | 6 |
| 1 = ESO3.6m + EFOSC2; 2 = NTT + EMMI; 3 = SSO2.3m; 4 = Padova-Nw0.4m + CCD; 5 = TNT + CCD; 6 = Asiago1.82m + AFOSC; | ||||||||||
| 7 = SSO-40inch + WFI; 8 = JKT + JAG; 9 = MAGNUM 2m + MIP; 10 = CAHA2.2m + CAFOS. | ||||||||||
| Star | U | B | V | R | I |
|---|---|---|---|---|---|
| SN 2002gd | |||||
| 1 | 17.39 (0.05) | 17.07 (0.02) | 16.00 (0.02) | 15.54 (0.02) | 15.09 (0.01) |
| 2 | – | 20.67 (0.05) | 19.15 (0.03) | 18.24 (0.02) | 17.29 (0.02) |
| 3 | – | 21.40 (0.09) | 19.80 (0.05) | 18.65 (0.03) | 17.55 (0.03) |
| 4 | – | 19.26 (0.04) | 17.67 (0.02) | 16.80 (0.02) | 15.98 (0.01) |
| 5 | 18.35 (0.10) | 17.43 (0.02) | 16.05 (0.01) | 15.35 (0.01) | 14.71 (0.02) |
| 6 | – | 21.63 (0.07) | 19.83 (0.04) | 18.72 (0.03) | 17.48 (0.02) |
| 7 | – | 20.39 (0.05) | 19.66 (0.05) | 19.36 (0.05) | 18.86 (0.04) |
| 8 | 17.54 (0.05) | 17.67 (0.02) | 16.85 (0.02) | 16.52 (0.01) | 16.18 (0.01) |
| 9 | 19.03 (0.20) | 19.73 (0.04) | 19.26 (0.03) | 19.18 (0.04) | 18.94 (0.03) |
4.1.2 SN 2003Z
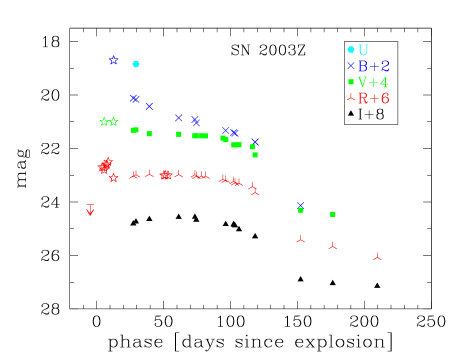
Our photometric follow-up observations started about 1 month after the adopted explosion epoch and lasted until day 210, in the nebular phase. PSF-fitting photometric measurements of SN 2003Z are reported in Tab. 4, while the magnitudes of the sequence stars (Fig. 2) are listed in Tab. 5. Early-time photometry (both filtered and unfiltered) is adopted from the Bright Supernova web site333http://www.rochesterastronomy.org. These data give useful constraints on the photometric evolution of the SN during the first month after the explosion and show that SN 2003Z was discovered when it was very young, likely a few days after the shock breakout. Merging these unfiltered measurements with those presented in this paper, allows us to infer a plateau duration of about 100 days (see Fig. 6). The end of the plateau is well determined, after which we observe a large luminosity drop lasting a few weeks, until the SN light curve reaches the exponential tail. Despite the relatively large uncertainty in the late–time photometry, the average luminosity decline is rather close to that expected for the luminosity decline of 56Co into 56Fe (0.98 mag/100days, see Tab. 6).
| Date | JD (2400000+) | U | B | V | R | I | Ins. |
|---|---|---|---|---|---|---|---|
| SN 2003Z | |||||||
| 21/02/03 | 52692.40 | – | – | – | 17.03 (0.05) | – | 1 |
| 21/02/03 | 52692.44 | – | 18.12 (0.02) | 17.33 (0.03) | – | 16.81 (0.02) | 1 |
| 23/02/03 | 52694.41 | 18.84 (0.06) | 18.16 (0.05) | 17.31 (0.04) | 16.98 (0.02) | 16.74 (0.02) | 2 |
| 05/03/03 | 52704.40 | – | 18.43 (0.06) | – | – | – | 2 |
| 05/03/03 | 52704.41 | – | 18.43 (0.12) | – | – | – | 2 |
| 05/03/03 | 52704.42 | – | 18.42 (0.10) | – | – | – | 2 |
| 05/03/03 | 52704.43 | – | 18.43 (0.07) | 17.44 (0.04) | 16.96 (0.04) | 16.65 (0.02) | 2 |
| 27/03/03 | 52726.32 | – | 18.86 (0.07) | 17.48 (0.02) | 16.97 (0.03) | 16.57 (0.02) | 2 |
| 08/04/03 | 52738.41 | – | 18.92 (0.15) | 17.52 (0.05) | 16.98 (0.03) | 16.56 (0.03) | 2 |
| 10/04/03 | 52739.50 | – | 19.04 (0.05) | 17.52 (0.01) | 17.04 (0.01) | 16.67 (0.01) | 1 |
| 13/04/03 | 52743.40 | – | – | 17.52 (0.11) | 17.03 (0.07) | – | 3 |
| 16/04/03 | 52746.36 | – | – | 17.53 (0.16) | 17.03 (0.07) | – | 3 |
| 29/04/03 | 52759.36 | – | – | 17.61 (0.07) | 17.15 (0.08) | – | 3 |
| 01/05/03 | 52761.46 | – | 19.33 (0.08) | 17.67 (0.03) | 17.19 (0.02) | 16.83 (0.02) | 1 |
| 07/05/03 | 52767.43 | – | 19.40 (0.26) | 17.86 (0.10) | 17.23 (0.09) | 16.83 (0.14) | 2 |
| 07/05/03 | 52767.45 | – | – | – | – | 16.85 (0.09) | 2 |
| 08/05/03 | 52768.42 | – | 19.43 (0.06) | 17.87 (0.04) | 17.29 (0.03) | 16.89 (0.02) | 2 |
| 11/05/03 | 52771.38 | – | – | 17.86 (0.08) | 17.30 (0.14) | 17.03 (0.06) | 3 |
| 21/05/03 | 52781.46 | – | – | 17.94 (0.07) | 17.43 (0.07) | – | 3 |
| 23/05/03 | 52783.38 | – | 19.75 (0.23) | 18.24 (0.07) | – | – | 2 |
| 23/05/03 | 52783.40 | – | 19.76 (0.25) | – | 17.65 (0.13) | 17.29 (0.09) | 2 |
| 26/06/03 | 52817.41 | – | 22.13 (0.28) | 20.31 (0.11) | 19.41 (0.05) | 18.90 (0.04) | 1 |
| 21/07/03 | 52841.36 | – | – | 20.47 (0.32) | 19.66 (0.23) | 19.04 (0.15) | 2 |
| 23/08/03 | 52874.63 | – | – | – | 20.07 (0.15) | 19.15 (0.21) | 2 |
1 = TNG + Dolores; 2 = Asiago 1.82m + AFOSC; 3 = Nw 0.4m + CCD
| Star | U | B | V | R | I |
|---|---|---|---|---|---|
| SN 2003Z | |||||
| 1 | – | 18.87 (0.03) | 17.65 (0.01) | 16.89 (0.02) | 16.26 (0.01) |
| 2 | 18.08 (–) | 17.35 (0.01) | 16.43 (0.01) | 16.00 (0.01) | 15.54 (0.01) |
| 3 | – | 19.03 (0.01) | 17.53 (0.01) | 16.59 (0.01) | 15.62 (0.01) |
| 4 | 14.13 (–) | 13.88 (–) | 13.29 (0.03) | 12.93 (0.02) | – |
| 5 | 14.32 (–) | 14.04 (–) | 13.41 (0.03) | 13.05 (0.02) | – |
| 6 | – | 17.44 (0.02) | 16.79 (0.01) | 16.41 (0.01) | 16.06 (0.01) |
| 7 | – | 18.19 (0.02) | 16.98 (0.01) | 16.13 (0.01) | 15.37 (0.01) |
| 8 | – | – | 16.84 (0.12) | 16.14 (0.01) | – |
| 9 | – | 17.76 (–) | 16.63 (0.05) | 15.89 (0.02) | 15.06 (–) |
| 10 | 19.75 (–) | 18.40 (0.02) | 17.28 (0.02) | 16.52 (0.01) | 15.73 (0.02) |
| 11 | – | – | 13.41 (–) | 13.07 (0.02) | – |
| 12 | – | 15.71 (–) | 14.99 (–) | 14.69 (0.03) | 14.20 (–) |
| 13 | – | – | 16.85 (–) | 16.14 (0.05) | – |
| 14 | 15.95 (–) | – | 14.68 (–) | 14.22 (0.02) | 13.69 (0.01) |
| 15 | – | – | 15.62 (–) | 15.25 (0.04) | – |
| 16 | – | 18.72 (0.09) | 18.14 (0.01) | 17.82 (0.01) | 17.39 (0.01) |
| 17 | – | 18.82 (0.02) | 18.18 (0.01) | 17.80 (0.01) | 17.41 (0.01) |
| 18 | – | 19.67 (0.02) | 18.29 (0.01) | 17.37 (0.01) | 16.60 (0.01) |
| band | 10–40d | 35–100d | 90–110d | 115–155d | 150d |
|---|---|---|---|---|---|
| 6.32∗ | 1.60 | 1.44 | 6.99 | – | |
| 1.73 | 0.36 | 2.32 | 6.37 | 0.67 | |
| -0.54 | 0.32 | 1.21 | 5.37 | 1.05 | |
| -1.20 | 0.31 | 1.68 | 4.73 | 0.58 |
∗ the measured slope of the B band light curve changes
from = 9.65 (10–30 days) to = 2.58 (25–40 days).
4.1.3 SN 2004eg
Our optical photometry in the g’BVRI bands, collected in Tab. 7, span about 4 months. The sloan r’ and i’ magnitudes collected with the SWOPE telescope were converted into Johnson-Bessel R and I magnitudes making use of the relation presented in Smith et al. (2002):
| (1) |
and
| (2) |
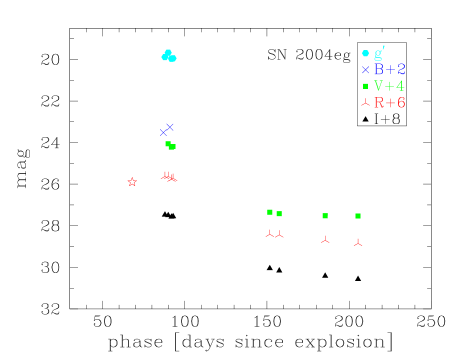
Photometric measurements of SN 2004eg were performed using a PSF-fitting method. Photometric errors were estimated with artificial star experiments: the large errors are consistent with the faint SN magnitudes. For calibration we used the local stellar sequence shown in Fig. 3. Their magnitudes are reported in Tab 8. The poorly sampled light curve of SN 2004eg is shown in Fig. 7. A few photometric points were collected in the plateau phase, and these allow to estimate the SN luminosity in the recombination phase. Additionally, a few photometric observations of the radioactive tail allow us to estimate the 56Ni mass (see Sect. 4.3).
| Date | JD (2400000+) | g’ | B | V | R | I | Ins. |
|---|---|---|---|---|---|---|---|
| SN 2004eg | |||||||
| 08/09/04 | 53256.91 | - | 21.02 (0.09) | - | - | - | 1 |
| 09/09/04 | 53257.89 | 19.89 (0.03) | - | - | 18.13 (0.03) | 17.47 (0.03) | 1 |
| 11/09/04 | 53259.89 | 19.68 (0.04) | - | 19.06 (0.04) | 18.13 (0.03) | 17.50 (0.03) | 1 |
| 12/09/04 | 53260.89 | - | 20.76 (0.07) | - | - | - | 1 |
| 13/09/04 | 53261.89 | 19.97 (0.04) | - | 19.22 (0.04) | 18.26 (0.04) | 17.57 (0.04) | 1 |
| 14/09/04 | 53262.85 | 19.95 (0.04) | - | 19.19 (0.04) | 18.22 (0.04) | 17.55 (0.04) | 1 |
| 11/11/04 | 53321.69 | - | - | 22.35 (0.33) | 20.91 (0.09) | 20.05 (0.10) | 2 |
| 16/11/04 | 53327.48 | - | - | 22.42 (0.25) | 20.94 (0.20) | 20.16 (0.32) | 3 |
| 15/12/04 | 53355.43 | - | - | 22.52 (0.36) | 21.20 (0.13) | 20.41 (0.11) | 3 |
| 03/01/05 | 53375.42 | - | - | 22.53 (0.36) | 21.35 (0.22) | 20.57 (0.19) | 3 |
1 = SWOPE 2 = TNG + Dolores; 3 = Asiago 1.82m + AFOSC
| Star | g’ | B | V | R | I |
|---|---|---|---|---|---|
| SN 2004eg | |||||
| 1 | 18.00 (0.01) | 18.40 (0.03) | 17.69 (0.02) | 17.14 (0.02) | 16.62 (0.02) |
| 2 | 18.35 (0.01) | 18.92 (0.01) | 17.88 (0.02) | 17.23 (0.03) | 16.58 (0.01) |
| 3 | - | - | 18.42 (0.02) | 17.79 (0.03) | 17.27 (0.01) |
| 4 | 18.59 (0.01) | 19.02 (0.05) | 18.27 (0.01) | 17.72 (0.02) | 17.20 (0.01) |
| 5 | 18.13 (0.01) | 18.50 (0.04) | 17.85 (0.02) | 17.34 (0.02) | 16.82 (0.01) |
| 6 | - | - | 16.49 (0.02) | 15.90 (0.01) | 15.31 (0.06) |
| 7 | - | - | 15.72 (0.02) | 15.21 (0.03) | 14.70 (-) |
| 8 | - | - | 18.22 (0.01) | 17.62 (0.03) | 17.04 (0.01) |
| 9 | - | - | 17.48 (0.01) | 16.98 (0.04) | 16.45 (0.01) |
| 10 | - | - | 15.82 (0.02) | 15.05 (0.03) | - |
| 11 | - | - | 18.15 (0.01) | 17.29 (0.01) | 16.66 (-) |
| 12 | - | - | 18.34 (0.05) | 17.44 (0.06) | 16.65 (-) |
| 13 | - | - | 17.29 (0.05) | 16.51 (0.06) | 15.88 (-) |
| 14 | - | - | 16.75 (0.04) | 16.21 (0.07) | 15.73 (-) |
4.1.4 SN 2006ov
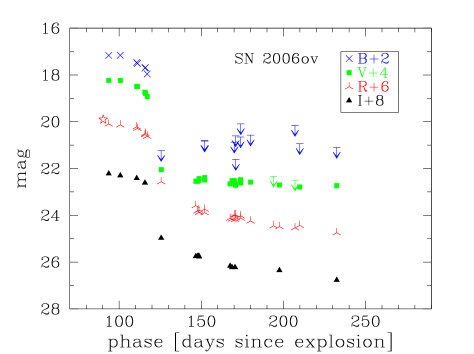
Photometric data were collected at 24 different epochs over a period of 150 days, starting from the end of the photospheric phase. SN magnitudes are reported in Tab. 9, while those of the local sequence stars used for the calibration are collected in Tab. 10. The light curve of SN 2006ov is shown in Fig. 8.
SN 2006ov exploded in a crowded background region of the host galaxy. As long as the source was bright, the SN data were obtained with the PSF-fitting technique. When the SN luminosity faded, the photometric measurements were performed using the template subtraction technique. The errors were estimated by putting artificial stars with the same magnitude as the SN, in a number of locations close to the SN position, and were estimated as the r.m.s. of the recovered magnitudes.
Unfortunately, this SN was discovered near the end of the plateau phase. A few points showed that in this phase the SN had a roughly constant magnitudes, about 15.7 mag. Between day 110 and day 140, after the end of the recombination phase, a steep decline of more than four magnitudes was observed in all bands. A slower decline is then observable beyond 150 days. In this phase, the SN becomes too faint to be observed in the B band and only upper limits were measured. Nevertheless, the luminosity decline at late epochs is still consistent with the radioactive decay of 56Co into 56Fe (Sect. 4.3).
| Date | JD (2400000+) | B | V | R | I | Ins. |
|---|---|---|---|---|---|---|
| SN 2006ov | ||||||
| 24/11/06 | 54064.34 | – | – | 14.90 (-) | – | 6 |
| 28/11/06 | 54067.70 | 17.16 (0.08) | 15.73 (0.03) | 15.09 (0.02) | 14.72 (0.02) | 1 |
| 05/12/06 | 54074.73 | 17.16 (0.03) | 15.74 (0.02) | 15.13 (0.01) | 14.80 (0.01) | 2 |
| 15/12/06 | 54084.71 | 17.46 (0.05) | 16.00 (0.02) | 15.21 (0.01) | 14.91 (0.01) | 2 |
| 15/12/06 | 54085.11 | 17.50 (0.04) | 15.99 (0.02) | 15.28 (0.02) | – | 4 |
| 20/12/06 | 54089.72 | 17.70 (0.14) | 16.24 (0.04) | 15.55 (0.03) | 15.11 (0.03) | 1 |
| 20/12/06 | 54090.04 | 17.69 (0.05) | 16.29 (0.01) | 15.49 (0.01) | – | 4 |
| 21/12/06 | 54091.11 | 17.96 (0.02) | 16.43 (0.01) | 15.62 (0.01) | – | 4 |
| 30/12/06 | 54099.62 | 21.23 | 19.55 (0.15) | 17.56 (0.05) | 17.47 (0.11) | 2 |
| 20/01/07 | 54120.67 | – | 20.04 (0.06) | 18.58 (0.02) | 18.25 (0.07) | 2 |
| 21/01/07 | 54121.67 | – | 20.04 (0.18) | 18.82 (0.06) | 18.24 (0.07) | 2 |
| 22/01/07 | 54122.56 | – | 20.01 (0.10) | 18.77 (0.07) | 18.23 (0.07) | 2 |
| 22/01/07 | 54122.67 | – | 19.93 (0.23) | 18.87 (0.02) | 18.27 (0.10) | 2 |
| 25/01/07 | 54126.05 | 20.81 | 19.99 (0.21) | 18.73 (0.04) | – | 4 |
| 25/01/07 | 54126.11 | 20.89 | 19.89 (0.22) | 18.88 (0.07) | – | 4 |
| 10/02/07 | 54141.56 | – | 20.15 (0.26) | 19.12 (0.02) | 18.66 (0.07) | 2 |
| 11/02/07 | 54142.76 | – | 20.02 (0.25) | 19.16 (0.06) | 18.72 (0.12) | 3 |
| 12/02/07 | 54144.12 | 20.87 | 20.01 (0.13) | 18.98 (0.17) | – | 4 |
| 12/02/07 | 54144.59 | – | 20.15 (0.11) | 19.18 (0.03) | 18.72 (0.15) | 2 |
| 13/02/07 | 54144.91 | 20.60 | 20.21 (0.21) | 18.97 (0.05) | – | 4 |
| 13/02/07 | 54145.03 | 21.61 | 20.19 (0.15) | 19.09 (0.16) | – | 4 |
| 16/02/07 | 54147.92 | 20.65 | 19.97 (0.18) | 19.02 (0.16) | – | 4 |
| 16/02/07 | 54148.05 | 20.09 | 20.11 (0.40) | 19.11 (0.18) | – | 4 |
| 22/02/07 | 54154.05 | 20.57 | 20.08 (0.22) | 19.24 (0.13) | – | 4 |
| 08/03/07 | 54168.07 | – | 19.83 | 19.45 (0.13) | – | 4 |
| 11/03/07 | 54171.57 | – | 20.20 (0.26) | 19.48 (0.20) | 18.85 (0.02) | 5 |
| 21/03/07 | 54181.04 | 20.16 | 19.99 | 19.53 (0.35) | – | 4 |
| 24/03/07 | 54183.95 | 20.94 | 20.29 (0.63) | 19.43 (0.03) | – | 4 |
| 15/04/07 | 54206.45 | 21.10 | 20.23 (0.06) | 19.74 (0.14) | 19.26 (0.09) | 1 |
1 = Asiago 1.82m + AFOSC, 2 = LT, 3 = NOT, 4 = FT North, 5 = WHT, 6 = Nakano, Itagaki,
& Kadota (2006).
| Star | B | V | R | I |
|---|---|---|---|---|
| SN 2006ov | ||||
| 1 | 15.22 (0.01) | 14.27 (0.01) | 13.65 (0.01) | 13.14 (0.02) |
| 2 | 14.56 (0.02) | 13.98 (0.01) | 13.60 (0.01) | 13.24 (0.04) |
| 3 | 15.98 (0.58) | 15.43 (0.70) | 14.92 (0.58) | 14.58 (0.56) |
| 4 | 18.26 (-) | 16.95 (-) | 16.17 (-) | 15.48 (-) |
| 5 | 18.78 (0.03) | 17.55 (0.01) | 16.80 (0.02) | 16.07 (0.03) |
| 6 | 18.23 (0.04) | 17.59 (0.02) | 17.24 (0.04) | 16.84 (0.02) |
| 7 | 19.43 (0.03) | 18.10 (0.04) | 17.07 (0.01) | 16.19 (0.01) |
| 8 | 16.68 (0.02) | 15.59 (0.01) | 14.85 (0.01) | 14.19 (0.01) |
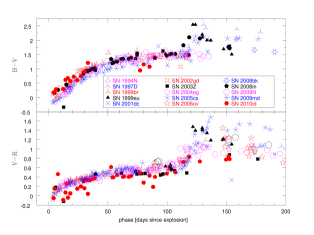
4.2 Colour curves
In this section we compare the colour curves of an extensive sample of underluminous SNe IIP, including the objects discussed in the previous sections (SN 2002gd, SN 2003Z, SN 2004eg, SN 2006ov) together with SN 1994N, SN 1999br, SN 1999eu, SN 2001dc (Pastorello et al., 2004), SN 1997D (Turatto et al., 1998; Benetti et al., 2001), SN 2005cs (Pastorello et al., 2006; Tsvetkov et al., 2006; Brown et al., 2007; Pastorello et al., 2009), SN 2008bk (Van Dyk et al., 2012), SN 2008in (Roy et al., 2011), SN 2009N (Takáts et al., 2013), SN 2009md (Fraser et al., 2011) and SN 2010id (Gal-Yam et al., 2011).
The explosion epochs for the whole SN sample were computed mainly using the available photometric information, and dating the available SN spectra. In the case of SN 2003Z and SN 2002gd, both well sampled during early stages, the explosion epochs have been calculated by comparing the evolution of the light curves with those of SN 2005cs. Additional information is provided from the early rising branch and pre-SN detection limits. In the case of SN 2004eg and SN 2006ov, for which we have a less complete photometric coverage, we dated the explosions making use of the homogeneity of the (B-V) and (V-R) colour curves (Pastorello et al., 2004) and of the spectroscopic evolution (Sect. 5).
The (B-V) and (V-R) colour curves during the first 120 days are shown in figure 9. Only corrections for galactic extinctions have been applied to the whole sample except for the cases of SN 2005cs in which the (small) host galaxy extinction is well constrained (AB,tot = 0.205 mag, see Pastorello et al., 2009) and SN 2001dc whose colours indicate significant interstellar reddening. This feature, together with the fact that SN 2001dc exploded in a dusty region of the host galaxy, lead us to correct its colour for internal extinction as in Pastorello et al. (2004) (AB,i = 1.654 mag, AB,tot = 1.693 mag).
During the photospheric phase, following the envelope expansion and cooling, the (B-V) colour reddens during the first 60 days reaching (B-V) 1.4 mag, then it remains around this value for the subsequent 60 days (when the H envelope recombines). The (V-R) colour, reaches 0.6 mag at about 70 days, followed by a flattening in the subsequent period. A red spike is visible at 120 days.
The high degree of homogeneity in the colours of these objects during the first 100 days might suggest some homogeneity in the properties of the progenitor stars.
At about 4 months past core-collapse a larger dispersion in the (B-V) colour is visible among faint IIP SNe. A similar behavior is observed for the (V-R) colour, ranging from (V-R) 0.4 mag in the case of SN 2004eg to (V-R) 0.8 mag in the case of SN 2006ov. This is mostly due to the intrinsic faintness of the SNe in this phase, that increases significantly the photometric errors.
4.3 Bolometric light curves
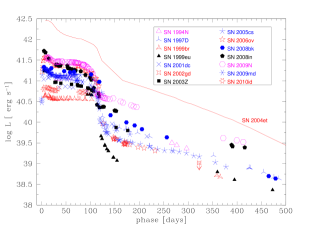
Pseudo-bolometric light curves for our SN sample were obtained by integrating the fluxes in the B, V, R, I bands (Fig. 10). As a reference object, we also consider the BVRI pseudo bolometric light curve of the normal type IIP SN 2004et. It is evident that the bolometric luminosities of all objects in our sample are systematically fainter than that of SN 2004et, and - in particular - their plateau luminosities are at least a factor 10 fainter. As mentioned in previous sections, the plateau phase in sub-luminous SNe IIP lasts about 100-110 days, followed by an abrupt drop by about 3-5 mag, when the SN light curves settle onto the much slower radioactive tail powered primarily by the radioactive decay of Co to Fe.
Despite the general homogeneity in the photometric properties, some interesting and significant differences are visible among the objects.
The luminosity of the plateau in our sample range between the upper value of SN 2009N ( erg s-1), and the lower extreme marked by SN 1999br, erg s-1. This wide range in the plateau luminosity suggests some differences in the kinematics of the expanding gas, in the initial radius or in the masses of the hydrogen envelope, where the recombination takes place (or a combination of them).
Between days 150 and 500 all light curves show a similar behaviour, with nearly linear luminosity declines, consistent with that expected from the radioactive decay of 56Co into 56Fe (0.98 mag/100days). During this phase, at around 400 days, we observe a spread in the luminosity of the sample between the lower value of SN 1999br and SN 1999eu ( erg s-1) and the higher value of SN 2009N ( erg s-1). This is an indication of a significant spread in the 56Ni masses ejected by LL SNe IIP.
Through a comparison with the late-time luminosity of SN 1987A we could estimate the 56Ni masses for all objects of our SN sample. We found values spanning from up to M⊙(Ni), 1-2 orders of magnitude less than in normal type IIP SNe (for more details, see Sect. 6).
5 Spectroscopy
In this section we present the spectroscopic evolution of the five under-luminous SNe IIP introduced in the previous sections. SN 2002gd, SN 2003Z and SN 2006ov have been well monitored, whilst for SN 1999gn and SN 2004eg only one and two spectra are available, respectively. The journal of spectroscopic observation in presented in Tab. 11.
5.1 Individual properties
-
•
SN 1999gn - Only one spectrum of SN 1999gn is available (Fig. 11, top) taken during the plateau phase. By comparing this spectra with a library of supernova spectra via GELATO (Harutyunyan et al., 2008) we could estimate a phase of about 45 days past explosion. The continuum is red and is characterized by the presence of a number of P–Cygni lines, including H, Sc II 5527 Å, Na I D 5890, 5896 Å, Ba II (multiplet 1 at 4554, 4934 Å and multiplet 2 at 5854, 6142, 6497 Å), Fe II, O I, Ca II, Ti II and Cr II (see Pastorello et al., 2004 for a detailed line identification). The velocity inferred from Sc II 6246 Å line is v (Sc II) = 1690 100 km s-1, significantly lower than that observed in normal type II SNe, and close to the value inferred for SN 2005cs at a similar epoch (v = 1550 km s-1; Pastorello et al., 2009).

Figure 11: Spectra of SN 1999gn (top) and SN 2004eg (centre and bottom). -
•
SN 2002gd - We extensively monitored SN 2002gd, especially during the photospheric phase (Fig. 12). The two earliest spectra, obtained with the ESO 4m–class telescopes have the best S/N ratio and are dominated by a blue continuum and only Balmer lines and He I 5876 Å are detected. In addition, a P–Cygni profile is detected at about 6250 Å, possibly identified as Si II 6355 Å. When the temperature fades, Fe II and Ca II lines begin to appear and He I is replaced by the Na I doublet. Between days 30 and 40 after explosion, other metal lines with P–Cygni profiles become prominent, including O I, Ti II, Sc II, Sr II, Ba II, Cr II. The line blanketing at the short wavelengths increases and the continuum becomes redder: this is consistent with the color evolution discussed above. In late–photospheric spectra, H, Na I D and Ca II are the most prominent spectral features.
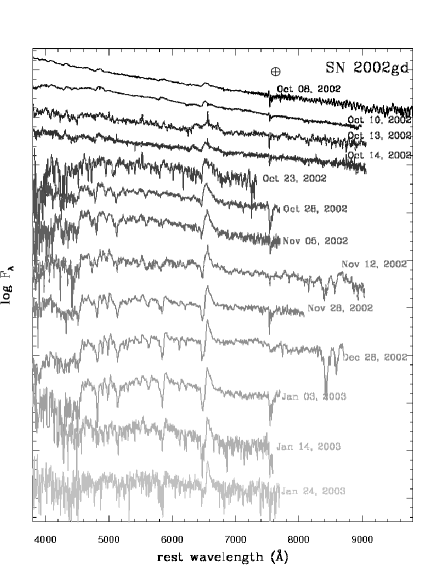
Figure 12: Sequence of spectra of SN 2002gd during the photospheric phase. Symbol indicates telluric absorptions. -
•
SN 2003Z - The first four spectra presented in Fig. 13 are from Knop et al. (2007) and display the early evolution of this SN. We started our monitoring about 1 month after the discovery. The early spectra show relatively strong P–Cygni lines of H, Ca II, Na I, Fe II, while other metal lines, such as Sc II, Ba II, Cr II and Ti II become prominent during the plateau phase. The sequence of spectra of this SN is one of the most comprehensive among LL events. It covers the transition from early spectra (similar to those of canonical type II SNe) to the end of the plateau. At which point the spectra have red continua and prominent, very narrow P–Cygni lines.
Table 11: Journal of spectroscopic observations. Date JD (2400000+) Phase (days) Instrument Grism Range (A) Res. (A) SN 1999gn 21/01/2000 51564.77 45.7 NTT+EMMI gm2 + gm4 3900-10600 24+37 SN 2002gd 08/10/2002 52555.53 3.5 ESO 3.6M+EFOSC2 gm11 + gm 12 3330–9990 12+11 10/10/2002 52557.69 5.7 ESO NTT+EMMI gm3 3720–9060 8 10/10/2002 52558.08 6.1 SSO 2.3m+DBS - 3300–4270,5790–6750 1.1+1.1 13/10/2002 52561.06 9.1 SSO 2.3m+DBS - 3040–9140 5+8 14/10/2002 52562.03 10.0 SSO 2.3m+DBS - 3160–9140 5+8 23/10/2002 52571.0 19.0 MSO 74in+BC 300 l/mm grating 3870–7390 8 28/10/2002 52576.37 24.4 Asiago 1.82m+AFOSC gm4 3400–7760 24 05/11/2002 52584.33 32.3 Asiago 1.82m+AFOSC gm4 3390–7770 24 12/11/2002 52590.76 38.8 SSO 2.3m+DBS - 3450–9110 5 28/11/2002 52607.46 55.5 CAHA 2.2m+CAFOS B200 3200–8150 13 28/12/2002 52637.31 85.3 CAHA 2.2m+CAFOS B200 3240–8780 13 03/01/2003 52643.26 91.3 Asiago 1.82m+AFOSC gm4 3390–7760 24 14/01/2003 52654.27 102.3 Asiago 1.82m+AFOSC gm4 4310–7650 24 24/01/2003 52664.27 112.3 Asiago 1.82m+AFOSC gm4 3400–7760 24 SN 2003Z 21/02/2003 52692.48 27.5 TNG+LRS LR-B 3160–8050 16 24/02/2003 52694.54 29.5 Asiago 1.82m+AFOSC gm2 + gm4 3400–9070 24+38 04/03/2003 52702.57 37.6 Asiago 1.82m+AFOSC gm4 3580–7820 24 06/03/2003 52704.51 39.5 Asiago 1.82m+AFOSC gm4 3590–7810 24 08/04/2003 52738.36 73.4 Asiago 1.82m+AFOSC gm4 3560–7760 24 10/04/2003 52739.55 74.6 TNG+LRS LR-B 3190–8030 16 01/05/2003 52761.49 96.5 TNG+LRS LR-B 3200–8030 16 08/05/2003 52768.45 103.5 Asiago 1.82m+AFOSC gr4 3410–7750 24 27/06/2003 52818.41 153.4 TNG+LRS LR-B 3200–8030 16 SN 2004eg 14/09/2004 53263 93 DuPont + WFCCD - 3800-9200 - 01/12/2004 53341.56 171.6 TNG + Dolores LR-R 4886-9016 12 SN 2006ov 28/11/2006 54067.72 93.7 Asiago 1.82m+AFOSC gm2+gm4 3400–9070 24 + 38 20/12/2006 54089.71 115.7 Asiago 1.82m+AFOSC gm2+gm4 3400–9070 24 + 38 26/12/2006 54095.75 121.7 WHT + ISIS R158R+R300B 3076-9597 6+9 11/02/2007 54142.73 168.7 NOT + ALFOSC gm5 4906-9759 16 12/03/2007 54171.72 197.7 WHT + ISIS R158R+R300B 3048-10458 6+9 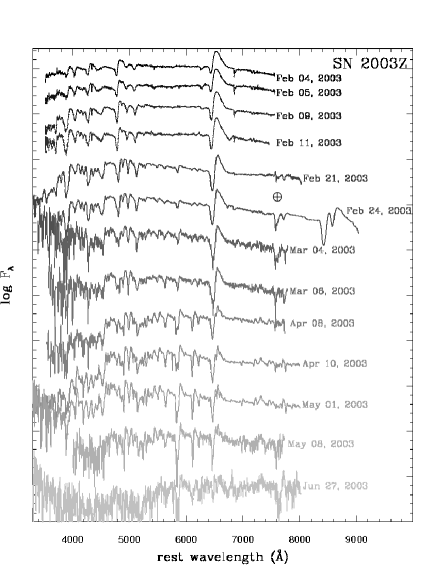
Figure 13: Spectral evolution of SN 2003Z. Symbol indicates telluric absorptions. -
•
SN 2004eg - Two spectra are available for SN 2004eg (Fig. 11), one at the end of the plateau phase and one in the nebular phase. The first spectrum (+93 days) shows extremely narrow lines with P–Cygni profiles: Sc II 5527 Å, Ba II 6142 Å, Na I 5890, 5896 Å and Ca II H & K and near–infrared triplet (8498, 8542, 8662 Å) are detected. In the nebular spectrum (+171 days) besides H and Na I D the most prominent lines are identified as [Ca II] 7291, 7324 Å, O I 7774 Å and Ca II near–infrared triplet. H and Ca II lines present asymmetric profiles with two components: one with an higher Full Width at Half Maximum (FWHM), from which we inferred a velocity v 1400-1500 km s-1, and a narrow marginally resolved component of lower velocity, 600-850 km s-1. We note that the [O I] lines (6300, 6364Å) are very weak in the Dec.1 spectrum. Jerkstrand et al. (2012) and Maguire et al. (2012) suggest that high progenitor mass stars ( 19 M⊙) produce about a factor two more oxygen during their nucelosynthesis than low mass ones (M 15 M⊙), hence weakness (or total absence) of these lines supports the arguments for a lower mass progenitor for SN 2004eg (see sect. 7).
-
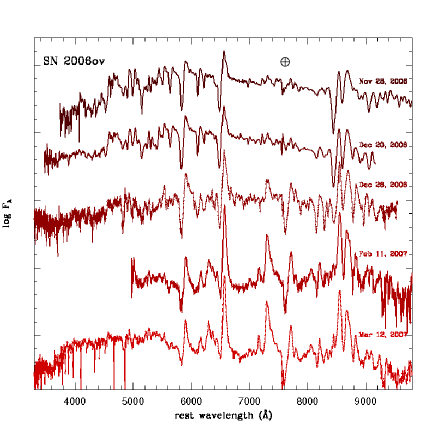
•
SN 2006ov - We collected five spectra of SN 2006ov (see Fig. 14): one at the end of the plateau phase (+93d), two during the post plateau drop (+115d and +121d) and two in the nebular phase (+168d and +197d).
The continuum at 93 days is red and many narrow P–Cygni lines are visible: H Balmer lines, O I 7774, Ca II, Ba II (multiplet 1 at 4554, 4934 Å and multiplet 2 at 5854, 6142, 6497 Å), Sc II, Ti II and Cr II (for details see section 5.2), along with Na I D absorption features at 5890, 5896 Å. The velocities inferred from H and Sc II lines in this phase are v(H) 3320 km s-1 and v(Sc II) 1310 km s-1 (Tab. 15). The velocity v(H) is significantly lower than those measured in normal type IIP SNe, but at the same time is relatively high when compared with those of other LL SNe IIP at a similar phase (v(H) = 1070, 1190, 1130 km s-1 for SN 1999eu, SN 2001dc, SN 2003Z, respectively). This effect in SN2006ov is probably due to H being blended with other lines, including Ba II 6497 Å.
The spectra in the post plateau phase show even redder continua, in agreement with the colour evolution discussed above. In this phase the gradual fading of permitted P–Cygni metal lines is observed, with forbidden emission lines, such as [O I], [Fe I], [Fe II], [Ca II], becoming more prominent with time.
As the supernova ages, the main spectral features become [Ca II] doublet 7291, 7323 Å, Ca II IR triplet 8498, 8542, 8662 Å and [O I] 6300, 6364 Å. Noticeably, O I 7774 remains particularly prominent.
5.2 Common spectral properties in LL SNe IIP
On the basis of the data set presented here and in previous papers (Turatto et al., 1998; Benetti et al., 2001; Pastorello et al., 2004, 2006, 2009), we investigate the general spectral properties of an extensive sample of low-luminosity SNe IIP.
Phase 30d. The evolution of low-luminosity type IIP SNe during the early photospheric phase is well illustrated by the spectral sequences of SN 2002gd and SN 2003Z. During the first 2-3 weeks, the spectra of LL SNe IIP are dominated by a blue continuum and only Balmer H lines and He I 5876Å are detectable, showing relatively weak and shallow P–Cygni profiles. Afterwards, Ca II H&K lines (3934, 3968 Å), Fe II (especially the lines of the multiplet 42 at 4924, 5018 and 5169 Å), O I 7774 Å and the Ca II infrared triplet (8498, 8542, 8662 Å) become prominent, while He I 5876Å disappears being replaced by Na I D (5890, 5896 Å). The qualitative spectral evolution of these LL SNe during this period is similar to that of SNe IIP with higher luminosities and kinetic energies.
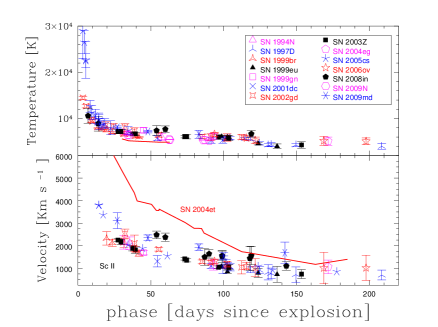
We measured the expansion velocities of the ejecta from the position of the absorption minima of both and Sc II 6246 Å lines, and the temperatures via blackbody fits to the spectral continuum over regions not affected by line blanketing. The inferred values are reported in Table 12. During the first weeks after core-collapse the photospheric velocity, inferred from the Sc II 6246Å minimum (Fig 15, bottom panel), rapidly decreases, reaching 4000 km s-1 at about two weeks, and 2000 km s-1 at 30 days. Fig. 15 illustrates the expansion velocity of the normal SN IIP SN 2004et (Maguire et al., 2010) for comparison. It is evident that the expansion velocities of LL SNe are lower at any epoch by a factor 2-3 than those of SN 2004et.
The temperature evolution is shown in Fig. 15 (top panel) for the whole sample of LL SNe IIP. As a reference we plot the temperature evolution of the normal type IIP event SN 2004et (Maguire et al., 2010). With age, the continuum, which is initially very blue, becomes rapidly redder (T 10000 K at phase 10 days, and T 6000-8000 K at phase 30 days). The evolution of all the objects of the sample is remarkably homogenous and similar to those of SN 2004et.
Phase 30-120d. With cooling, the absorption lines become deeper and shift to redder wavelengths. During the plateau phase, between days 30 and 120, narrow metal lines appear, viz. Ba II, Sc II, Fe II, Sr II, Cr II, Ti II (with many multiplets visible below 5400 Å). With time the absorption line components become narrower and more prominent, and Ba II lines become among the strongest features in the SN spectrum.
After the fast drop observed during the earliest period, the expansion velocity settles onto a more gentle decline, with v(ScII) slowing from 2000 to 1000 km s-1 between day 30 and 120. A similar behaviour is observed also in the temperature evolution (Fig. 15), with temperatures remaining almost constant around 5500-6500 K up to 120 days. This temperature is close to the recombination temperature for the hydrogen as the photosphere recedes through the envelope.
Phase 120d. The end of the recombination phase corresponds to a further decline in the continuum temperature, which settles at T 4000-5000 K as the supernova enters its nebular phase.
The transition to the nebular phase (well visualized by the spectral sequence of SN 2006ov) is characterized by the progressive fading in the strength of permitted metal lines and by the appearance of forbidden emissions: [O I] 6300, 6364 Å, [Fe II] 7155 Å, [Ca II] 7291, 7324 Å. The nebular spectra are very similar to those observed in normal type IIP: the same forbidden lines are visible but with narrower profiles.
The expansion velocities of the ejecta after 4-5 months, as measured from the FWHM of the strongest lines, are below 1000 km s-1, still a factor 2-3 times lower than those of normal SNe IIP, and they remain roughly constant during the subsequent months.
| Phase | v(H) km s-1 | v(ScII) km s-1 | Tcont (K) |
| SN 1999gn | |||
| 45.7 | 2130 (120) | 1690 (100) | 7500 (500) |
| SN 2002gd | |||
| 3.5 | 5290 (250) | - | 14500 (300) |
| 5.7 | 5140 (180) | - | 12700 (400) |
| 9.1 | 5010 (330) | - | 9700 (600) |
| 10.0 | 4920 (250) | - | 9400 (400) |
| 19.0 | 4680 (340) | - | 8500 (800) |
| 24.4 | 4480 (170) | - | 8300 (600) |
| 32.3 | 4160 (200) | 2540 (200) | 8100 (800) |
| 38.8 | 3990 (170) | 2110 (360) | 7300 (700) |
| 55.5 | 3580 (170) | 1840 (80) | 6500 (500) |
| 85.3 | 2840 (350) | 1300 (70) | 6100 (400) |
| 91.3 | 2680 (320) | 1250 (90) | 6000 (700) |
| 102.3 | 2530 (450) | 1180 (130) | 5900 (800) |
| 112.3 | 2370 (500) | 1040 (290) | 6000 (600) |
| SN 2003Z | |||
| 27.5 | 4380 (260) | 2250 (60) | 7200 (250) |
| 29.5 | 4260 (230) | 2170 (120) | 7200 (450) |
| 37.6 | 3980 (300) | 1890 (120) | 6700 (350) |
| 39.5 | 3900 (300) | 1820 (160) | 6700 (350) |
| 73.4 | 1660 (100) | 1420 (60) | 6100 (300) |
| 74.6 | 1520 (70) | 1350 (70) | 6100 (500) |
| 96.5 | 1130 (60) | 1040 (60) | 6000 (500) |
| 103.5 | 1070 (100) | 1050 (120) | 5800 (600) |
| 153.4 | 810 (100) | 740 (200) | 4300 (700) |
| SN 2004eg | |||
| 93 | 1220 (70) | 1160 (240) | 6200 (600) |
| 171.6 | 1440 (410) | 1060 (300) | 5100 (900) |
| SN 2006ov | |||
| 93.7 | 3320 (470) | 1310 (100) | 6600 (400) |
| 115.7 | 2980 (580) | 1090 (160) | 5800 (600) |
| 121.7 | 2800 (600) | 1030 (400) | 5300 (700) |
| 168.7 | 1920 (430) | 1010 (700) | 5200 (1000) |
| 197.7 | 1764 (660) | 1020 (560) | 5100 (700) |
6 Systematics
Core collapse SNe show a wide variety of properties depending on the configuration of their progenitor stars at the explosion. Even within the subclass of H-rich SNe (IIP) the observed parameters cover a wide range of values. Hamuy (2003) found that the physical parameters of SNe IIP, in particular the average plateau luminosity, the expansion velocity measured at the recombination, the ejected 56Ni mass, the total mass of the ejecta and the kinetic energy, are well correlated. However, the analysis of Hamuy (2003) was biased toward bright objects, and LL SNe IIP were under-sampled. Based on only five objects, Pastorello et al. (2004) indicated that LL SNe IIP are not an independent class of core–collapse SNe but rather the low velocity, low 56Ni mass, low energy tail in the distribution of type IIP SNe. Here we want to verify this issue on a much larger sample.
During the nebular phase, the SN luminosity is powered by radioactive decay chain 56Ni 56Co 56Fe, and its subsequent deposition of -rays and positrons. The ejecta is still opaque to -rays therefore the bolometric luminosity at late phases can be considered a good indicator of the amount of 56Ni mass ejected in the explosion. Since typically only optical band observations are available, the pseudo-bolometric light curve obtained integrating the fluxes over several passbands (BVRI) can be used as a first approximation to estimate the 56Ni mass. Comparing the late-time pseudo-bolometric luminosities of our SN sample with those of SN 1987A in the same bands and at the same epochs, we can estimate the 56Ni mass ejected by our sample of LL SNe IIP via the relation:
| (3) |
A summary of the 56Ni masses as derived from the above relation is reported in Tab. 13, along with other observables for our SN sample. In the case of SN 2002gd only upper detection limits are available and therefore only an upper limit on the ejected 56Ni mass is calculated. Moreover, in the case of SN 2005cs we noticed that the ratio optical/infrared fluxes in the nebular stages is significantly different from that of SN 1987A (this means that considering the BVRI luminosity contribution only does not give a good tool to evaluate the Ni mass of SN 2005cs) . For this reason, in the case of SN 2005cs, we derived the nickel mass by comparing the quasi-bolometric (UVOIR) luminosities instead of the BVRI luminosities.
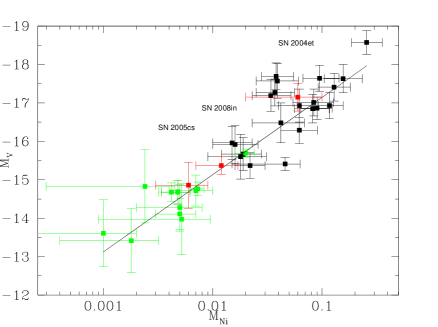
We investigate the correlation between the absolute magnitude of the plateau in the V band and the ejected 56Ni mass derived by Hamuy (2003, see Fig. 16), considering the entire sample of LL SNe IIP (green squares) and an extensive sample of normal to luminous SNe IIP (black squares), the SN sample presented by Hamuy (2003), plus the normal type IIP SNe 2003gd (Hendry et al., 2005), 2004A (Hendry et al., 2006) and 2004et (Maguire et al., 2010). We plot with red squares SN 2004et as representative of a normal SNe IIP, SN 2005cs as representative of LL SNe IIP and SN 2008in (Roy et al., 2011) as an intermediate case (see section 7). LL SNe IIP appear to fill the observational gap between the ultra-faint SN 1999br (Pastorello et al., 2004) and the normal type IIP events. In spite of a large dispersion, LL SNe IIP do not lie in a separate area of the diagram and, confirming the result of Hamuy (2003), we observe a continuum distribution in the ejected 56Ni mass with the SN luminosity in our enlarged sample. Using a weighted least-squares method, we estimate a correlation coefficient of and for the normal and entire sample respectively. In other words, there is clear evidence that SNe with brighter plateaus produce more 56Ni.
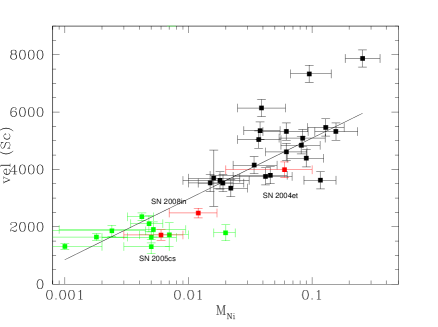
In Fig. 17 we tested the correlation between the photospheric expansion velocities, measured from the position of the minimum of the Sc II 6246 line at 50 days after the explosion, and the ejected 56Ni mass, extending the original sample of Hamuy to the new faint objects. Again, LL SNe IIP are labeled with green colours and normal-to-luminous SNe IIP with black colours. It is clear that SNe with larger expansion velocities are those producing more 56Ni, confirming once again the results of Hamuy (2003). Using a weighted least-squares method, we estimate a correlation coefficient of and for the normal and entire sample respectively.
From Figs. 16 and 17, we confirm that there exists a continuum in the properties of SNe type II from low luminosity, low velocity and Ni- poor events such as SN 1997D and SN 1999br, to high luminosity and high velocity SNe IIP (such as SN 1992am, Hamuy, 2003).
| SN | t0 (240 0000+) | Av | MV | MNi | Ref. | ||
| 1994N | 4945110 | 33.09 0.31 | 0.108 | -14.68 0.31 | 0.005 0.001 | 2110 280 | 1, 4 |
| 1997D | 5036115 | 30.74 0.92 | 0.058 | -13.97 0.92 | 0.005 0.004 | 1910 260 | 2, 3, 4 |
| 1999br | 51278 3 | 30.97 0.83 | 0.065 | -13.42 0.83 | 0.002 0.001 | 1640 130 | 1 |
| 1999eu | 5139415 | 30.85 0.87 | 0.073 | -13.61 0.87 | 0.001 0.001 | 1320 110 | 1, 4 |
| 2001dc | 510475 | 32.64 0.38 | 1.250 | -14.11 0.40 | 0.005 0.002 | 1310 250 | 1 |
| 2002gd | 525522 | 32.87 0.35 | 0.184 | -15.49 0.35 | 0.003 | 1840 80 | 4 |
| 2003Z | 526654 | 31.70 0.60 | 0.106 | -14.28 0.61 | 0.005 0.003 | 1630 190 | 4 |
| 2004eg | 5317030 | 32.64 0.38 | 1.237 | -14.72 0.40 | 0.007 0.003 | 1730 100 | 4 |
| 2005cs | 535491 | 29.46 0.60 | 0.155 | -14.86 0.60 | 0.006 0.003 | 1715 180 | 5, 6 |
| 2006ov | 539746 | 30.5 0.95 | 0.061 | -14.83 0.95 | 0.002 0.002 | 1860 200 | 4 |
| 2008bk | 545501 | 27.68 0.13 | 0.065 | -14.80 0.13 | 0.007 0.001 | - | 7, 8 |
| 2008in | 548251 | 30.60 0.20 | 0.305 | -15.37 0.23 | 0.012 0.005 | 2480 170 | 9 |
| 2009N | 548481 | 31.67 0.11 | 0.350 | -15.59 0.12 | 0.020 0.004 | 1790 280 | 10 |
| 2009md | 551628 | 31.64 0.21 | 0.310 | -14.68 0.24 | 0.004 0.001 | 2350 130 | 11 |
| 2010id | 554522 | 32.86 0.50 | 0.167 | -13.99 0.51 | - | 2040 180 | 12 |
| 2004et | 532701 | 28.85 0.34 | 1.271 | -17.15 0.27 | 0.056 0.040 | 3990 270 | 13, 4 |
7 Discussion
Theory predicts that stars with ZAMS masses between 8-9 M⊙ and 25-30 M⊙ end their lives as type IIP SNe (e.g. Heger et al. 2003). The lower limit for this main sequence mass range is set by the heaviest stars that are expected to produce a white dwarf whilst the upper limit depends on the details of the pre-SN evolution and the explosion mechanism, and is deeply related to still uncertain parameters such as overshooting, mixing and mass loss rate (see e.g. Woosley, Heger, & Weaver, 2002).
Three different possible configurations for the progenitors have been proposed to explain the energetics and the overall properties of LL Type IIP SNe: i) a red supergiant star of about 12 M⊙ which terminates its life when it exhausts the nuclear fuel and its iron core is no longer sustained against gravitational collapse; ii) an explosion of a more massive (M M⊙) star in which a considerable fraction of the material ejected in the explosion falls back into the compact remnant (this event is sometimes labelled as fall-back SN); iii) stars in the mass range 8-11 M⊙ that forms a degenerate NeO core during the final stage of its evolution and explodes as an electron capture SN.
In the last decade major efforts have been devoted to constrain the mass of the progenitors of LL type IIP SNe. Those were based on two different approaches, i.e. by comparing observations (light curves, colours, spectra) with hydrodynamical models and by direct detection of the progenitor stars in pre-SN images. With the latter approach, after measuring the brightness and colour of the star, the mass can be computed through a comparison with stellar evolution models (see Smartt, 2009 for a review). The mass estimates through the two different approaches have been shown to provide somewhat discrepant results with hydrodynamical modelling providing often higher masses for the precursor of type IIP SNe.
In this section we aim to derive the physical parameters of two representative objects by hydrodynamical modelling of the SN data: SN 2005cs (which has excellent observational coverage and one can consider it a template for LL SNe IIP) and SN 2008in (an intermediate object between normal and faint SNe IIP). This work is the starting point for a detailed analysis through the modelling of the physical parameters of our full sample of LL SNe II-P that will be presented in a forthcoming paper (Pumo et al. in preparation).
We estimate the main physical properties of the progenitors at the explosion (i.e. the ejected mass, the progenitor radius and the explosion energy) through the hydrodynamical modelling of their main observables (i.e. bolometric light curve, evolution of line velocities and continuum temperature at the photosphere), using the same well-tested approach used for other observed CC-SNe (e.g. SNe 2007od, 2009bw, 2009E and 2012A; see Inserra et al., 2011, 2012, Pastorello et al., 2012, and Tomasella et al., 2013).
According to this approach, a simultaneous fit of the aforementioned observables against model calculations is performed with two codes: a semi-analytic code (Zampieri et al., 2003) which solves the energy balance equation for a homologously expanding envelope of constant density and the general-relativistic, radiation-hydrodynamics Lagrangian code presented in Pumo, Zampieri, & Turatto (2010) and Pumo & Zampieri (2011). The latter is able to simulate the evolution of the physical properties of the CC-SN ejecta and the behaviour of the main observables from the breakout of the shock wave at the stellar surface up to the nebular stage. The distinctive features of this new code are: a) an accurate treatment of radiative transfer coupled with relativistic hydrodynamics, b) a fully implicit Lagrangian approach to the solution of the coupled non-linear finite difference system of relativistic radiation-hydro equations, and c) a description of the evolution of ejected material which takes into account both the gravitational effects of the compact remnant and the heating effects linked to the decays of the radioactive isotopes synthesized during the CC-SN explosion.
The semi-analytic code is used to carry out a preparatory study aimed at determining the parameter space describing the CC-SN progenitor at the explosion and, consequently, to guide the more realistic, but time consuming simulations performed with the general-relativistic, radiation-hydrodynamics code.
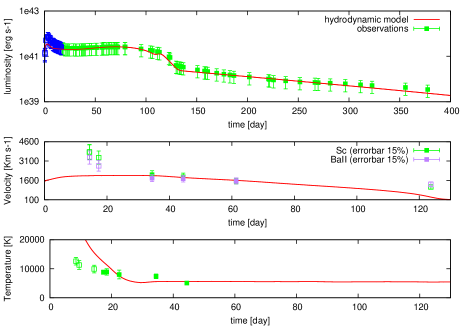
The approach of modelling with the two codes is appropriate, since the emission of SNe 2005cs and 2008in is dominated by the expanding ejecta. In performing the fit, we have neglected the observations obtained before the full relaxation of the plateau ( 20d) when the observables are significantly affected by emission from the outermost shell of the ejecta (see Pumo & Zampieri, 2011 for details). After shock passage, this shell, that contains only a small fraction of the envelope mass (few tenths of solar masses), is accelerated to very high velocities and is not in homologous expansion. The structure, evolution and emission properties of this shell are not well reproduced in our simulations because at present we adopt an ”ad hoc” initial density profile, not derived from an explosion simulation coupled with pre-SN evolutionary models.
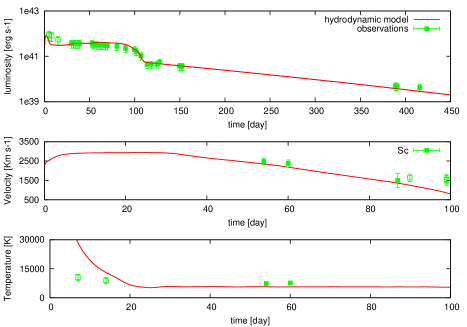
For SN 2005cs, assuming a 56Ni mass of 0.0065 M⊙, an explosion epoch JD and a distance modulus of mag (see Tab.13), the best fit returns values of total (kinetic plus thermal) energy of foe, initial radius of cm, and envelope mass of Menv = 9.5 M⊙, in good agreement with the parameters obtained from our previous modeling reported in Pastorello et al. (2009). The estimated uncertainty on the best-fit model parameters and is 20%. The values reported above are consistent with the explosion of a moderate mass star. Indeed, adding the mass of the compact remnant ( M⊙) to that of the ejected material, we obtain that the mass of the progenitor of SN 2005cs at the explosion was M⊙. Since the observables of all other LL SNe of our sample are rather similar to those of SN 2005cs, it is reasonable to assume that they share similar physical parameters as those inferred for SN 2005cs (a detailed analysis will be reported in Pumo et al., in prep.).
The situation is different for SN 2008in (Roy et al., 2011) whose observed parameters are intermediate between those of canonical SNe IIP and LL SNe IIP. As for SN 2005cs, adopting a 56Ni mass of 0.012 M⊙, an explosion epoch JD and a distance modulus of mag (see Tab. 13), the best fit model returns values of total (kinetic plus thermal) energy of foe, initial radius of cm, and envelope mass of Menv = 13 M⊙. Again, the estimated uncertainty on the best-fit model parameters and is 20%. These values are consistent with the explosion of an intermediate mass star, slightly more massive than the progenitor of SN 2005cs. Adding the mass of the compact remnant to that of the ejected material, we obtain that the mass of the progenitor of SN 2008in at the explosion was of M⊙.
Up to now, a relatively small number of LL SNe IIP have been discovered. This is plausibly due to selection effects due to their faint intrinsic luminosity rather than intrinsic rarity. Among this restricted sample, hydrodynamical models were compared with observables of five objects (SN 1997D, SN 1999br, SN 2003Z, SN 2005cs, SN 2008in).
Zampieri et al. (2003) found a relatively massive progenitor (19M⊙) for SN 1997D (revised downwards to 14 2 M⊙ in Zampieri, 2007). The low amount of 56Ni observed was explained as due to fallback of material onto the collapsed remnant. An intermediate mass of 16M⊙ for the progenitor was found by Zampieri et al. (2003) for SN 1999br (revised to 10 1.5 M⊙ in Zampieri, 2007) and of 15.9 1.5 M⊙ for SN 2003Z by Utrobin, Chugai, & Pastorello (2007). In the case of SN 2005cs, the best observed LL IIP SN, several groups reported hydrodynamic masses of 18.2 1 M⊙ (Utrobin & Chugai, 2008), 10-15M⊙ (Pastorello et al., 2009) to be compared with the new value of 11 M⊙ obtained here with the new hydrodynamical model. Finally, we find the mass of the progenitor of SN 2008in at the explosion to be 14.3 M⊙, in good agreement with Utrobin & Chugai (2013) who found a progenitor mass of 15.5 2.2 M⊙ (including the mass loss effects) for the same object. The differences among the results obtained with different hydrodynamical approaches, are likely a consequence of different assumptions about the input physics (in particular the opacity) and of different choices of distance moduli or total extintion (e.g. = 29.62 vs = 29.26 and E(B-V) = 0.12 mag vs E(B-V) = 0.05 mag assumed by Utrobin & Chugai (2008) and Pastorello et al. (2009) respectively for SN 2005cs). Despite these differences, recent results from hydrodynamical modeling now converge to low–intermediate masses for LL SNe IIP.
Hydrodynamical models have been applied also to well studied normal SNe IIP, e.g. SN 1999em and SN 2004et. In the case of SN 1999em a pre-supernova radius of cm, an ejecta mass of 18-19 M⊙, an explosion energy of 1 - 1.3 foe and a radioactive 56Ni mass of 0.036 - 0.06 M⊙ were estimated (Utrobin, 2007b, Baklanov, Blinnikov, & Pavlyuk, 2005, Bersten, Benvenuto, & Hamuy, 2011). Larger values for the physical parameters were obtained in the case of SN 2004et: cm, Menv = 24.5 M⊙, foe, M M⊙ (Utrobin & Chugai, 2009).
Despite the fact that the values reported above were derived by different hydrodynamical codes with different assumption, physics, etc., we speculate that there could be a general trend in the parameters of type IIP SNe, as claimed by Hamuy (2003). Less energetic explosions preferentially produce less luminous events and lower mass of 56Ni. Moreover, the parameters inferred from data modeling of LL SNe IIP appear now to agree with the analysis of pre-SN images in suggesting that stars of relatively low-to-intermediate mass produce LL SNe while normal SNe IIP derive from progenitors of larger mass. A more sophisticated hydrodynamical modeling of LL SNe IIP is in progress (Pumo et al. in prep.) to strengthen this speculation.
8 Summary
In this paper we have presented new data for five LL SNe IIP and investigated their observational properties, comparing them with a comprehensive sample of objects. We have shown that all LL SNe IIP have very homogeneous photometric and spectroscopic evolutions. In particular they display surprisingly consistent colour evolutions, expansion velocities of the ejected material and amounts of 56Ni synthesized (see table 13). We have investigated the correlations of the ejected 56Ni masses with the plateau magnitudes and expansion velocities of the ejecta, and showed that these faint events are the low-luminosity tail of a continuous distribution of otherwise normal explosions, instead of a separate class of CC SNe. Finally we have discussed the preliminary results of a systematic hydrodynamical modelling of the observables of LL SNe IIP that will be presented more extensively in a forthcoming paper. The hydrodynamical masses estimates for SN 2005cs and for SN 2008in suggest that LL SNe IIP originate from low-to-intermediate mass stars in the range 10-15 M⊙, in good agreement with the mass trend suggested by the direct progenitor detection method (Smartt et al., 2009).
It seems that results from our modeling and direct detection of the progenitor in pre-explosion images are converging toward a low-to-intermediate mass scenario (see also Tomasella et al., 2013). Indeed the results presented in this paper for SN 2005cs and SN 2008in reduce the gap between progenitor masses estimated through hydrodynamical modeling or direct detection in pre-SN archive images, pointing to red supergiants of moderate mass or, less commonly, to super AGB stars (although the possibility to have electron-capture SN from super-AGB progenitor is strongly questioned, e.g. Eldridge, Mattila, & Smartt, 2007). Differences in the light curves or in the spectral properties among the events reported here could be trivially explained with slightly different values of energies, radii or ejected masses.
Acknowledgements
Based on observations made with:
- ESO Telescopes at the La Silla Paranal Observatory under programme ID 60.A-9013(A), ID 70.B-0338(A), ID 64.H-0467(B);
- The Cima Ekar 1.82m telescope of the INAF-Astronomical Observatory of Padua, Italy;
- The Liverpool Telescope operated on the island of La Palma by Liverpool John Moores University in the Spanish Observatorio del Roque de los Muchachos of the Instituto de Astrofisica de Canarias with financial support from the UK Science and Technology Facilities Council.
- the Nordic Optical Telescope, operated by the Nordic Optical Telescope Scientific Association at the Observatorio del Roque de los Muchachos, La Palma, Spain, of the Instituto de Astrofisica de Canarias.
- The William Herschel and the Jacobus Kapteyn telescopes operated on the island of La Palma by the Isaac Newton Group in the Spanish Observatorio del Roque de los Muchachos of the Instituto de Astrof sica de Canarias.
- The Italian Telescopio Nazionale Galileo (TNG) operated on the island of La Palma by the Fundaci n Galileo Galilei of the INAF (Istituto Nazionale di Astrofisica) at the Spanish Observatorio del Roque de los Muchachos of the Instituto de Astrofisica de Canarias.
We thank M.Riello, S.Gagliardi for observations of SN 2002gd and L. Di Fabrizio for observation of SN 2006ov.
We also thank R. Roy, K. Maguire and M. Fraser for informations on SN 2008in, SN 2004et and SN 2009md respectively.
We acknowledge the TriGrid VL project and the INAF-Astronomical Observatory of Padua for
the use of computer facilities. S.S. acknowledges the support of ASI contract n. I/023/12/0.
M.L.P. acknowledges the financial support from the PRIN-INAF 2011 Transient Universe: from ESO Large to PESSTO (P.I. S. Benetti). A.P., M.T. S.B., E.C. and A.H. are also partially supported by the same PRIN.
The research leading to these results has received funding from the European Research Council under the European Union’s Seventh Framework Programme (FP7/2007-2013)/ERC Grant agreement no [291222] (PI : S. J. Smartt).
N.E.R. is supported by the MICINN grant AYA2011-24704/ESP, by the ESF EUROCORES Program EuroGENESIS (MICINN grant EUI2009-04170), by SGR grants of the Generalitat de Catalunya, and by EU-FEDER funds.
G.P. received partial support from Center of Excellence in Astrophysics and Associated Technologies (PFB 06)
This research has made use of the NASA/IPAC Extragalactic Database (NED) which is operated by the Jet Propulsion Laboratory, California Institute of Technology, under contract with the National Aeronautics and Space Administration.
We acknowledge the usage of the HyperLeda database (http://leda.univ-lyon1.fr).
References
- Ayani & Yamaoka (1999) Ayani K., Yamaoka H., 1999, IAUC, 7336, 1
- Baklanov, Blinnikov, & Pavlyuk (2005) Baklanov P. V., Blinnikov S. I., Pavlyuk N. N., 2005, AstL, 31, 429
- Benetti et al. (2001) Benetti S., et al., 2001, MNRAS, 322, 361
- Benetti et al. (2002) Benetti S., Altavilla G., Pastorello A., Riello M., Turatto M., Zampieri L., Cappellaro E., Germany L., 2002, IAUC, 7987, 3
- Berger et al. (2009) Berger E., et al., 2009, ApJ, 699, 1850
- Bersten, Benvenuto, & Hamuy (2011) Bersten M. C., Benvenuto O., Hamuy M., 2011, ApJ, 729, 61
- Blondin et al. (2006) Blondin S., Modjaz M., Kirshner R., Challis P., Berlind P., 2006, CBET, 757, 1
- Boles et al. (2003) Boles T., Beutler B., Li W., Qiu Y. L., Hu J. Y., Schwartz M., 2003, IAUC, 8062, 1
- Bond et al. (2009) Bond H. E., Bedin L. R., Bonanos A. Z., Humphreys R. M., Monard L. A. G. B., Prieto J. L., Walter F. M., 2009, ApJ, 695, L154
- Botticella et al. (2009) Botticella M. T., et al., 2009, MNRAS, 398, 1041
- Brown et al. (2007) Brown P. J., et al., 2007, ApJ, 659, 1488
- Chugai & Utrobin (2000) Chugai N. N., Utrobin V. P., 2000, A&A, 354, 557
- Crockett et al. (2011) Crockett R. M., Smartt S. J., Pastorello A., Eldridge J. J., Stephens A. W., Maund J. R., Mattila S., 2011, MNRAS, 410, 2767
- de Mello, Benetti, & Massone (1997) de Mello D., Benetti S., Massone G., 1997, IAUC, 6537, 1
- Dimai & Li (1999) Dimai A., Li W., 1999, IAUC, 7335, 1
- Dessart et al. (2008) Dessart L., et al., 2008, ApJ, 675, 644
- Dessart et al. (2013) Dessart L., Hillier D. J., Waldman R., Livne E., 2013, arXiv, arXiv:1305.3386
- Eldridge, Mattila, & Smartt (2007) Eldridge J. J., Mattila S., Smartt S. J., 2007, MNRAS, 376, L52
- Filippenko & Chornock (2002) Filippenko A. V., Chornock R., 2002, IAUC, 7987, 4
- Filippenko et al. (2004) Filippenko A. V., Ganeshalingam M., Serduke F. J. D., Hoffman J. L., 2004, IAUC, 8404, 1
- Foley et al. (2009) Foley R. J., et al., 2009, AJ, 138, 376
- Fraser et al. (2011) Fraser M., et al., 2011, MNRAS, 417, 1417
- Gal-Yam et al. (2011) Gal-Yam A., et al., 2011, ApJ, 736, 159
- Garcia (1993) Garcia A. M., 1993, A&AS, 100, 47
- Hamuy (2002) Hamuy M., 2002, IAUC, 7987, 2
- Hamuy (2003) Hamuy M., 2003, ApJ, 582, 905
- Heger et al. (2003) Heger A., Fryer C. L., Woosley S. E., Langer N., Hartmann D. H., 2003, ApJ, 591, 288
- Hendry et al. (2005) Hendry M. A., et al., 2005, MNRAS, 359, 906
- Hendry et al. (2006) Hendry M. A., et al., 2006, MNRAS, 369, 1303
- Inserra et al. (2011) Inserra C., et al., 2011, MNRAS, 417, 261
- Inserra et al. (2012) Inserra C., et al., 2012, MNRAS, 422, 1122
- Klotz & Jasinski (2002) Klotz A., Jasinski C., 2002, IAUC, 7990, 4
- Jerkstrand et al. (2012) Jerkstrand A., Fransson C., Maguire K., Smartt S., Ergon M., Spyromilio J., 2012, A&A, 546, A28
- Knop et al. (2007) Knop S., Hauschildt P. H., Baron E., Dreizler S., 2007, A&A, 469, 1077
- Harutyunyan et al. (2008) Harutyunyan A. H., et al., 2008, A&A, 488, 383
- Kochanek et al. (2012) Kochanek, C. S., Khan, R., & Dai, X. 2012, ApJ, 759, 20
- Kulkarni et al. (2007) Kulkarni S. R., et al., 2007, Natur, 447, 458
- Li et al. (2006) Li W., Van Dyk S. D., Filippenko A. V., Cuillandre J.-C., Jha S., Bloom J. S., Riess A. G., Livio M., 2006, ApJ, 641, 1060
- Li et al. (2007) Li W., Wang X., Van Dyk S. D., Cuillandre J.-C., Foley R. J., Filippenko A. V., 2007, ApJ, 661, 1013
- Maguire et al. (2010) Maguire K., et al., 2010, MNRAS, 404, 981
- Maguire et al. (2012) Maguire K., et al., 2012, MNRAS, 420, 3451
- Matheson et al. (2003) Matheson T., Challis P., Kirshner R., Calkins M., 2003, IAUC, 8063, 2
- Mattila et al. (2008) Mattila S., Smartt S. J., Eldridge J. J., Maund J. R., Crockett R. M., Danziger I. J., 2008, ApJ, 688, L91
- Maund, Smartt, & Danziger (2005) Maund J. R., Smartt S. J., Danziger I. J., 2005, MNRAS, 364, L33
- Maund & Smartt (2005) Maund J. R., Smartt S. J., 2005, MNRAS, 360, 288
- Maund et al. (2013) Maund J. R., Mattila S., Ramirez-Ruiz E., Eldridge J. J., 2013, arXiv, arXiv:1308.4393
- Maund, Reilly, & Mattila (2013) Maund J., Reilly E., Mattila S., 2013, arXiv, arXiv:1302.7152
- Nakano, Itagaki, & Kadota (2006) Nakano S., Itagaki K., Kadota K., 2006, CBET, 756, 1
- Nomoto (1984) Nomoto K., 1984, ApJ, 277, 791
- Pastorello et al. (2004) Pastorello A., et al., 2004, MNRAS, 347, 74
- Pastorello et al. (2006) Pastorello A., et al., 2006, MNRAS, 370, 1752
- Pastorello et al. (2007) Pastorello A., et al., 2007, Natur, 449,
- Pastorello et al. (2009) Pastorello A., et al., 2009, MNRAS, 394, 2266
- Pastorello et al. (2012) Pastorello A., et al., 2012, A&A, 537, A141
- Pumo (2007) Pumo M. L., 2007, MmSAI, 78, 689
- Pumo et al. (2009) Pumo M. L., et al., 2009, ApJ, 705, L138
- Pumo, Zampieri, & Turatto (2010) Pumo M. L., Zampieri L., Turatto M., 2010, MSAIS, 14, 123
- Pumo & Zampieri (2011) Pumo M. L., Zampieri L., 2011, ApJ, 741, 41
- Quimby et al. (2007) Quimby R. M., Wheeler J. C., Höflich P., Akerlof C. W., Brown P. J., Rykoff E. S., 2007, ApJ, 666, 1093
- Rau et al. (2009) Rau A., et al., 2009, PASP, 121, 1334
- Roy et al. (2011) Roy R., et al., 2011, ApJ, 736, 76
- Schlafly & Finkbeiner (2011) Schlafly E. F., Finkbeiner D. P., 2011, ApJ, 737, 103
- Smartt et al. (2004) Smartt S. J., Maund J. R., Hendry M. A., Tout C. A., Gilmore G. F., Mattila S., Benn C. R., 2004, Sci, 303, 499
- Smartt et al. (2009) Smartt S. J., Eldridge J. J., Crockett R. M., Maund J. R., 2009, MNRAS, 395, 1409
- Smartt (2009) Smartt S. J., 2009, ARA&A, 47, 63
- Smith et al. (2002) Smith J. A., et al., 2002, AJ, 123, 2121
- Smith et al. (2009) Smith N., et al., 2009, ApJ, 697, L49
- Skrutskie et al. (2006) Skrutskie M. F., et al., 2006, AJ, 131, 1163
- Takahashi, Yoshida, & Umeda (2013) Takahashi K., Yoshida T., Umeda H., 2013, arXiv, arXiv:1302.6402
- Takáts & Vinkó (2006) Takáts K., Vinkó J., 2006, MNRAS, 372, 1735
- Takáts et al. (2013) Takáts K., et al., 2013, MNRAS, 2896
- Tomasella et al. (2013) Tomasella L., et al., 2013, arXiv, arXiv:1305.5789
- Turatto et al. (1998) Turatto M., et al., 1998, ApJ, 498, L129
- Tsvetkov et al. (2006) Tsvetkov D. Y., Volnova A. A., Shulga A. P., Korotkiy S. A., Elmhamdi A., Danziger I. J., Ereshko M. V., 2006, A&A, 460, 769
- Utrobin, Chugai, & Pastorello (2007) Utrobin V. P., Chugai N. N., Pastorello A., 2007, A&A, 475, 973
- Utrobin (2007b) Utrobin V. P., 2007, A&A, 461, 233
- Utrobin & Chugai (2008) Utrobin V. P., Chugai N. N., 2008, A&A, 491, 507
- Utrobin & Chugai (2009) Utrobin V. P., Chugai N. N., 2009, A&A, 506, 829
- Utrobin & Chugai (2013) Utrobin V. P., Chugai N. N., 2013, arXiv, arXiv:1306.5122
- Valenti et al. (2009) Valenti S., et al., 2009, Natur, 459, 674
- Van Dyk, Li, & Filippenko (2003) Van Dyk S. D., Li W., Filippenko A. V., 2003, PASP, 115, 21
- Van Dyk et al. (2012) Van Dyk S. D., et al., 2012, AJ, 143, 19
- Walmswell & Eldridge (2012) Walmswell J. J., Eldridge J. J., 2012, MNRAS, 419, 2054
- Woosley, Heger, & Weaver (2002) Woosley S. E., Heger A., Weaver T. A., 2002, RvMP, 74, 1015
- Yoshii (2002) Yoshii Y., 2002, ntto.conf, 235
- Yoshii, Kobayashi, & Minezaki (2003) Yoshii Y., Kobayashi Y., Minezaki T., 2003, AAS, 35, 752
- Young, Boles, & Li (2004) Young J., Boles T., Li W., 2004, IAUC, 8401, 2
- Zampieri, Shapiro, & Colpi (1998) Zampieri L., Shapiro S. L., Colpi M., 1998, ApJ, 502, L149
- Zampieri et al. (2003) Zampieri L., Pastorello A., Turatto M., Cappellaro E., Benetti S., Altavilla G., Mazzali P., Hamuy M., 2003, MNRAS, 338, 711
- Zampieri (2007) Zampieri L., 2007, AIPC, 924, 358