11email: h.siejkowski@cyfronet.pl 22institutetext: Astronomical Observatory of the Jagiellonian University, ul. Orla 171, 30-244 Kraków, Poland 33institutetext: Astronomical Institute of Ruhr-University Bochum, Univeristätsstr. 150/NA7, D-44780 Bochum, Germany 44institutetext: Ruhr-University Bochum Research Department: Plasmas with Complex Interactions, Univeristätsstr. 150, D-44780 Bochum, Germany 55institutetext: Centre for Astronomy, Nicolaus Copernicus University, Faculty of Physics, Astronomy and Informatics, Grudziadzka 5, PL-87100 Toruń, Poland
3D global simulations of a cosmic-ray-driven dynamo in dwarf galaxies
Abstract
Context. Star-forming dwarf galaxies can be seen as the local proxies of the high-redshift building blocks of more massive galaxies according to the current paradigm of the hierarchical galaxy formation. They are low-mass objects, and therefore their rotation speed is very low. Several galaxies are observed to show quite strong magnetic fields. These cases of strong ordered magnetic fields seem to correlate with a high, but not extremely high, star formation rate.
Aims. We investigate whether these magnetic fields could be generated by the cosmic-ray-driven dynamo. The environment of a dwarf galaxy is unfavourable for the large-scale dynamo action because of the very slow rotation that is required to create the regular component of the magnetic field.
Methods. We built a 3D global model of a dwarf galaxy that consists of two gravitational components: the stars and the dark-matter halo described by the purely phenomenological profile proposed previously. We solved a system of magnetohydrodynamic (MHD) equations that include an additional cosmic-ray component described by the fluid approximation.
Results. We found that the cosmic-ray-driven dynamo can amplify the magnetic field with an exponential growth rate. The -folding time is correlated with the initial rotation speed. The final mean value of the azimuthal flux for our models is of the order of few G and the system reaches its equipartition level. The results indicate that the cosmic-ray-driven dynamo is a process that can explain the magnetic fields in dwarf galaxies.
Key Words.:
magnetohydrodynamics (MHD), dynamo, galaxies: magnetic fields, galaxies: dwarf, methods: numerical1 Introduction
Star-forming dwarf galaxies are smaller, fainter, and less massive than their spiral counterparts, but they are the most numerous population in the Universe (Blanton et al. 2002). The magnetic fields in dwarf galaxies may play a very important role. First, the observations show that the magnetic field is an important source of pressure for the interstellar medium (Boulares & Cox 1990). It is often assumed that the interstellar medium (ISM) in galaxies is in equipartition with the almost equally distributed energy in magnetic fields, cosmic rays, and turbulence. Second, these objects are less massive, hence the gravitational potential well is shallower and this facilitates the escape of the gas from the galaxy in the form of galactic winds (Mac Low & Ferrara 1999). This wind can also drag the magnetic field out of the disk into the intergalactic medium (IGM) since the magnetic field is frozen into the outflowing plasma. Possible magnetisation of the IGM via the magnetised wind has been studied by Bertone et al. (2006) and for dwarf galaxies by Kronberg et al. (1999) and Scannapieco & Brüggen (2010). Local simulations of the cosmic-ray dynamo process in dwarf galaxies (Siejkowski et al. 2010) show significant loss of the magnetic field from the domain and it depends on the supernova rate (SNR). Studies of dwarf galaxy formation by Dubois & Teyssier (2010) also implied IGM seeding via galactic winds. Additionally, there are studies on galactic winds driven by cosmic rays by Booth et al. (2013) and Hanasz et al. (2013).
Strong magnetic fields were discovered in a bright dwarf irregular galaxy NGC 4449 with a total field strength of about 12 G and a regular component of up to 8 G (Klein et al. 1996; Chyży et al. 2000). Kepley et al. (2010) reported similar magnetic fields in NGC 1569. The radio observations of these two galaxies show some large-scale magnetic fields with a sign of a spiral pattern, but no optical counterparts. The rotation measure maps imply that the magnetic field is almost parallel to the disk plane. In other dwarf objects such as NGC 6822, IC 10 (Chyży et al. 2003) and the Large Magellanic Cloud (Klein et al. 1989; Gaensler et al. 2005) the observed magnetic fields are weaker, reaching a value about 5-7 G. It is worth noting that these galaxies, especially NGC 1569 and NGC 4449, are under strong influence of infalling gas from the surroundings, which have a significant impact on the magnetic-field structure.
Observations of the above mentioned objects brought some insight into the dynamo process in dwarf galaxies, but all these objects are optically bright and showed disturbed kinematics. Therefore the sample might be influenced by strong selection effects. Chyży et al. (2011) completed a sample of dwarf and small irregular galaxies from the Local Group. They found that the star formation rate (SFR) regulates the strength of magnetic fields, because the supernova rate, which is proportional to the SFR, contributes to drive the turbulence in the ISM. These results are very similar to the conclusions of our previous theoretical study (Siejkowski et al. 2010) of the cosmic-ray-driven dynamo in the medium of irregular galaxies. Chyży et al. (2011) have also investigated a possible relation between the maximum and the magnetic-field strength. For slow rotation all galaxies have weak fields, below 4 G. With increasing maximum rotation speed in the following objects the observed magnetic fields are stronger. However, some objects, such as NGC 4449, show very strong magnetic fields, but their rotation is rather slow. The relation of the magnetic field versus the maximum rotation speed is probably distorted by the fact that objects with strong magnetic fields are undergoing heavy star formation. The contribution to the turbulent energy by supernovae explosions can cause strong disturbances in the velocity pattern, therefore estimating the maximum rotation speed and assigning a clear rotation curve is difficult.
It is believed that the magnetic dynamo is responsible for the strength and structure of magnetic fields in galaxies (Beck 2009). One of the recent dynamo models is driven by thermal energy output from supernovae explosions, described by Gressel et al. (2008). These authors found that the -folding time of the amplification mechanism is about Myr and is dependent on the rotation speed. Another model suggested by Parker (1992) relies on the buoyancy instability of interstellar medium filled with magnetic fields and cosmic rays (Parker 1965). The cosmic-ray-driven dynamo was constructed for the first time within the framework of a local shearing box model by Hanasz et al. (2004). An extensive parameter study of this local model was presented in Hanasz et al. (2009a). The -folding time-scale of the magnetic-field amplification by the cosmic-ray-driven dynamo is generally comparable to the galactic rotation period and can be as short as 140 Myr (Hanasz et al. 2006). Siejkowski et al. (2010) investigated the cosmic-ray driven dynamo action in low-mass objects, such as dwarf- and intermediate-mass irregular galaxies. This study led to the following results: the growth rate of the magnetic field is strongly dependent on the rotation speed, but for objects with km s-1 the saturation of the dynamo is reached after the same period of time. The -folding time is also dependent on the SNR and the time of quiescent state (no supernovae activity). The larger the SNR, the faster the growth rate, but excessive supernova activity can suppress the dynamo action. Hanasz et al. (2009b) demonstrated cosmic-ray-driven dynamo action via global disk spiral galaxies, and Kulpa-Dybeł et al. (2011) confirmed the result for barred galaxies. They found that the azimuthal magnetic flux grows on a time-scale of about 270 Myr.
2 Numerical model and setup
To simulate the dwarf galaxy model a numerical code called Godunov-MHD was employed (Kowal et al. 2009). It solves the system of ideal magnetohydrodynamic (MHD) equations in a conservative form in 3D space. The key elements and assumptions of the cosmic-ray-driven dynamo global galactic model were adopted from Hanasz et al. (2009b). Below we describe our choice of simulation parameters. An isothermal equation of state was assumed, that is , where is the isothermal speed of sound set to 7 km s-1, which corresponds to a gas temperature of 6 000 K. We assumed the magnetic diffusivity to be constant and equal to 0.1 kpc2 Gyr cm2 s-1. The investigation by Hanasz et al. (2009a) showed that this value is optimal for the growth of the magnetic field in the buoyancy-driven dynamo.
The cosmic ray (CR) component is described by the diffusion-advection transport equation in terms of fluid approximation following Schlickeiser & Lerche (1985) and Hanasz & Lesch (2003). We related the CR pressure to the CR energy density via the adiabatic CR index, that is and adopted from Ryu et al. (2003). Following Giacalone & Jokipii (1999), we assumed that the diffusion of cosmic rays is anisotropic with respect to the direction of the magnetic field. The typical values of the diffusion coefficient found by modelling CR data (see e.g. Strong et al. 2007) are cm2 s-1. The applied value of the perpendicular CR diffusion coefficient is kpc2 Gyr cm2 s-1 and the parallel one is kpc2 Myr cm2 s-1. The parallel diffusion coefficient is 10% of the realistic value because the time-step of the explicit diffusion algorithm becomes prohibitively short when the diffusion coefficient is too high. The effect of the reduced CR diffusion coefficients was investigated by Hanasz et al. (2009a), showing that the magnetic-field growth only slightly depends on the value, but the key factor in the cosmic-ray-driven dynamo is the anisotropy of the diffusion.
A single supernova explosion was modelled by a 3D Gaussian distribution of cosmic-ray energy input and equals 10% of the canonical kinetic energy output of the supernova explosion, that is erg. In the initial period in , every one in ten explosions injects a randomly oriented dipole magnetic field into the ISM in addition to the CR energy input. The injection of the magnetic field is only to seed the dynamo action through a random field at the beginning of the simulation. We stopped the injection because (1) it allowed us to study the efficiency of the pure cosmic-ray-driven dynamo while the injected magnetic field was only the seed field and (2) after several hundred Myr the seeding becomes insignificant with respect to the existing field.
The position of each supernova explosion was chosen randomly with respect to the local gas density, that is . This follows the simple self-gravitational picture drawn by Schmidt (1959) and Kennicutt (1989), where the large-scale star formation rate volume density scales with . The number of supernovae is given by the supernova explosion frequency over the disk area. In our model its value was set to kpc-2 Gyr-1 and it was constant during whole simulation time. This value corresponds roughly to the density of the star formation rate (SFR) equal to yr-1 kpc-2 and is a typically found in non-starbursting dwarf galaxies (see e.g. Chyży et al. 2011).
| Parameter | v40 | v70 | Unit |
| Mass of stars | 1.0 | 6.0 | |
| 21.5 | 15.0 | kpc-3 | |
| 1.4 | 2.4 | kpc | |
| 29.5 | 29.5 | kpc-3 | |
| 1.2 | 3.6 | kpc | |
| 40 | 70 | km s-1 |
The dwarf galaxy potential well is given by two components: a dark-matter (DM) halo and a thin stellar disk. This type of galaxy has no bulge (Governato et al. 2010), which is present in more massive disk galaxies. In our model the stars are distributed in an infinitesimally thin Kuzmin disk following previous numerical works on dwarf galaxies (Marcolini et al. 2003, 2004). For the DM halo we used the purely phenomenological profile proposed by Burkert (1995). Its gravitational potential is described by
| (1) | ||||
where is the gravitational constant, is the central density, is the core radius, is the distance to the centre, and .
The gas distribution of a dwarf galaxy was set in hydrostatic equilibrium in its initial state. The gas density distribution in equatorial plane was assumed in the following form:
| (2) |
where and are the central gas density and core radius, respectively. To find the global gas distribution we used the potential method described in Wang et al. (2010). The detailed parameters of the gravitational potentials are shown in Tab. 1 and its values were mostly taken from Marcolini et al. (2003) with only slight modifications. From the gas distribution the CR component distribution was found, assuming that they are in pressure equilibrium. We assumed at .
The dwarf galaxy model was simulated in 3D Cartesian domain of size kpc in , , coordinates, respectively. The cell size was pc in each direction. Upper and lower boundary conditions were set to outflow, and we enforced the gas to follow the prescribed rotation curve in the horizontal domain boundaries.
3 Results and discussion
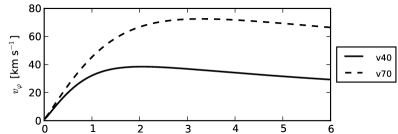
The models presented in Tab. 1 correspond to the different maximum rotation speeds. We set up models with km s-1 and 70 km s-1. The model v40 corresponds to objects like NGC 1569 or IC 10, while the v70 model mimics the Large Magellanic Cloud or NGC 6822 (e.g. Chyży et al. 2011). The rotation curves of these models are shown in Figure 1.
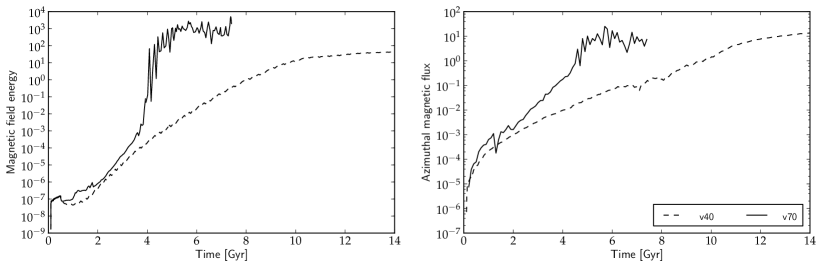
The evolution of the total magnetic energy and the magnetic flux are shown in Figure 2. In both models the magnetic-field energy and the magnetic flux are growing exponentially in time. The initial peak, visible up to Myr, is caused by the magnetic field injected into the system via the magnetised supernovae. Later the magnetic field injection was stopped, and the magnetic growth was only caused by the operation of the dynamo.
After the initial injection of the magnetic field the system experiences a period of stabilization and the magnetic-field energy decreases by about half an order of magnitude. After this, at about Gyr, the magnetic field starts to be amplified. In the evolution of the magnetic flux we see a constant growth, without any stabilization periods. This is because the injected magnetic field is random and is ordered by the global rotation. This also suggests that during the stabilization period the randomly oriented magnetic field is expelled and/or dissipated by magnetic diffusivity beyond the simulation domain, while the ordered azimuthal magnetic flux is retained.
When the dynamo begins to operate effectively, the magnetic field and its azimuthal part are exponentially amplified in time. The growth rate of the azimuthal magnetic flux, measured by the -folding time, is different for each of the models and equals 1 023 Myr for v40 and 458 Myr for v70. For model v70 the equipartition level is reached at about Gyr. Around that time some peaks appear in the evolution of the magnetic-field energy, but when the equipartition level is reached - they become damped. In model v40 the equipartition level is reached at Gyr, but the transition is smoother than in the previous case. In both cases the saturation of the growth of occurs at the same time as for the magnetic energy.
| Model | SFR | ||
|---|---|---|---|
| [km s-1] | [ yr-1 kpc-2] | [G] | |
| v40 | 40 | 1.0 | |
| v70 | 70 | 8.0 | |
| Object | |||
| IC 1613 | 37 | ||
| NGC 4449 | 40 | ||
| NGC 1569 | 42 | ||
| IC 10 | 47 | ||
| NGC 6822 | 60 | ||
| LMC | 72 |
The final mean value of the magnetic field for model v40 is G and for model v70 it is G. The results are compared with the magnetic field found in observations of dwarf galaxies in Table 2. The model v70 can be compared with NGC 6822 and the Large Magellanic Cloud, which rotate as fast as 60-70 km s-1, and whose SFR is of the order of yr-1 kpc-2. In both cases the observed magnetic field is about 4 G. The model v40 with respect to its rotational velocity can be compared with galaxies such as IC 1613, IC 10, NGC 4449, and NGC 1569. The observed magnetic field in the first object is about 2.8 G, which agrees well with our simulations. In other objects the magnetic field is much higher, starting from 9 G up to even 14 G. However, these objects have a much higher SFR. In our modelling the applied supernova frequency is equivalent to yr-1 kpc-2, while in these galaxies the observed values are given in Table 2. The SFR value is comparable only for IC 1613, but in other cases the observed values are much higher. This leads to the conclusion that the enhanced SFR can increase the magnetic field in the galaxy disk, but to state it more clearly, more numerical investigations need to be made.
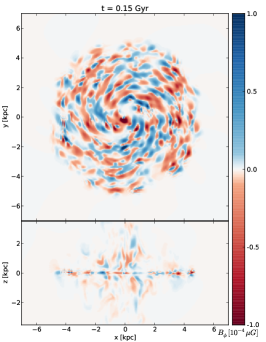
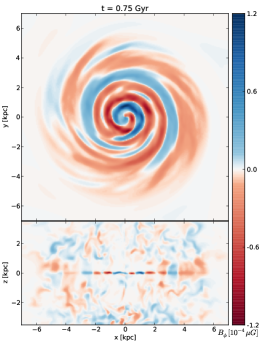
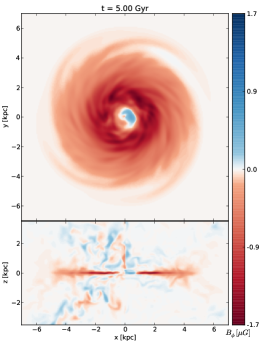
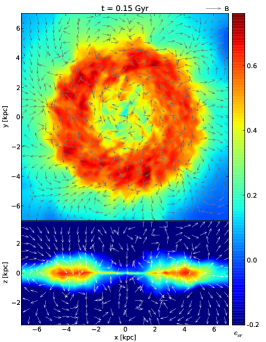
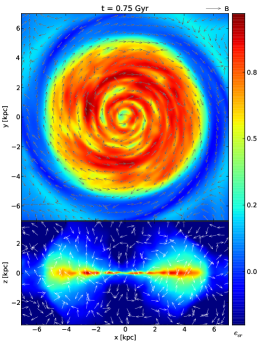
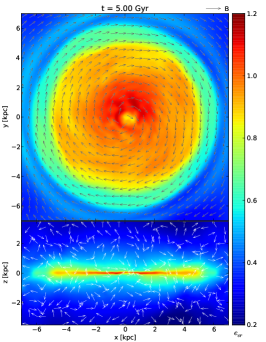
In Fig. 3 the slices through the domain of model v70 are shown for selected time-steps. The evolution of shows the initially randomly oriented magnetic field, injected through the magnetised supernova explosions, is efficiently regularised. In the plane at Gyr randomly positioned spots appear of a positive (blue) and negative (red) azimuthal magnetic field. In the cut a similar pattern is revealed but only very close to the disk midplane, that is there are no such structures in the halo. The differential rotation shears the radially aligned structures and forms a spiral pattern of an oppositely directed azimuthal magnetic field, which are clearly visible at Gyr. In the disk at the end of the simulation there is only negatively oriented magnetic azimuthal flux. The magnitude of is the strongest in the central part of the disk, and it slowly decreases with the radius. The negatively oriented flux is mostly located in the midplane of the galaxy, but it extends also to some vertical height in the form of a disk corona.
The initial state of the cosmic-ray energy follows the density distribution. As the system evolves and the supernovae explode, additional energy fluctuations appear (Figure 3 bottom panels) . Weak and wide streams of cosmic-ray energy form in the vertical direction; they start from the disk midplane and span up to the top and bottom domain boundaries (see Figure 3 at Gyr). These are the channels that transfer the cosmic-ray energy out of the domain.
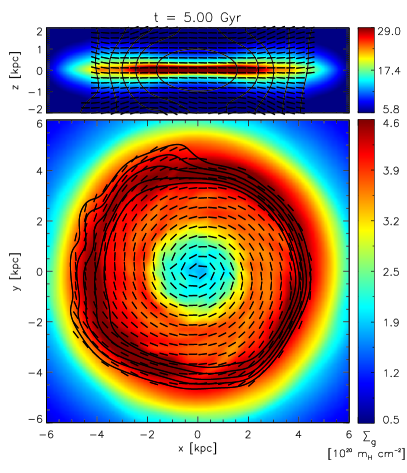
The result of each simulation are the 3D cubes of magnetic field and the CR energy density. Using the CR component as the proxy for the distribution of the relativistic electrons, one can create a synthetic maps of total power and polarised synchrotron radiation (for details see Otmianowska-Mazur et al. 2009, Sec. 3). Fig. 4 shows the polarisation map for model v70 at Gyr. The map shows the synthetic distribution of the polarised intensity at cm and the polarisation angles, both superimposed onto the column gas density. The polarised intensity in the disk region has a very strong gradient at the edge of the disk. The magnetic-field structure is dominated by the azimuthal component and the vertical slices through the computational domain show that the vertical magnetic-field component is relatively weak. The synthetic polarisation map of the simulated galaxy shows that the magnetic field has a very strong toroidal component and is almost perfectly parallel to the disk plane. Similar results have been found in observation of NGC 1569 by Kepley et al. (2010). This clearly hints at a long-term enhanced SFR in NGC 1569 as the origin of the magnetic field, with the current burst only modulating the field topology. The long enhanced SFR in NGC 1569 is consistent with the results from HST-based colour magnitude analyses (Vallenari & Bomans 1996).
4 Conclusions
We have shown for the first time a global model of the cosmic-ray-driven dynamo for a dwarf galaxy. The model consists of (1) exploding supernovae that supply the CR energy input and are distributed depending on the local gas density, (2) seeding the dynamo by randomly oriented dipoles injected with the first bursts of supernovae, (3) the Burkert DM profile, and (4) the ISM resistivity. We studied the evolution of the magnetic field for two galaxies characterised by different rotation speeds: 40 km s-1 and 70 km s-1. We found that
-
•
the cosmic-ray-driven dynamo operating in a dwarf galaxy can amplify regular magnetic fields exponentially in time, up to the saturation level that corresponds to the equipartition magnetic-field strength in real galaxies,
-
•
the -folding time-scales show that fast-rotating objects generate magnetic fields faster than the slow ones, which is consistent with the -dynamo paradigm (Brandenburg & Subramanian 2005),
-
•
the calculated time-scales for the magnetic-field energy evolution are compatible with those reported by Hanasz et al. (2009b) and Kulpa-Dybeł et al. (2011) for more massive galaxies that show an -folding time of the magnetic-field growth rate of about 300 Myr. In our results, the time-scales are about 450 Myr for v70 model and 1 000 Myr for v40, implying that the magnetic field in dwarfs is more the result of a long-term slightly enhanced star formation than due to one recent strong burst,
-
•
the 8 G magnetic fields generated in the model v70 are in the range of observed values presented in Chyży et al. (2011). The magnetic field generated in model v40 reaches the saturation phase after about 10 Gyr and the final values are also similar to those of real galaxies. One should keep in mind that the SFR history or interaction with the environment in real galaxies differs from the modelled ones, therefore the magnetic-field values do not match exactly.
The results of our modelling indicate that the cosmic-ray-driven dynamo can explain the observed magnetic fields in dwarf galaxies. In future work we plan to determine the influence of other parameters and perform more simulations to find and reproduce the observed relations.
Acknowledgements.
This work was supported by the by the Polish National Science Centre through the grants N N203 583440, N N203 511038, and NCN UMO-2011/03/B/ST9/01859. Calculations were made possible thanks to the PL-Grid Infrastructure, website: www.plgrid.pl. This research was supported by the partnership program between the Jagellionian University Kraków and the Ruhr-University Bochum. DJB is supported by the DFG special research unit FOR 1254 ”Magnetisation of Interstellar and Intergalactic Media: The Prospects of Low-Frequency Radio Observations”. We thank J. Gallagher for discussions.References
- Beck (2009) Beck, R. 2009, Ap&SS, 320, 77
- Bertone et al. (2006) Bertone, S., Vogt, C., & Enßlin, T. 2006, MNRAS, 370, 319
- Blanton et al. (2002) Blanton, M. R., Hogg, D. W., & SDSS Collaboration. 2002, in Bulletin of the American Astronomical Society, Vol. 34, American Astronomical Society Meeting Abstracts #200, 679
- Booth et al. (2013) Booth, C. M., Agertz, O., Kravtsov, A. V., & Gnedin, N. Y. 2013, ApJ, 777, L16
- Boulares & Cox (1990) Boulares, A. & Cox, D. P. 1990, ApJ, 365, 544
- Brandenburg & Subramanian (2005) Brandenburg, A. & Subramanian, K. 2005, Phys. Rep, 417, 1
- Burkert (1995) Burkert, A. 1995, ApJ, 447, L25
- Chyży et al. (2000) Chyży, K. T., Beck, R., Kohle, S., Klein, U., & Urbanik, M. 2000, A&A, 355, 128
- Chyży et al. (2003) Chyży, K. T., Knapik, J., Bomans, D. J., et al. 2003, A&A, 405, 513
- Chyży et al. (2011) Chyży, K. T., Weżgowiec, M., Beck, R., & Bomans, D. J. 2011, A&A, 529, A94
- Dubois & Teyssier (2010) Dubois, Y. & Teyssier, R. 2010, A&A, 523, A72
- Gaensler et al. (2005) Gaensler, B. M., Haverkorn, M., Staveley-Smith, L., et al. 2005, Science, 307, 1610
- Giacalone & Jokipii (1999) Giacalone, J. & Jokipii, J. R. 1999, ApJ, 520, 204
- Governato et al. (2010) Governato, F., Brook, C., Mayer, L., et al. 2010, Nature, 463, 203
- Gressel et al. (2008) Gressel, O., Elstner, D., Ziegler, U., & Rüdiger, G. 2008, A&A, 486, L35
- Hanasz et al. (2004) Hanasz, M., Kowal, G., Otmianowska-Mazur, K., & Lesch, H. 2004, ApJ, 605, L33
- Hanasz & Lesch (2003) Hanasz, M. & Lesch, H. 2003, A&A, 412, 331
- Hanasz et al. (2013) Hanasz, M., Lesch, H., Naab, T., et al. 2013, ApJ, 777, L38
- Hanasz et al. (2006) Hanasz, M., Otmianowska-Mazur, K., Kowal, G., & Lesch, H. 2006, Astronomische Nachrichten, 327, 469
- Hanasz et al. (2009a) Hanasz, M., Otmianowska-Mazur, K., Kowal, G., & Lesch, H. 2009a, A&A, 498, 335
- Hanasz et al. (2009b) Hanasz, M., Wóltański, D., & Kowalik, K. 2009b, ApJ, 706, L155
- Kennicutt (1989) Kennicutt, Jr., R. C. 1989, ApJ, 344, 685
- Kepley et al. (2010) Kepley, A. A., Mühle, S., Everett, J., et al. 2010, ApJ, 712, 536
- Klein et al. (1996) Klein, U., Hummel, E., Bomans, D. J., & Hopp, U. 1996, A&A, 313, 396
- Klein et al. (1989) Klein, U., Wielebinski, R., Haynes, R. F., & Malin, D. F. 1989, A&A, 211, 280
- Kowal et al. (2009) Kowal, G., Lazarian, A., Vishniac, E. T., & Otmianowska-Mazur, K. 2009, ApJ, 700, 63
- Kronberg et al. (1999) Kronberg, P. P., Lesch, H., & Hopp, U. 1999, ApJ, 511, 56
- Kulpa-Dybeł et al. (2011) Kulpa-Dybeł, K., Otmianowska-Mazur, K., Kulesza-Żydzik, B., et al. 2011, ApJ, 733, L18
- Mac Low & Ferrara (1999) Mac Low, M.-M. & Ferrara, A. 1999, ApJ, 513, 142
- Marcolini et al. (2003) Marcolini, A., Brighenti, F., & D’Ercole, A. 2003, MNRAS, 345, 1329
- Marcolini et al. (2004) Marcolini, A., Brighenti, F., & D’Ercole, A. 2004, MNRAS, 352, 363
- Otmianowska-Mazur et al. (2009) Otmianowska-Mazur, K., Soida, M., Kulesza-Żydzik, B., Hanasz, M., & Kowal, G. 2009, ApJ, 693, 1
- Parker (1965) Parker, E. N. 1965, ApJ, 142, 584
- Parker (1992) Parker, E. N. 1992, ApJ, 401, 137
- Ryu et al. (2003) Ryu, D., Kim, J., Hong, S. S., & Jones, T. W. 2003, ApJ, 589, 338
- Scannapieco & Brüggen (2010) Scannapieco, E. & Brüggen, M. 2010, MNRAS, 405, 1634
- Schlickeiser & Lerche (1985) Schlickeiser, R. & Lerche, I. 1985, A&A, 151, 151
- Schmidt (1959) Schmidt, M. 1959, ApJ, 129, 243
- Siejkowski et al. (2010) Siejkowski, H., Soida, M., Otmianowska-Mazur, K., Hanasz, M., & Bomans, D. J. 2010, A&A, 510, A97
- Strong et al. (2007) Strong, A. W., Moskalenko, I. V., & Ptuskin, V. S. 2007, Annual Review of Nuclear and Particle Science, 57, 285
- Vallenari & Bomans (1996) Vallenari, A. & Bomans, D. J. 1996, A&A, 313, 713
- Wang et al. (2010) Wang, H.-H., Klessen, R. S., Dullemond, C. P., van den Bosch, F. C., & Fuchs, B. 2010, MNRAS, 407, 705