e-mail: jaroluk3@ukr.net††thanks: 41, Nauky Ave., Kyiv 03028, Ukraine ††thanks: 64, Volodymyrs’ka Str., Kyiv 01601, Ukraine\sanitize@url\@AF@joine-mail: olikh@univ.kiev.ua††thanks: 41, Nauky Ave., Kyiv 03028, Ukraine\sanitize@url\@AF@joine-mail: jaroluk3@ukr.net
FEATURES OF ULTRASOUND
ABSORPTION BY DISLOCATIONS
IN
SUBGRAIN-FREE
Cd0.2Hg0.8Te CRYSTALS
Abstract
The temperature dependence of the ultrasound wave absorption in bulk -Cd0.2Hg0.8Te crystals free from low-angle grain boundaries has been studied experimentally for the first time in the frequency range 10–55 MHz and the temperature interval 150–300 K, and the corresponding results of measurements are presented. The maximum value of absorption coefficient is found to increase and to shift toward higher temperatures, as the ultrasound frequency grows. The results obtained can be satisfactorily explained in the framework of the Brailsford model, which associates the ultrasound absorption with vibrations of thermally activated dislocation kinks. The characteristic parameters of this model for -Cd0.2Hg0.8Te are determined; namely, the frequency coefficient 6 10 9 Hz and the kink diffusion activation energy 0.11 eV. The dislocation concentration is also evaluated ( 2 1010 m-2), with the determined value being consistent with that obtained by the selective etching method (0.7 1010 m-2).
1 Introduction
The more than semicentenial history of researches and the implementation into practice of photo-sensitive CdHgTe crystals showed that they remain a material of choice for IR radiation detectors [1, 2]. The basic electrophysical and photo-electric properties of this material are governed by extremely high concentrations of electrically active point-like (– m-3) and linear (a density of – m-2 for the growth dislocations) defects which interact with one another. The application of ultrasound is one of the methods to controllably vary the defect structure in both CdHgTe and other semiconductors [3, 4, 5]. In particular, it was found that the acoustically stimulated reconstruction of point defects, owing to their electric and deformation interaction with dislocations, results in changes in the concentration, mobility, and lifetime of free charge carriers in CdHgTe [6, 7]. However, for obtaining predictable results of such an influence, we must know the mechanism of interaction between ultrasonic waves and the crystal. The previous acoustic researches for CdHgTe [8, 9, 10, 11] were carried out with the use of lamellar specimens possessing a subgrain structure in the wafer plane. In particular, with the help of the internal friction (IF) method, it was found that the resonance absorption at low-angle boundaries (LABs) and the dislocation absorption in bulk are the dominating mechanisms of ultrasound losses in such specimens, with the latter process being well described with the use of the Granato–Lucke string model [12]. The described character of amplitude-dependent changes in the IF method is known to be realized at large amplitudes of mechanical stresses, when dislocations can detach from the weak pinning centers formed by point defects [13].
At the same time, provided that there exist the dislocation loops with short lengths (stoppers with weak pinning), and the mechanical deformations are small, another type of acoustic dislocation absorptions has to take place, when losses have a relaxation character and depend on the ultrasound frequency [14, 15]. Such a process of amplitude-independent absorption can be realized in the case where low-intensity ultrasound waves are used, e.g., in the pulse mode. This mode was used to measure the elastic moduli in CdHgTe [16, 17]. However, there are almost no results obtained for the temperature dependence of the absorption coefficient for ultrasound waves in this material. This circumstance is related to complicated conditions imposed on the geometry and the structural quality of specimens intended for acoustic measurements [15], as well as to the technological complexity of manufacturing the crystallographically oriented subgrain-free CdHgTe specimens.
Note that CdHgTe is an interesting model material, in view of the features of its crystalline structure, to study dislocations with the use of the ultrasound technique. Really, the motion of dislocations in a semiconductor occurs in a medium with a high concentration of electrically active point defects, which are closely connected with dislocations and essentially affect their motion.
This work was aimed at the experimental study of the temperature dependences of the ultrasound absorption coefficient in subgrain-free Cd0.2Hg0.8Te crystals and at the search of adequate models for the description of the acousto-dislocation interaction in them.
2 Specimens
Single-crystalline specimens in size and oriented in the directions and with an accuracy of were fabricated from an -Cd0.2Hg0.8Te ingot grown up at the affiliate “Pure Metal Plant” of the public corporation ”Pure Metals” (Svitlovodsk). The planeness and the parallelism of lateral edges satisfied the condition , where is the specimen length, and its variation at various points, which is necessary for the measurements of acoustic characteristics at multiple reflections of an ultrasound wave to be correct.
The high structural quality of examined specimens was verified by the reliable x-ray orientation of two crystallographic planes. Note that the experimental specimens were used earlier to study the anisotropy of CdHgTe elastic properties [17], and the results obtained agreed well with those of work [16].
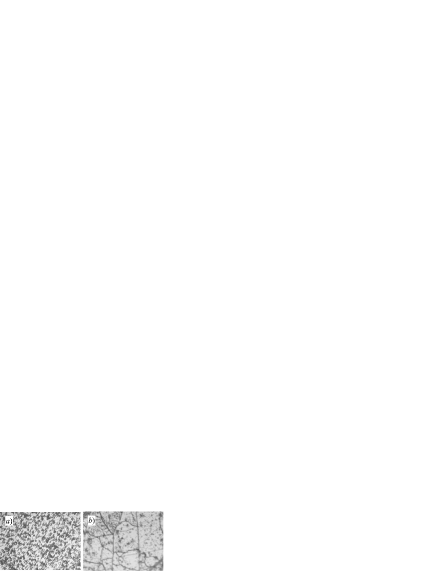
To study the dislocation structure in Cd0.2Hg0.8Te wafers, the method of dislocation etch was used. Immediately before the etching procedure, the specimen surface was treated with a polishing solution (0.2 ml of Br2 + 10 ml of CH3OH). Then the specimen was carefully washed out in, first, ethylene glycol and, afterward, isopropanol. For the selective etching, which was carried out at room temperature, the Schaake etchant (5 g of CrO3 + 3 ml of HCl + 15 ml of H2O) was used, which allowed dislocations to be revealed on both polar edges (111)A and (111)B, as well as on the surfaces with intermediate orientations [19]. The etching time varied from 20 to 60 s for various specimens. In Fig. 1, a, a typical photo of the researched specimen surface after its selective etching is shown. The obtained picture testifies to a uniform distribution of dislocations and no LAB formation. For comparison, a photo of a typical etched surface of Cd0.2Hg0.8Te crystal that contains LABs [20] is exhibited in Fig. 1, b. The evaluated dislocation concentration showed that, according to the selective etching data, m-2 in the studied specimens.
3 Measurement Procedure
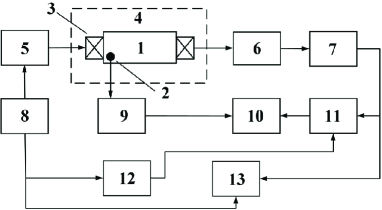
In order to measure the ultrasound absorption coefficient , the pulse-echo method was used. The block diagram of the corresponding experimental installation is shown in Fig. 2. Ultrasound pulses in the specimens were excited with the help of a piezoelectric transducer, and LiNbO3 wafers with the -cut were used for this purpose. The generated train of radio pulses was directed onto a piezoelectric transducer. The acoustic contact was provided in a wide temperature interval by applying silicone oil of the GKZh-94 type. Ultrasound pulses were reflected multiple times from the specimen end faces, so that a series of echoed radio pulses was formed on a piezoelectric receiver, which was identical to the emitting transducer. Video signals were monitored on an oscilloscope screen and, simultaneously, were directed to a stroboscopic converter and, afterward, to a personal computer. With the help of the developed software, the amplitudes of video signals were measured and averaged in time. We also monitored the time delay between the video-signal maxima and the synchronization pulse, which allowed us to account for the effect of temperature-induced variation of the ultrasound velocity.
The application of pulse excitation and high-frequency low-amplitude signals was aimed at implementing the mode of amplitude-independent ultrasound absorption. Our measurements confirmed that the value of really remains constant at room temperature and at the exciting radio pulse amplitude up to 3 V.
The absolute values of ultrasound absorption were measured to an accuracy of 10%.
4 Experimental Results and Their Discussion
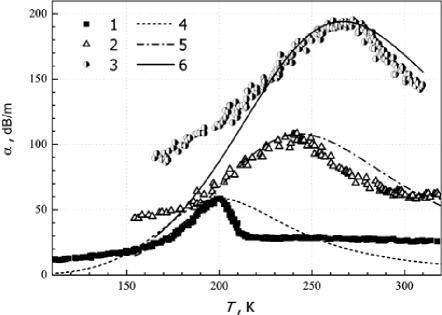
In Fig. 3, the experimentally measured temperature dependences of the absorption coefficient for longitudinal ultrasound waves with various frequencies propagating in -Cd0.2Hg0.8Te crystals along the direction are exhibited. One can see that each -dependence has a maximum, and the temperature of the maximum, , and the maximum absorption value depend on the ultrasound frequency . In particular, when increases from 11 to 55 MHz, the value of grows from 60 to 190 dB/m and that of from 199 to 270 (see also Table).
| , MHz | Experiment | Theory | ||||||
| Granato–Lucke model [15] | Brailsford model [18] | |||||||
| , | , | , | , | , | , | , | , | |
| K | dBm-1 | radс-1 | kg/m/s | m | eV | Hz | m-2 | |
| 11.2 | 6.8 | 3.3 | 4.1 | 2.3 | ||||
| 34.8 | 9.1 | 1.8 | 3.1 | 0.108 | 6.03 | 1.7 | ||
| 55.4 | 9.0 | 1.0 | 3.1 | 2.1 | ||||
The absorption of ultrasound waves in crystals can be driven by various mechanisms [15]. However, the estimations testify that, under the actual experimental conditions (the temperature interval K and the ultrasound frequency range 1–100 MHz), the ultrasound damping arising owing to phonon-phonon processes and thermo-elastic losses can be neglected, because the absorption coefficient in those cases does not exceed 1 and 10-4 dB/m, respectively [15]. On the other hand, as was already mentioned above, the literature data indicate that the ultrasound wave damping in subgrain -CdxHg1-xTe crystals with is mainly governed by the dislocation absorption and the resonance absorption at LABs [10, 11, 20]. Hence, a conclusion can be drawn that the acousto-dislocation interaction is the main mechanism of ultrasound absorption in subgrain-free -Cd0.2Hg0.8Te specimens with high dislocation concentrations. Proceeding from it, let us analyze the obtained experimental results in the framework of some known models.
4.1 Granato–Lucke model
Despite that the model of dislocation friction by Granato and Lucke was developed in the idealizing zero-temperature approximation for a crystal, it can be successfully applied to analyze the dislocation internal friction in various real materials, in particular, in semiconductor crystals [3, 13, 14]. In the framework of this approach, a dislocation is considered as a string pinned at definite points; free string sections between pinning points can vibrate under the action of an external force, in particular, ultrasound. In this case, the coefficient of acoustic wave absorption at low frequencies, , where is the characteristic frequency of vibrations for the dislocation section, has to be described by the following relation [12, 15]:
| (1) |
where is the shear modulus, the velocity of ultrasound wave propagation, the material density, , the length of dislocation section; Poisson’s ratio, the damping constant, the coefficient of dynamic viscosity, and the absolute value of Burgers vector. Let us try to estimate the individual values of parameters from the obtained experimental data.
It is known from the literature that the variations of the elastic moduli for CdxHg1-xTe crystals do not exceed in the experimental temperature interval [17]. If we suppose that and also weakly depend on the temperature, then, in accordance with Eq. (1), the temperature dependence of the ultrasound wave absorption coefficient must be associated with variations of the parameter , i.e., actually, with the coefficient of dynamic viscosity. The results of calculations showed that the parameter must reach its maximum value at , and the following relations are valid at this point:
| (2) |
| (3) |
| (4) |
| (5) |
where is the value of coefficient when the absorption is maximum.
The individual values of parameters, which were obtained with the help of expressions (3)–(5) and with the use of experimentally determined values for , are given in Table. In the calculations, the following parameter values were selected for Cd0.2Hg0.8Te: m [22], kgm3, , Pa, m/s [21], and m-2.
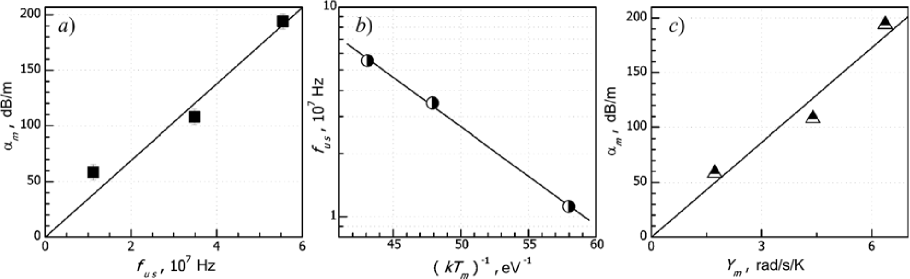
Note that, as a result of the use of the Granato–Lucke model to explain the appearance of a maximum in the dependence , we obtained that, in accordance with Eqs. (2)–(5), the value of has to be proportional to the ultrasound frequency, because the resonance vibration frequency on the dislocation section and its length have to be independent of the external perturbation frequency. In general, the experimentally obtained data agree with this claim (Fig. 4, a). Moreover, if the dislocation grid nodes are supposed to be the main points of the linear-defect pinning, the corresponding calculated value m also satisfactorily correlates with the average distance between dislocation lines, m.
On the other hand, this model predicts that hindering the dislocation motion, including the vibrational one, in the ultrasound field occurs owing to the interaction of dislocations with phonons and charge carriers, and because of thermoelastic losses [12, 23, 15]. The temperature dependence of each of those mechanisms, as well as their relative contributions to the - and -values, can substantially depend on the specific material. Therefore, it is rather difficult to describe the dependence precisely in the framework of the Granato–Lucke model. However, it should be taken into account that, as was shown in many works (in particular, in [13, 15]), the value of linearly increases in the high-temperature interval (, where is the Debye temperature) with the temperature. For CdxHg1-xTe, the Debye temperature K [24]. However, the -values obtained at various contradict the growing behavior expected for the temperature dependence. Therefore, the Granato–Lucke model cannot be used to quantitatively analyze the temperature dependence of the ultrasound absorption coefficient for the given material.
4.2 Brailsford model
This model was proposed by Brailsford [18] in order to explain the characteristic peaks of the ultrasound-wave absorption that were observed in plastically deformed metals at low temperatures. According to this model, a dislocation is regarded as a sequence of segments oriented in the dense packing direction and connected by abrupt kinks. The dislocation is considered to be rigidly pinned at the end points, and ultrasound is absorbed due to the stimulated motion of kinks. It is supposed that the diffusion of kinks has a thermally activated character, and the diffusion coefficient is described by the expression , where is the diffusion activation energy. In work [18], it was also shown that the relation between the ultrasound wave frequency and the absorption maximum temperature can be expressed by the formula
| (6) |
where , and is the average length of dislocation segments. As is seen from Fig. 4, b, the experimental dependence of the ultrasound frequency on the reciprocal temperature of the absorption maximum is really a straight line on the semilogarithmic scale. By calculating a linear approximation of the data depicted in Fig. 4, b, we obtained the following values for the used -Cd0.2Hg0.8Te specimens: eV and Hz.
According to work [18], the Q-factor corresponding to the absorption of ultrasound waves by a single dislocation segment of length is described by the expression
| (7) |
where is the lattice constant ( m [22]); and are the equilibrium linear concentrations of the right and left kinks, respectively; and is the crystal volume. The total number of segments, , is connected with the dislocation concentration as follows:
| (8) |
The theory says that, in order to estimate the general factor of a crystal, it is necessary to multiply by the averaged value of the quantity described by expression (7), and the averaging must be carried out with regard for the distribution of segments over their lengths. If we assume that the averaging is equivalent to the substitution of the parameter in Eq. (7) by a definite effective segment length and make allowance for the relation between and –namely, –then the expression describing the absorption according to the Brailsford model reads
| (9) |
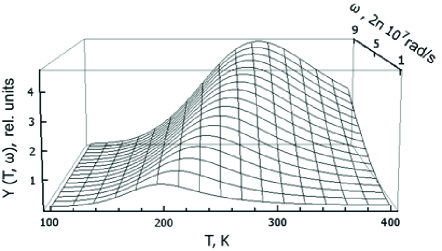
where the function
| (10) |
mainly governs the temperature and frequency dependences of the absorption coefficient. The function is plotted in Fig. 5. One can see that its maximum shifts toward higher temperatures, as the frequency increases. Just this behavior was observed experimentally for the parameter (see Table). The agreement between the experimental -values and the maximum positions of the function at the ultrasound frequencies that were used in the experiments is reached at
Notice that, in accordance with Eq. (9), we obtain
| (11) |
where , i.e. the quantities and must be proportional to each other, which was really obeyed in the experiment with a rather high accuracy (see Fig. 4, c). At the same time, expression (9) can be rewritten in the form
| (12) |
In Fig. 3, the results of calculations according to relation (12) are shown. One can see that they describe the experimental dependences rather well qualitatively and, at high frequencies, even quantitatively. Hence, the results obtained testify to the expediency of the Brailsford model application to the description of ultrasound absorption processes in subgrain-free CdxHg1-xTe crystals.
The Brailsford model makes it possible to use the experimental data obtained for the absorption of ultrasound waves to use for the estimation of the dislocation concentration as well. Really, as was shown in work [18], and , where is the Debye frequency ( Hz for Cd0.2Hg0.8Te [24]), is the interplane distance, and the angle between the dense packing direction and the dislocation line (). If we take the values and (this is the value for the direction [25]), we obtain from Eq. (11) that
| (13) |
The values of calculated by formula (13) for three ultrasound frequencies are listed in Table. We would like to emphasize a satisfactory agreement between these values and the -value obtained in the framework of the selective etching method. The corresponding difference can be explained as follows: first, the relation is approximate, and, second, the estimation of a dislocation concentration using the selective etching method gives, as a rule, a somewhat underestimated value [26]. Moreover, we should mark a definite shortcoming of such an analysis. It is associated with the application of rather a symbolic value () for the total kink number, although this parameter considerably depends on the orientation of the dislocation line with respect to the Peierls valley.
Note that the model describing the motion of elements in the fine dislocation structure was successfully developed by Loktev and Khalack [27] to explain the amplitude-dependent effects under the action of an intensive ultrasound wave, in particular the sonoluminescence effect in CdS.
5 Conclusions
In this work, the temperature dependences of the coefficient of longitudinal bulk acoustic wave absorption, , in bulk -Cd0.2Hg0.8Te specimens free of low-angle boundaries were experimentally studied for the first time within the temperature interval 150–300 and the frequency range 10–55 MHz. The measured dependences turned out nonmonotonous. As the ultrasound frequency increases, both the absorption maximum and the corresponding tempera- ture grow.
The data obtained were analyzed in the framework of the classical Granato–Lucke model, which allowed us to estimate the length of dislocation sections ( m) and the characteristic frequency of their vibrations ( rad/s). It was shown that the temperature dependence of for subgrain-free -Cd0.2Hg0.8Te crystals can be explained using the Brailsford model, which associates the absorption of ultrasound waves with the motion of thermally activated dislocation kinks. In the framework of this model, the activation energy of the kink diffusion, eV, and the frequency parameter, Hz, were determined. The Brailsford model was also used to estimate the dislocation concentration by analyzing the dependence . The corresponding estimated value ( m2) is shown to agree well with that obtained in the framework of the selective etching method ( m2).
The authors express their gratitude to K.P. Kurbanov for the fabrication of bulk single-grain Cd0.2Hg0.8Te specimens.
References
- [1] V.P. Ponomarenko, Usp. Fiz. Nauk 173, 649 (2003).
- [2] S.G. Gasan-Zade, M.V. Strikha, and G.A. Shepelskyi, Ukr. Fiz. Zh. Rev. 5, 3 (2009).
- [3] I.V. Ostrovskyi and O.O. Korotchenkov, Acoustooptics (Vyshcha Shkola, Kyiv, 2003) (in Ukrainian).
- [4] Ja. Olikh and O. Olikh, Sensor Electron. Microsyst. Technol. 1, 19 (2004).
- [5] A.M. Gorb, O.A. Korotchenkov, O.Ya. Olikh, and A.O. Podolian, IEEE Trans. Nucl. Sci. 57, 1632 (2010).
- [6] Ya.M. Olikh and Yu.N. Shavlyuk, Phys. Solid State 38, 1835 (1996).
- [7] A.N. Annaniyazov, A.E. Belyaev, V.V. Dyakin, A.P. Zdebskyi, and V.V. Koval, Ukr. Fiz. Zh. 32, 912 (1987).
- [8] Ya.M. Olikh, E.A. Salkov, and K.R. Kurbanov, Fiz. Tekh. Poluprovodn. 19, 762 (1985).
- [9] A.N. Annaniyazov, A.E. Belyaev, G. Garyagdiev, A.P. Zdebskyi, and E.A. Salkov, Ukr. Fiz. Zh. 33, 1694 (1988).
- [10] V.A. Kalitenko, Ya.M. Olikh, and V.M. Perga, Ukr. Fiz. Zh. 43, 788 (1998).
- [11] Ya.M. Olikh, K.S. Dubrova, and K.S. Sukhanov, Deposited Manuscr., No. 4726-B89 (VINITI, Moscow, 1989).
- [12] A. Granato and K. Lucke, J. Appl. Phys. 27, 583 (1956).
- [13] S.P. Nikanorov and B.K. Kardashov, Elasticity and Dislocation Inelasticity of Crystals (Nauka, Moscow, 1985) (in Russian).
- [14] A.A. Blistanov, V.V. Geraskin, and E.S. Soboleva, in Mechanisms of Internal Friction in Semiconducting and Metallic Materials (Nauka, Moscow, 1972), p. 40 (in Russian).
- [15] R. Truell, C. Elbaum, and B. Chik, Ultrasonic Methods in Solid State Physics (Academic Press, New York, 1969).
- [16] A.N. Vasil’ev, Fiz. Tekh. Poluprovodn. 21, 944 (1987).
- [17] V.F. Machulin, Ya.M. Olikh, and I.O. Lysyuk, Ukr. Fiz. Zh. 45, 1341 (2000).
- [18] A.D. Brailsford, Phys. Rev. 122, 778 (1961).
- [19] Properties of Narrow Gap Cadmium-Based Compounds, edited by P. Capper (INSPEC, Inst, of Electr. Eng., London, 1994).
- [20] Ya.M. Olikh, Dr. Sci. Thesis (Institute of Semiconductor Physics, Kyiv, 2011) (in Ukrainian).
- [21] V.I. Erofeev and V.P. Romashov, Pis’ma Zh. Tekhn. Fiz. 28, 6 (2002).
- [22] C.G. Morgan-Pond and R. Rashavan, Phys. Rev. B. 31, 6616 (1985).
- [23] T. Suzuki, S. Takeuchi, and H. Yoshinaga, Dislocation Dynamics and Plasticity (Springer, Berlin, 1991).
- [24] Ya.A. Agaev, G. Garyagdiev, Ya.M. Olikh, and K.S. Sukhanov, Izv. Akad. Nauk TSSR Ser. Fiz.-Tekhn. 4, 86 (1989).
- [25] J.P. Hirt and J. Lothe, Theory of Dislocations (McGraw-Hill, New York, 1968).
- [26] V.N. Ovsyuk, G.L. Kuryshev, Yu.G. Sidorov et al., Infrared Photodetector Arrays (Nauka, Novosibirsk, 2001) (in Russian).
-
[27]
V.M. Loktev and J. Khalack, J. Luminesc. 76-77,
560 (1998).
Received 01.04.2013.
Translated from Ukrainian by O.I. Voitenko
I.О. Лисюк, Я.М. Олiх, О.Я. Олiх, Г.В. Бекетов
ОСОБЛИВОСТI
ДИСЛОКАЦIЙНОГО
ПОГЛИНАННЯ УЛЬТРАЗВУКУ В БЕЗСУББЛОЧНИХ
КРИСТАЛАХ
Cd0,2Hg0,8Te
Р е з ю м е
Вперше наведено результати
експериментального дослiдження температурної (150–300 K) залежностi
поглинання ультразвукових (УЗ) хвиль у об’ємних кристалах
-Cd0,2Hg0,8Te, якi не мiстять малокутових границь,
у частотному дiапазонi 10–55 МГц. Виявлено, що при збiльшеннi
частоти УЗ спостерiгається збiльшення максимального значення
коефiцiєнта поглинання та його зсув у бiк високих температур.
Показано, що експериментальнi результати задовiльно пояснюються в
рамках моделi Брейсфолда, яка розглядає поглинання УЗ хвилi за
рахунок коливання термоактивованих дислокацiйних перегинiв.
Визначено характернi параметри даної моделi для
-Cd0,2Hg0,8Te, а саме частотний фактор
Гц) та активацiйна енергiя руху перегинiв
еВ), а також проведено оцiнку густини дислокацiй
м, яка узгоджується з даними, отриманими
методом селективного травлення м.