Ab Initio Simulation of Electrical Currents Induced by Ultrafast Laser Excitation of Dielectric Materials
Abstract
We theoretically investigate the generation of ultrafast currents in insulators induced by strong few-cycle laser pulses. Ab initio simulations based on time-dependent density functional theory give insight into the atomic-scale properties of the induced current signifying a femtosecond-scale insulator-metal transition. We observe the transition from nonlinear polarization currents during the laser pulse at low intensities to tunnelinglike excitation into the conduction band at higher laser intensities. At high intensities, the current persists after the conclusion of the laser pulse considered to be the precursor of the dielectric breakdown on the femtosecond scale. We show that the transferred charge sensitively depends on the orientation of the polarization axis relative to the crystal axis suggesting that the induced charge separation reflects the anisotropic electronic structure. We find good agreement with very recent experimental data on the intensity and carrier-envelope phase dependence [A. Schiffrin et al., Nature (London) 493, 70 (2013)].
pacs:
71.15.Mb, 42.50.Hz, 78.47.J-, 72.20.HtThe availability of femtosecond laser sources providing wave-form controlled high-intensity pulses has opened up novel opportunities to explore the ultrafast and nonlinear response of matter. While experiments with rare-gas targets have provided considerable insight into the real-time motion of electrons within atoms and the nonlinear optical response in terms of high-harmonic generation Krausz and Ivanov (2009), the exploration of laser-induced subfemtosecond processes in the realm of solid-state and surface physics is only at the very beginning Cavalieri et al. (2007); Gertsvolf et al. (2008); *Gertsvolf2010Demonstration; Ghimire et al. (2011). Delicate light-field control of electron currents emitted from surfaces, nanostructures, and nanoparticles has been demonstrated Lemell et al. (2003); Dombi et al. (2004); Krüger et al. (2011); Wachter et al. (2012); Zherebtsov et al. (2011), while experiments with bulk matter have succeeded to monitor the electronic dynamics indirectly through optical signals Mitrofanov et al. (2011).
Very recently, Schiffrin et al. Schiffrin et al. (2013) have shown that strong few-cycle laser pulses induce currents and charge separation in large band-gap dielectrics. In contrast to the electrical current and subsequent electron-avalanche breakdown induced by static fields or picosecond laser pulses Sparks et al. (1981), the charge transfer observed in Ref. Schiffrin et al. (2013) results from optical-field-induced transient and reversible currents below the destruction threshold. These results suggest that the intense laser field strongly distorts the electronic band structure thereby converting an insulator transiently into a metal on the (sub) femtosecond scale. This picture is supported by first modeling efforts based on independent-particle models Schiffrin et al. (2013); Földi et al. (2013); Korbman et al. (2013); Hawkins and Ivanov (2013) including macroscopic screening effects Kruchinin et al. (2013); Apalkov and Stockman (2012); Schiffrin et al. (2013). Since previous approaches are based on mostly one-dimensional phenomenological models, the interrelation between the ultrafast dynamics and the microscopic lattice and electronic structure of the dielectric remains to be understood. Open questions include the following: Does the current correspond to a nonlinear Maxwellian polarization current leading to a finite polarization after the end of the driving laser pulse? Is the current due to electrons nonadiabatically transferred into the conduction band where transport might continue after the conclusion of the driving laser pulse? Does the relative orientation of the laser polarization and crystallographic axes influence the ultrafast response?
In this Letter, we investigate the origin of optical field-induced currents in bulk insulators on the atomic scale. We present the first fully three-dimensional ab initio simulations based on time-dependent density functional theory (TDDFT). Our simulations give access to the dynamics of microscopic quantities including the spatially and time-resolved electron density and electrical current density within the unit cell of the material. The simulations thereby provide unprecedented insight into the spatiotemporal structure of the charge dynamics on the atomic length and time scale.
We employ a real-space, real-time formulation of TDDFT Yabana and Bertsch (1996); Bertsch et al. (2000); Onida and Rubio (2002); Marques and Gross (2004); Otobe et al. (2009) to simulate the electronic dynamics induced by strong few-cycle laser pulses in -SiO2 (-quartz). Details of the simulation for -SiO2 have been reported in Ref. Otobe et al. (2009). Briefly, we solve the time-dependent Kohn-Sham equations (atomic units used unless stated otherwise)
| (1) |
where the index runs over the occupied Kohn-Sham orbitals with the Hamiltonian
| (2) |
describing the system under the influence of a homogenous time-dependent electric field of amplitude with a vector potential in the velocity gauge and in the transverse geometry Yabana et al. (2012). While in the so-called longitudinal geometry Yabana et al. (2012), charging up of dielectric interfaces at finite distances is included, the transverse geometry allows us to treat the bulk polarization response of the infinitely extended system along the polarization direction. The latter appears to be a reasonable approximation mimicking the presence of metallic contacts not explicitly treated in the simulation. The periodic lattice potential is given by norm-conserving pseudopotentials of the Troullier-Martins form Troullier and Martins (1991) representing the ionic cores (O(1s2) and Si(1s22s22p6)). The valence electron density is given as . For the exchange and correlation (XC) potential , we employ the adiabatic Tran-Blaha modified Becke-Johnson meta-GGA functional Tran and Blaha (2009); *Koller2011Merits; *Koller2012improving; Nazarov and Vignale (2011). It accurately reproduces the band gap in ground-state calculations yielding eV for SiO2 and yields good agreement with the experimental dielectric function over the entire spectral range of interest including at optical frequencies Philipp (1966). Since the coupling to the time-dependent external field enters in terms of the vector potential, the Hamiltonian (Eq. 2) can be alternatively viewed as the starting point of time-dependent current density functional theory Vignale and Kohn (1996); Vignale et al. (1997) in the adiabatic approximation, in which the nonadiabatic exchange-correlation contribution to the vector potential is neglected. This term plays a key role in describing relaxation and dissipation in an interacting many-electron system D’Agosta and Vignale (2006); Di Ventra and D’Agosta (2007). Explicit expressions for have, so far, become available only in the linear-response limit Vignale and Kohn (1996). In view of the numerical complexity of the present simulation, we neglect this term. Relaxation phenomena occurring on longer time scales are, therefore, omitted from the outset.
We solve the time-dependent Kohn-Sham equations (Eq. 1) on a Cartesian grid with discretization a.u. in the laser polarization direction and a.u. perpendicular to the polarization direction in a cuboid cell of dimensions 9.2816.0510.21 a.u.3 employing a nine-point stencil for the kinetic energy operator and a Bloch-momentum grid of points. The time evolution is performed with a fourth-order Taylor approximation to the Hamiltonian with a time step of 0.02 a.u. including a predictor-corrector step employing a pulse with a cosine-squared envelope,
| (3) |
where is the carrier-envelope phase (CEP) of the few-cycle infrared pulse of carrier frequency .
We analyze the time- and space-dependent microscopic current density
| (4) |
The macroscopic current density along the laser polarization direction is given by the average of over the unit cell with volume
| (5) |
and the corresponding polarization density is . gives the charge transferred per unit area at time . Accordingly, the macroscopic charge transferred by the laser pulse follows from after the conclusion of the pulse as
| (6) |
where is the effective surface perpendicular to the laser polarization direction of the target illuminated by the laser.
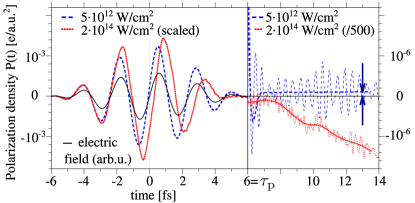
For a moderate laser intensity of W/cm2 where the onset of the nonlinear response is expected, the time-dependent polarization density (Fig. 1) follows approximately adiabatically the applied electric force as expected within linear response. We note that because of the anisotropy of the crystal potential, the induced polarization vector can have a small component transverse to the axis of the laser polarization. After the pulse is over, the polarization density shows small-scale and fast oscillations. Their dominant oscillation frequency corresponds to the beating frequency between states in the valence and conduction band (period 0.5 fs). The average over these oscillations yields a small but finite sustained polarization density after the pulse, corresponding to a transferred charge density of about electrons per a.u.2 (Fig. 1). This transferred charge remains, within the time interval covered by our propagation, constant to a good degree of approximation indicating the absence of any sustained current. The situation changes dramatically for an increased laser intensity of W/cm2. During the laser pulse, the polarization density is distorted and phase shifted relative to the laser field. After the pulse has concluded at , the polarization density shows an almost linear decrease pointing to a constant current density flowing after the laser pulse is over. Such a ballistic current will eventually relax due to dissipative processes such as electron-phonon coupling Franco et al. (2007), impurity, and disorder scattering on longer time scales ( fs) neglected in the present simulation. The appearance of quantum beats and a sustained current after the conclusion of the laser pulse qualitatively confirms earlier findings employing one-dimensional models Korbman et al. (2013); Kruchinin et al. (2013). The beating amplitude is drastically reduced mainly because of the three-dimensional rather than the one-dimensional density of states and because of the self-consistent inclusion of screening.
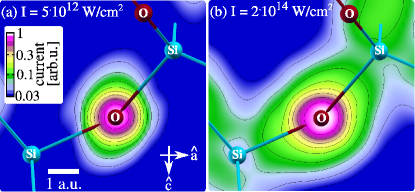
The time-averaged local current density after the laser pulse has concluded, , gives first insight into the excitation mechanism. For low laser intensity (Fig. 2(a)) it is centered around the O atoms with a slight elongation along the laser polarization direction (in Fig. 2(a)) taken along the axis of the crystal) while the current density near the Si atoms and in the interstitial region is negligible resembling localized atomiclike photoexcitation. At the higher laser intensity (Fig. 2(b)) the situation is notably different: The current density distribution extends along the Si-O-Si bond axis and into the interstitial region near the Si atoms indicating laser-induced population of delocalized conduction band levels.
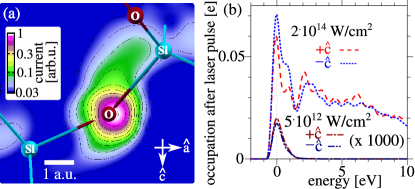
The transition to the regime of a quasifree current can be visualized by snapshots of the time-dependent current density near the extremum of the laser field (Fig. 3(a)). Within the strong field ionization model Keldysh (1965) the excitation process is governed by the magnitude of the Keldysh parameter with the gap between the valence and conduction bands of the dielectric and the peak laser field strength. For , multiphoton transition dominates while marks the regime of tunnel ionization. Accordingly, at an intensity of W/cm2 the Keldysh parameter( ) is in the tunneling excitation regime. For an isotropic static potential landscape, the tunneling current is expected to be oriented along the electric force direction exerted by the laser. In the present case of an anisotropic potential with the O-Si bonding direction at a finite angle relative to , the current displays a slight tilt (Fig. 3(a)), consistent with the charge transfer to the Si atom and into the interstitial region. This directionality of the tunneling process in real space leaves its marks also in momentum space. For low laser intensities, coupling to the conduction band is weak and almost fully reversible. Moreover, points oriented parallel and antiparallel to the laser amplitude are nearly equally populated after the laser pulse (Fig. 3(b)) resulting in a vanishing free current. Transitions to the conduction band set in when the laser intensity surpasses the threshold for tunneling excitation. The latter can be estimated from the field strength where the electrostatic potential difference between the O and the Si site (distance 3.04 a.u.) reaches the order of magnitude of the excitation gap, . The resulting population of the conduction band states after the conclusion of the laser pulse is orders of magnitude larger, and shows energy-dependent forward-backward asymmetries (Fig. 3(b)).
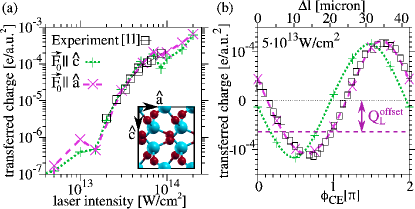
The present simulations can be compared with the first experimental data Schiffrin et al. (2013). A comparison on an absolute scale for (Eq. 6) would require the knowledge of the effective surface area of the crystal illuminated by the laser with near-peak field strength and that effectively contributes to the charge transfer to nearby electrodes which is difficult to determine experimentally. We choose to match the experimental value of A fs at an intensity of W/cm2 when integrating the current over fs before current damping would set in. Keeping the resulting scale factor m2 fixed we find excellent agreement over more than two orders of magnitude for (Fig. 4(a)) without any adjustable parameters. The steep rise clearly indicates the transition from a reversible non-linear bound polarization current to the excitation of a quasi-free current. We checked that this result (fig. 4a) does not sensitively depend on the choice of the XC functional by also performing simulations employing the adiabatic local density approximation Perdew and Zunger (1981). We attribute the weak dependence on the accurate value of the band gap to the strongly nonlinear response beyond the lowest nonvanishing order of a multiphoton transition.
The experiment Schiffrin et al. (2013) has, furthermore, demonstrated that for a wave-form controlled few-cycle pulse, exquisite light-field control translates into control over the charge transfer. In particular, varies sinusoidally with the CEP of the few-cycle pulse (Fig. 4(b)) clearly showing that the field amplitude, rather than the intensity is the parameter governing the charge transfer. We find excellent agreement with the experimental dependence for a laser intensity of W/cm2 ( V/Å, Fig. 4(b)). Our simulations predict a pronounced change of the CEP dependence with increasing intensity. Observation of the effect will require single crystals with well-defined orientation of the crystallographic axis relative to the laser polarization rather than fused silica targets Schiffrin et al. (2013).
We investigate the influence of the anisotropic electronic structure on the transferred charge by comparing simulations with laser polarization along the and axes of the crystal. We find that the dependence of on both the laser intensity and the CEP varies with orientation of laser polarization relative to the crystallographic axis in the high-field regime ( W/cm2, Fig. 4). Most notably, we observe a pronounced shift by in , (Fig. 4(b)). While the experiment Schiffrin et al. (2013) was designed to be sensitive only to the -dependent part of the current and transferred charge, we find an additional unexpected independent contribution to when the laser polarization is aligned along the axis (Fig. 4(b)). We trace its origin to the broken inversion symmetry along the axis () of the SiO2 crystal (see inset Fig. 4(a)) leading to an average net charge transfer. Consequently, our simulation predicts that charge transfer in dielectrics induced by ultrafast pulses is possible even without the need for a CEP stabilized laser.
The present simulation provides a simple and transparent picture of the current and charge transfer dynamics. At low laser intensity, well within the linear-response regime ( W/cm2), neither a net current nor a charge displacement is induced. With increasing laser intensity, nonlinear effects become important. Starting from about W/cm2, our simulations show that a finite amount of charge is transferred by nonlinear polarization currents during the laser pulse but no significant quasifree current flows after the pulse; i.e. these polarization currents are almost completely reversible. Associating these currents with a field-induced AC conductivity at carrier frequency ,
| (7) |
the nonlinear process of the charge displacement can be viewed as a reversible (sub) femtosecond-scale insulator to “metal” transition where increases by more than 20 orders of magnitude. The character of the field-induced currents changes significantly once the laser intensity is sufficiently high such that a substantial amount of electrons are nonadiabatically excited into the conduction band by tunneling excitation. The onset of a ballistic current in the material after the laser pulse is over is accompanied by a delocalized current density over the unit cell. This marks the precursor of dielectric breakdown for longer pulses. A finite conductivity, i.e. a transition from a femtosecond ballistic current to a dissipative current will be established only on longer time scales (20 fs as estimated from mobility data Williams (1965); Goodman (1967); Hughes (1973)) by dissipative processes such as electron-phonon and defect scattering. In our simulation, the transition from nonlinear polarization to the regime where quasifree ballistic electron currents dominate occurs at a laser intensity of about W/cm2. We find the amount of charge transferred is influenced by the intensity, pulse shape, and polarization direction of the laser pulse, indicating that the charge separation depends sensitively on the details of the potential landscape and bond structure.
The present results suggest opportunities for future investigations of the nonequilibrium electron dynamics on the femtosecond scale, in particular the transition regime from ballistic to dissipative electron transport in a pump-probe setting. This would require the inclusion of dissipation and quantum transport beyond the ballistic limit, e.g. through nonadiabatic exchange-correlation functionals within an open-quantum system approach Wijewardane and Ullrich (2005); D’Agosta and Vignale (2006).
Helpful discussions with V. Yakovlev, M. Ivanov, and M. Stockman are gratefully acknowledged. This work was supported by the FWF (Austria), SFB-041 ViCoM, SFB-049 Next Lite, and P21141-N16. G.W. thanks the IMPRS-APS for financial support. X.-M.T. was supported by a Grant-in-Aid for Scientific Research (Grant No. C24540421) from the JSPS. K.Y. acknowledges support by the Grants-in-Aid for Scientific Research Grants No. 23340113 and No. 25104702. Calculations were performed using the Vienna Scientific Cluster (VSC), the supercomputer at the Institute of Solid State Physics, University of Tokyo, and the T2K-Tsukuba at the Center for Computational Sciences, University of Tsukuba.
References
References
- Krausz and Ivanov (2009) F. Krausz and M. Ivanov, Reviews of Modern Physics 81, 163 (2009).
- Cavalieri et al. (2007) A. L. Cavalieri et al., Nature 449, 1029 (2007).
- Gertsvolf et al. (2008) M. Gertsvolf, H. Jean-Ruel, P. Rajeev, D. Klug, D. Rayner, and P. Corkum, Physical Review Letters 101 (2008).
- Gertsvolf et al. (2010) M. Gertsvolf, M. Spanner, D. M. Rayner, and P. B. Corkum, Journal of Physics B: Atomic, Molecular and Optical Physics 43, 131002 (2010).
- Ghimire et al. (2011) S. Ghimire, A. D. DiChiara, E. Sistrunk, P. Agostini, L. F. DiMauro, and D. A. Reis, Nat Phys 7, 138 (2011).
- Lemell et al. (2003) C. Lemell, X. M. Tong, F. Krausz, and J. Burgdörfer, Physical Review Letters 90, 076403 (2003).
- Dombi et al. (2004) P. Dombi, A. Apolonski, C. Lemell, G. G. Paulus, M. Kakehata, R. Holzwarth, T. Udem, K. Torizuka, J. Burgdörfer, T. W. Hänsch, and F. Krausz, New Journal of Physics 6, 39 (2004).
- Krüger et al. (2011) M. Krüger, M. Schenk, and P. Hommelhoff, Nature 475, 78 (2011).
- Wachter et al. (2012) G. Wachter, C. Lemell, J. Burgdörfer, M. Schenk, M. Krüger, and P. Hommelhoff, Physical Review B 86, 035402 (2012).
- Zherebtsov et al. (2011) S. Zherebtsov et al., Nat Phys 7, 656 (2011).
- Mitrofanov et al. (2011) A. V. Mitrofanov, A. J. Verhoef, E. E. Serebryannikov, J. Lumeau, L. Glebov, A. M. Zheltikov, and A. Baltuška, Physical Review Letters 106, 147401 (2011).
- Schiffrin et al. (2013) A. Schiffrin et al., Nature 493, 70 (2013).
- Sparks et al. (1981) M. Sparks, D. L. Mills, R. Warren, T. Holstein, A. A. Maradudin, L. J. Sham, E. Loh, and D. F. King, Physical Review B 24, 3519 (1981).
- Földi et al. (2013) P. Földi, M. G. Benedict, and V. S. Yakovlev, New Journal of Physics 15, 063019 (2013).
- Korbman et al. (2013) M. Korbman, S. Y. Kruchinin, and V. S. Yakovlev, New Journal of Physics 15, 013006 (2013).
- Hawkins and Ivanov (2013) P. G. Hawkins and M. Y. Ivanov, Physical Review A 87 (2013).
- Kruchinin et al. (2013) S. Y. Kruchinin, M. Korbman, and V. S. Yakovlev, Physical Review B 87, 115201 (2013).
- Apalkov and Stockman (2012) V. Apalkov and M. I. Stockman, Physical Review B 86, 165118 (2012).
- Yabana and Bertsch (1996) K. Yabana and G. F. Bertsch, Physical Review B 54, 4484 (1996).
- Bertsch et al. (2000) G. F. Bertsch, J. I. Iwata, A. Rubio, and K. Yabana, Physical Review B 62, 7998 (2000).
- Onida and Rubio (2002) G. Onida and A. Rubio, Reviews of Modern Physics 74, 601 (2002).
- Marques and Gross (2004) M. A. L. Marques and E. K. U. Gross, Annual Review of Physical Chemistry 55, 427 (2004).
- Otobe et al. (2009) T. Otobe, K. Yabana, and J. I. Iwata, Journal of Physics: Condensed Matter 21, 064224+ (2009).
- Yabana et al. (2012) K. Yabana, T. Sugiyama, Y. Shinohara, T. Otobe, and G. F. Bertsch, Physical Review B 85, 045134 (2012).
- Troullier and Martins (1991) N. Troullier and J. L. Martins, Physical Review B 43, 1993 (1991).
- Tran and Blaha (2009) F. Tran and P. Blaha, Physical Review Letters 102, 226401 (2009).
- Koller et al. (2011) D. Koller, F. Tran, and P. Blaha, Physical Review B 83, 195134 (2011).
- Koller et al. (2012) D. Koller, F. Tran, and P. Blaha, Physical Review B 85, 155109 (2012).
- Nazarov and Vignale (2011) V. U. Nazarov and G. Vignale, Physical Review Letters 107, 216402 (2011).
- Philipp (1966) H. R. Philipp, Solid State Communications 4, 73 (1966).
- Vignale and Kohn (1996) G. Vignale and W. Kohn, Phys. Rev. Lett. 77, 2037 (1996).
- Vignale et al. (1997) G. Vignale, C. A. Ullrich, and S. Conti, Phys. Rev. Lett. 79, 4878 (1997).
- D’Agosta and Vignale (2006) R. D’Agosta and G. Vignale, Phys. Rev. Lett. 96, 016405 (2006).
- Di Ventra and D’Agosta (2007) M. Di Ventra and R. D’Agosta, Phys. Rev. Lett. 98, 226403 (2007).
- Franco et al. (2007) I. Franco, M. Shapiro, and P. Brumer, Phys. Rev. Lett. 99, 126802 (2007).
- Keldysh (1965) L. V. Keldysh, Soviet Physics JETP 20, 1307 (1965).
- Perdew and Zunger (1981) J. P. Perdew and A. Zunger, Physical Review B 23, 5048 (1981).
- Williams (1965) R. Williams, Physical Review 140, A569 (1965).
- Goodman (1967) A. Goodman, Physical Review 164, 1145 (1967).
- Hughes (1973) R. Hughes, Physical Review Letters 30, 1333 (1973).
- Wijewardane and Ullrich (2005) H. O. Wijewardane and C. A. Ullrich, Physical Review Letters 95, 086401 (2005).