Local Segmental Dynamics and Stresses in Polystyrene - \ceC60 Mixtures
Abstract
![[Uncaptioned image]](/html/1401.4314/assets/toc_graphic.png)
The polymer dynamics of homogeneous \ceC60-polystyrene mixtures in the molten state are studied via molecular simulations using two interconnected levels of representation for polystyrene nanocomposites: (a) A coarse-grained representation, in which each polystyrene repeat unit is mapped into a single “superatom” and each fullerene is viewed as a spherical shell. Equilibration of coarse-grained polymer-nanoparticle systems at all length scales is achieved via connectivity-altering Monte Carlo simulations. (b) An atomistic representation, where both nanoparticles and polymer chains are represented in terms of united-atom forcefields. Initial configurations for atomistic Molecular Dynamics (MD) simulations are obtained by reverse mapping well-equilibrated coarse-grained configurations. By analyzing MD trajectories under constant energy, the segmental dynamics of polystyrene (for neat and filled systems) is characterized in terms of bond orientation time autocorrelation functions. Nanocomposite systems are found to exhibit slightly slower segmental dynamics than the unfilled ones, in good agreement with available experimental data. Moreover, by employing Voronoi tessellation of the simulation box, the mean-squared displacement of backbone carbon atoms is quantified in the vicinity of each fullerene molecule. Fullerenes are found to suppress the average motion of polymeric chains, in agreement with neutron scattering data, while slightly increasing the dynamic and stress heterogeneity of the melt. Atomic-level and local (per Voronoi cell) stress distributions are reported for the pure and the filled systems.
NTUA]School of Chemical Engineering, National Technical University of Athens, 9 Heroon Polytechniou Street, Zografou Campus, GR-15780 Athens, Greece
1 Introduction
Nanomaterials fabricated by dispersing nanoparticles in polymer melts have the potential for performance that far exceeds that of traditional composites. Nanoparticles have been shown to influence mechanical properties, as well as transport properties, such as viscosity. Until recently, the commonly held opinion was that particle addition to liquids, including polymeric liquids, produces an increase in viscosity, as predicted by Einstein a century ago.1, 2 However, it was recently found by Mackay and coworkers 3, 4, 5 that the viscosity of polystyrene melts blended with crosslinked polystyrene particles (and later also with fullerenes and other particles) decreases and scales with the change in free volume (due to introduction of athermal excluded volume regions in the melt) and not with the decrease in entanglement. Later, 5 fullerenes and magnetite particles were found to produce the same non-Einstein viscosity decrease effect.
Despite the macroscopic viscosity reduction, fullerene-polystyrene nanocomposites exhibit slower segmental dynamics, as Kropka et al.6 have reported. The fully miscible \ceC60 - polymer nanocomposites were made via a solution-dissolution / solvent-evaporation method. The molecular weight of the polystyrene chains was with a narrow molecular weight distribution, . The focus of their study was on nanocomposites containing a weight fraction because the most significant changes in occur at this concentration. These materials exhibited an increase in their “bulk” of about 1 K, as measured by differential scanning calorimetry and dynamic mechanical analysis. The mechanical measurements performed on these nanocomposites showed no evidence of excess structural or dynamic heterogeneity relative to the neat polymer and suggested that the effect of the particles may be described in terms of an increased segmental friction coefficient for the polymer. Quasi-elastic neutron scattering (QENS) measurements revealed that the influence of \ceC60 on polymer melt dynamics is limited to the vicinity of the particle surfaces at the nanosecond time scale. The addition of \ceC60s was found to supress the polymer segmental dynamics of two more polymer hosts (PMMA and TMPC). These authors suggested that the suppression of the local relaxation dynamics of the composite is consistent with an enhancement of cohesive interactions in the system, which may be the root of the increase in for the nanocomposites. The system must acquire more thermal energy before polymer segments can overcome local energy barriers and thereby enable polymer center-of-mass motions. Specifically, local polymer chain backbone motions in the nanocomposites are suppressed relative to those in the neat polymer, an effect which likely plays a role in the observed increases in of the materials. In the melt, the dynamics of the polymer segments in the vicinity of the particle surfaces is suppressed relative to the neat polymer, and this effect results in an excess elastic fraction of polymer segments at the nanosecond time scale.
On the contrary, Sanz et al.7 reported increased segmental motion in polystyrene-fullerenes nanocomposites. These authors prepared bulk nanocomposites of (hydrogenous and ring-deuterated) polystyrene and poly(4-methyl styrene) using a rapid precipitation method where the \ceC60 relative mass fraction ranged from 0% to 4%. Elastic window scan measurements, using a high resolution () neutron backscattering spectrometer, were reported over a wide temperature range (). Based on the measured intensity, apparent Debye-Waller factors , characterizing the mean-squared amplitude of proton displacements, were determined as a function of temperature. Sanz et al. found that the addition of \ceC60 to these polymers leads to a progressive increase in relative to the pure polymer value over the entire temperature range investigated, where the effect is larger for larger nanoparticle concentration. This general trend seems to indicate that the \ceC60 nanoparticles plasticize the fast dynamics of these polymer glasses.
Later, Wong et al.,8 investigated the same system (as Sanz et al.7) by inelastic incoherent neutron scattering, small angle neutron scattering, calorimetric and dielectric spectroscopy methods. They found that the dispersion of fullerenes increased the glass transition temperature, slowing down the alpha relaxation dynamics associated with glass formation, while at the same time causing a softening of the material at high frequencies (as determined by the Debye-Waller factor). These effects are interpreted in terms of the particle modifying the polymer packing, causing an increase of the fragility of glass formation. The observed increase in lies in apparent contradiction with the same groups’s previous inelastic neutron scattering findings.7 From the point of view of these authors, this may indicate that the low-temperature slope of increases with the addition of fullerene nanoparticles. The comparatively larger amplitude of proton delocalization in nanocomposites at the same temperatures is interpreted as a softening of the local potential of proton motion. In summary, inelastic neutron scattering indicates a simultaneous increase in amplitude of fast proton motion (increased mobility at fast time scales and Å-lengthscales), while restricted segmental motion associated with the glass transition is manifested by a increase.
From the standpoint of molecular simulations, Vacatello9 performed Monte Carlo (MC) simulations of particles dispersed in a polymer matrix; he found that polymer segments adhere to the particles and some chains are connected to different particles, thereby forming “bridges”. Each chain visits the interface layer of several particles and each particle can be in contact with multiple chains. Even in the absence of strong interactions between particles and polymeric chains, Vacatello observed that the particles behave as multifunctional physical crosslinks. These crosslinks do not immobilize the polymer chains, but can reduce their diffusion rates considerably.
That view was complemented by molecular dynamics (MD) simulations by Desai et al.,10 who found that chain diffusivity is enhanced (relative to that in the pure polymer) when polymer-particle interactions are repulsive, and is reduced when polymer-particle interactions are strongly attractive. These authors were the first to report that chain diffusivity is spatially inhomogeneous, adopting its pure-polymer value when the chain center of mass is about one radius of gyration away from a particle’s surface. Smith et al.11 reported increase of the viscosity of a coarse-grained bead-necklace model polymer upon the addition of attractive and neutral nanoparticles, while viscosity reduction was observed upon the addition of repulsive particles. Further MD simulations of polymer melts by Smith et al.12 have suggested that both increased polymer segment packing densities and the energy topography of a surface can lead to stronger caging of polymer segments near an attractive surface. They suggested that the dramatic increase in structural relaxation time for polymer melts at the attractive structured surface is largely a result of dynamic heterogeneity induced by the surface and does not resemble dynamics of a bulk melt approaching . The results of Kropka et al.6 may indicate that \ceC60s induce similar effects in the glassy state of the polymers investigated.
More recently, Ndoro et al.13 employed atomistic MD simulations in order to study the interfacial dynamics of 20-monomer atactic polystyrene chains surrounding a silica nanoparticle. The effect of the nanoparticle curvature and grafting density on the mean-squared displacement of free polystyrene chains and on the mean relaxation time of various intramolecular vectors was investigated as a function of separation from the surface. Confinement, reduced surface curvature, and densification resulted in a reduction of the mean-squared displacement and an increase in the mean relaxation time of the C-H bond vector and chain end-to-end vector in the vicinity of the surface.
Toepperwein et al.14 have addressed the influence of nanorods on the entanglement network of composites through MC and MD simulations. The presence of particles enriched the nanocomposite systems by nucleating additional topological constraints of polymer-particle origin. Later, Li et al.15 observed that highly entangled polymer chains were disentangled upon increasing the volume fraction of spherical non-attractive nanoparticles. The authors report a critical volume fraction controlling the crossover from polymer chain entanglements to nanoparticle-induced entanglements. While below this critical volume fraction, the polymer chain relaxation accelerates upon filling, above this volume fraction, the situation reverses. The same authors16 have also studied the structural, dynamical and viscous behaviors of polyethylene matrices under the influence of differently shaped nanoparticles, including \ceC60 buckyballs, at fixed volume fraction (4 vol %). The nanoparticles were found to be able to nucleate polymer entanglements around their surfaces and to increase the underlying entanglement density of the matrix in the proximity of the particles. However, the overall primitive path networks of PE matrices were found very similar to those of pure polyethylene, since polymer entanglements still dominated the rheological behavior.
In this work we are trying to understand the microscopic mechanisms involved in the peculiar behavior of PS-\ceC60 nanocomposites, through a hierarchical simulation approach. To this end, we focus our study on polystyrene melts having specifications identical to those studied by Kropka et al.6 The computational prediction of physical properties is particularly challenging for polymeric materials, because of the extremely broad spectra of length and time scales governing structure and molecular motion in these materials. This challenge can only be met through the development of hierarchical analysis and simulation strategies encompassing many interconnected levels, each level addressing phenomena over a specific window of time and length scales.17 In order to shed some light into the segmental dynamics of PS-\ceC60 systems, molecular simulations have been conducted using two interconnected levels of representation for polystyrene nanocomposites: (a) A coarse-grained representation,18 in which each polystyrene repeat unit is mapped into a single “superatom” and each fullerene is viewed as a spherical shell. Equilibration of coarse-grained polymer-nanoparticle systems at all length scales is achieved via connectivity-altering Monte Carlo (MC) simulations.19 (b) An atomistic representation, where both nanoparticles and polymer chains are represented in terms of united-atom forcefields. Initial configurations for atomistic Molecular Dynamics (MD) simulations are obtained by reverse mapping well-equilibrated coarse-grained configurations. The reverse mapping procedure retains the tacticity which is implicit in the coarse-grained representation, while regrowing atomistic sites by a quasi-Metropolis procedure that avoids unphysical conformations. By analyzing MD trajectories under constant energy, the segmental dynamics of polystyrene (for neat and filled systems) can then be characterized in terms of bond orientation time autocorrelation functions and atomic local mean-squared displacement.
2 Coarse Grained Monte Carlo (CG-MC)
2.1 Systems studied
In this work, monodisperse melts of atactic PS chains with 50 % meso diads obeying Bernoullian statistics and with chain lengths of 80 (), 185 (), 323 (), 922 (), 1460 () and 4032 () coarse-grained sites (diads) were generated and simulated. Initial configurations were generated and equilibrated at the temperature of 500 K, at which the CG forcefield has been developed. Then the reverse-mapped well-equilibrated configurations were subjected to MD runs which cooled them down to the glass transition temperature. Bearing in mind the limitations of the atomistic MD simulations, the main part of this work is based on systems composed of chains of molecular weight with 20 fullerenes randomly dispersed, leading to a weight fraction . System specifications are close to experimentally studied systems by quasi-elastic neutron scattering6 and adequate for avoiding finite-size effects.20 For comparison, neat polymeric systems of the same characteristics have also been simulated along with the composite ones. In order to improve statistics, three independent configurations of both the neat and the filled system were generated, equilibrated and reverse-mapped. Moreover, a single 80-mer chain system was atomistically built and simulated with MD, without involving MC equilibration.
The major contribution to the computational cost of our study stems from the MD simulations. Despite the fact that our MC and reverse mapping codes are running serially, the time needed to fully equilibrate our systems and generate the corresponding atomistic configurations is reasonable (10-15 days of wall-clock time on a single 2.8 GHz CPU core). On the contrary, the MD simulations of the systems described above required 40 days of real wall-clock time for 170 ns integration time, when run on a hybrid machine consisting of eight 2.8 GHz CPU cores and one programmable graphics processing unit. Since the polymer relaxation times (e.g., the disentanglement or reptation time, ) far exceed our current computational resources, the use of MC to equilibrate our samples is of vital importance.
2.2 Coarse Grained model
The coarse graining scheme adopted in this work is very efficient for the representation of vinyl polymers, since one is able to keep information on stereochemical sequences along the polymer chain. Given a direction along the main chain, it is possible to assign an absolute configuration to each asymmetric carbon. The chain can be represented as a sequence of diads, each diad containing two asymmetric carbons. Depending on the absolute configuration of the asymmetric carbons, i.e., RR (or SS) and RS (or SR), the diads can be of type m (meso) or r (racemo), respectively (Figures 1 and 2 of ref 18). The chain ends can be either em (end-meso) or er (end-racemo) as far as the bonded potentials are concerned, but their nonbonded interaction is common and slightly different from m and r non-bonded interactions. A detailed description of the model can be found in ref 18 and the parameter values used are taken from the Supporting Information of ref 19. They were derived from a detailed atomistic potential using the Iterative Boltzmann Inversion (IBI) method. The coarse-grained effective potential was refined in order to better reproduce the target distributions, extracted from all-atom simulations of a 9mer fluid at 500 K and 1 bar. All MC simulations of the present work have been conducted at the same temperature.
At the coarse grained level of description, fullerenes are considered as spherical shells of infinitesimal thickness. It is assumed that carbon atoms are uniformly smeared over the surface of the shell. The potential between a spherical shell of interaction sites and a single coarse grained PS site (treated as a point), on the grounds of Hamaker theory,21 is:
| (1) |
where is the center-to-center separation distance. The external radius of the shell representing the fullerene, , is set to . The density of interaction sites of fullerene is , the thickness of the shell , and the product represents the surface density of interaction sites of the fullerene. The mean Lennard-Jones interaction parameters, and , take into account the interaction of fullerene carbons with all kinds of interaction sites a coarse-grained bead consists of. In the case of PS, for every bead we sum up five different kinds of interactions, namely the interaction of \ceCH3, aliphatic \ceCH2, aromatic CH and C groups with the fullerene. Each interaction is weighted with the number of interaction sites of each kind present in the coarse-grained (CG) bead. The detailed united-atom forcefield, which is essential for the calculation of and , is described in the “Target atomistic representation” subsection, which follows. In 1 are listed the nonbonded interaction parameter values of the united-atom forcefield, as well as coarse-grained model parameters derived from them and used in this work.
Following the work of Girifalco, 22 the interaction between fullerenes at the coarse-grained level is modeled as an integrated Lennard-Jones potential over two spherical shells:
| (2) |
where and the values of the remaining parameters are presented in 1. This potential has been used throughout the literature to study the molecular properties of \ceC60, which were found to be consistent with available experimental data, making it a reasonable choice. A priori, there should be an entropic contribution included in the coarse-grained polymer-particle potentials,23 which is not taken into account by using Hamaker-type potentials. However, our coarse-graining is relatively modest, so we believe that this contribution is small. As our PS coarse-graining serves mainly for creating initial configurations, any fault in the local structure caused by the coarse-grained potential, will be fixed by the subsequent atomistic MD simulation.
2.3 Initial CG Structure Generation
To start the coarse-grained Monte Carlo simulation, an initial configuration is generated by placing the fullerenes at randomly selected positions, so that they do not overlap, and then building stepwise the polymeric chains around them, following the work of Theodorou and Suter.25 At each step a site type was chosen according to the overall probability of meso and racemo diads. In our work the tacticity of atactic PS is represented by a Bernoullian diad distribution with a probability of meso diads of (in equilibrium atactic polystyrene the configuration statistics is almost Bernoullian with the fraction of meso dyads around 0.46 26, 27, 28). The “Euler angles” defining the direction of the first and the second coarse-grained bonds, are arbitrarily set at the beginning. Since torsion angle potentials are not used in the CG representation, for each subsequent superatom a bond angle is chosen according to a probability resulting from the effective bending potential for the specific angle type and the segment is placed, accordingly, on a circle forming the base of a cone with apex at the previously placed superatom and side length equal to the average CG bond length of . In every step, non-bonded interactions with already created superatoms are taken into account, refining the probabilities of accepting a trial position for the bead to be grown. If, after a certain number of iterations, all attempts to grow the superatom fail, a local derivative-free minimization of the potential energy is undertaken in order to ensure that the bead is placed at the most energetically favorable position. Since the degrees of freedom of the optimization are only three, i.e. the cartesian coordinates of the new superatom to be built, a numerically stable Nelder-Mead algorithm is a reasonable choice.29
Each initial guess structure is then “relaxed” to a state of minimal potential energy. The total potential energy is the sum of all bonded potentials of the polymeric matrix, non-bonded interactions between polymer superatoms, between polymer superatoms and fullerenes, and between fullerenes and fullerenes. Minimization is carried out using the Large-scale Atomic/Molecular Massively Parallel Simulator (LAMMPS)30 with the coarse-grained potentials incorporated in its source code. Since IBI PS coarse-grained non-bonded potentials are tabulated, a Polak-Ribière 31, 32 variant of the conjugate gradient method is used.
2.4 Monte Carlo equilibration
Enabling the equilibration of high molar mass polymer nanocomposites at the coarse-grained level was one of the main objectives of this work. For this purpose, connectivity altering moves, 33 such as double bridging (DB) 34 were employed in Monte Carlo simulations of linear chains of four types of sites, m, r, em and er. In the DB move two trimers are excised from two chains of equal length and two new trimer bridges are constructed, leading to two new chains of the same length but of drastically different conformations. The internal shape of the chains was rearranged by using the symmetric variant of the concerted rotation move, 35, 36 which modifies the local conformation of an internal chain section (of five superatoms) while leaving the preceding and following parts of the chain unaffected. In addition, the internal conformations of chains are sampled using flips of internal beads, end segment rotations and reptations. The mixture of MC moves included a newly developed and specially adapted configurational bias move,37 capable of regrowing an arbitrary number of coarse-grained beads, starting from a chain end, in a confined environment formed by the nanoparticles. For every kind of move undertaken, special care was taken to discard moves leading to overlaps of coarse-grained beads and dispersed nanoparticles.
2.5 Conformational properties of CG configurations
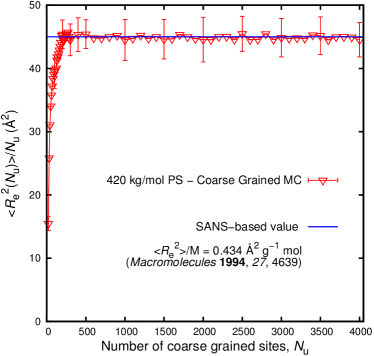
As a measure of the obtained chain conformations one may use the quantity , where is the number of diads (repeat units) in a subchain and is the squared end-to-end distance of the subchain. It has been shown that,38 for well equilibrated chains, increases monotonically with until it reaches a plateau. In 1, is depicted as a function of for a system containing 8 chains of 4000 diads each, at . For an asymptotic value is reached of approximately which corresponds to equal to , with being the chain molar mass. This is in excellent agreement with the Small Angle Neutron Scattering (SANS)-based value (shown with the dotted line) of given for PS at .39
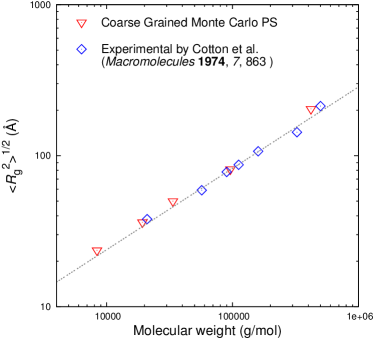
The calculated root-mean-square radius of gyration as a function of is shown in 2. Neutron scattering results 40 for monodisperse PS of ranging from to in the bulk at have also been drawn (continuous thin line) for comparison over the scale of interest. Very good agreement is observed for all the molar masses examined. This confirms that chains in our CG melts are well equilibrated and adopt close to unperturbed configurations. At the CG level of representation, nanoparticles do not seem to affect the dimensions of the chains, yielding identical results with the neat polystyrene systems. However, this cannot be considered as a generally valid statement for polystyrene nanocomposite melts (e.g. polystyrene chains have been found to swell upon the addition of crosslinked polystyrene nanoparticles 41).
3 Reverse Mapping
3.1 Target atomistic representation
The equilibrated coarse-grained configurations are reverse mapped to detailed configurations which can be described by a united-atom model without partial charges, based on the works of Mondello et al. 24 and Lyulin and Michels.42 This united-atom model will also be referred to as “atomistic” in the following. It takes into account the following contributions to the system potential energy: (i) Lennard-Jones non-bonded interaction potential between all united atoms that are three or more bonds apart or belong to different images of the parent chain; (ii) bond stretching potential for every covalent bond; (iii) bending potential for all bond angles, including those in the phenyl rings; (iv) torsional potential for all rotatable backbone bonds; (v) torsional potential for the torsions of phenyl rings around their stems; (vi) out-of-plane bending potential to preserve the coplanarity of the phenyl and the phenyl stem; (vii) torsional potential about all bonds connecting aromatic carbons in the phenyl ring to preserve the planarity of the ring and (viii) improper torsional potential to preserve the chirality of all carbons bearing a phenyl substituent.43 Lennard-Jones parameters employed by the model are listed in 1. All Lennard-Jones potentials are cut at an inner cutoff distance of , beyond which force smoothing to zero using a cubic spline is applied up to a distance of . No tail corrections are used for the non-bonded interaction potential. Our experience has been that this united-atom model does a reasonable job predicting structure, volumetric properties, elastic constants and stress-strain behavior in the melt and glassy state. In particular, the system adopts density values close to those measured experimentally upon quenching into the glassy state.44
Fullerenes are described as fully flexible carbon cages. As far as intramolecular (bond stretching, bending and torsional) contributions are concerned, the DREIDING forcefield has been used 45. Intramolecular non-bonded interactions are not taken into account, while the intermolecular non-bonded interactions are described by a Lennard-Jones potential using the values of and reported in 1, following the early but well validated work of Girifalco.22 A comprehensive review of \ceC60 forcefields can be found in the work of Monticelli 46. In order to ensure the reliability of our atomistic MD simulations, all sets of parameters reported by Monticelli have been tested, rendering indistinguishable results, as far as the trajectories and the thermodynamic properties of the systems were concerned.
3.2 Procedure
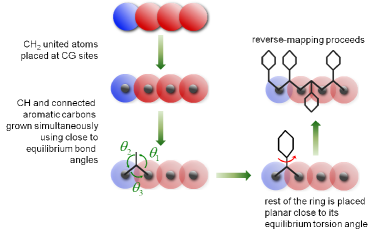
The reconstruction of the atomistic detail, given a well-equilibrated coarse-grained configuration, is accomplished in four stages. During the first stage, atomistic fullerenes are placed at the positions of the coarse-grained beads used during the CG-MC equilibration, while paying attention to select the orientation that minimizes the interaction energy with their environment. The second stage consists of an iterative quasi-Metropolis introduction of the atomistic sites of the polymer, obeying the atomistic potential described above. During the third stage, local MC moves try to optimize the generated configuration. At the final stage, energy minimization is undertaken before initiating the MD integration. Throughout the atomistic reconstruction procedure, \ceCH2 united atoms containing the achiral carbons of the chains are kept fixed at the positions of the superatoms of the coarse-grained configuration.
In order to restore the atomistic detail of the coarse-grained PS, a quasi-Metropolis procedure is followed. 25 During the reconstruction of the atomistic sites, the positions of the united atoms added (aliphatic \ceCH groups containing the chiral carbons of the chains, aromatic C and \ceCH groups constituting the phenyl substituents) are selected from a set of properly created candidates, using as a criterion the increase in the total energy of the system. The first chiral carbon of each chain was assigned randomly an absolute configuration, since this is not determined by the coarse-grained model, and the rest of the chiral carbons were placed according to the chirality of the diads. Starting from the \ceCH2 sites, whose position vectors are the degrees of freedom of the coarse-grained representation, backbone \ceCH united atoms are selected from a set of candidate positions lying in the circle formed by the intersection of two spheres, one centered at the previous \ceCH2 atom and the other centered at the next one. The radii of the spheres correspond to the equilibrium length of the backbone C-C bond. Based on the positions of the aliphatic \ceCH2 and \ceCH united atoms, the carbon defining the stem of the phenyl ring is placed so that the aliphatic \ceCH - aromatic C bond generates close to equilibrium bending angles. Finally, the rings are introduced as planar objects, the plane of each ring containing the axis of its stem, using as the only degree of freedom of the candidate positions the torsion angle of the ring around its stem. During the whole regrowth, insertions of carbon atoms leading to a ḡ (gauche-bar)47 conformation are strictly prohibited by assigning to them zero probability.
Following Spyriouni et al.,19 the configuration is optimized via local Monte Carlo moves. These moves include flip of a segment, rotation of the phenyl ring around its stem and configurationally biased regrowth of a whole monomer, preserving the chirality of the CG site. A flip move displaces an inner skeletal segment of the chain along the locus (circle) defined by the lengths of the two bonds adjacent to the segment. The moves employed flipped a chiral carbon (one carrying a phenyl) to a new position on the circumference of a circle drawn perpendicular to the line connecting the carbons flanking it on either side. In addition, moves which regrow a whole segment in a configurationally biased way have been used.
The potential energy of the atomistic system is minimized with respect to the Cartesian coordinates of all atoms, excluding the \ceCH2 united atoms which coincide with the positions of the coarse-grained sites. In this way, the equilibrated MC configuration is not distorted during the reconstruction of carbon atoms through reverse mapping ( 4). For the minimization, LAMMPS is used with a Hessian-free truncated Newton minimization method.49 Minimization is performed in turns, by gradually blowing up the atomic radii.25 One starts with atoms of reduced size (sigma equal to half its actual value), adjusting that size in stages so that the atoms reach their full size at the end. As in earlier works, a modified potential energy function was used to describe non-bonded interactions in early stages of the minimization, the so-called soft sphere potential. After the introduction of the Lennard-Jones interactions, the collision diameter, , is gradually increased from half to its final value. The reverse mapping scheme just described was designed in order to prevent locking of the local configuration in torsional states which are inconsistent with the unperturbed conformational statistics adopted by PS in the melt, without departing at all from the well-equilibrated configurations provided by the coarse-grained simulations. Validation of the reverse-mapped configuration against experimentally available information from pure polystyrene melts is necessary before proceeding to examine the properties of nanocomposites. It is discussed in the following section.
3.3 Thermodynamic properties and structure of the reverse-mapped configurations
The cohesive energy, , is the energy associated with the intermolecular interactions only and can be estimated by taking the difference between the total energy of the simulation box, , and that of the isolated polymeric chains, . In order to determine the intramolecular energy, chains were considered not to interact with their periodic images. Hildebrand’s solubility parameter, , is the square root of the cohesive energy density, with being the volume of the simulation box. The solubility parameter, , was calculated for the bulk reverse mapped structures of 1460 diads per chain. For this calculation the intermolecular interactions for each system were summed, averaged and divided by the simulation box volume to obtain an estimate of the cohesive energy density. The square root of the cohesive energy density, averaged over all structures, was found to be equal to at . Experimental values for PS from viscosity measurements in different solvents, range from to at .50 The discrepancy of about 18% is rather large and can be partly attributed to the temperature difference (the cohesion of the polymer drops as the temperature rises and so should decrease as well). The short-chain structure (made from the single 80-mer parent chain) equilibrated with MD at gave an even lower solubility parameter.
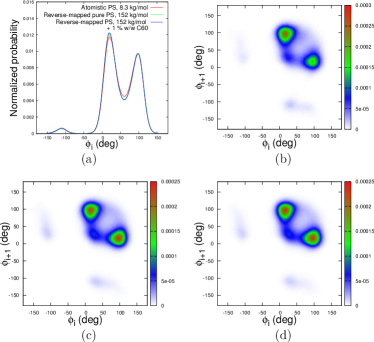
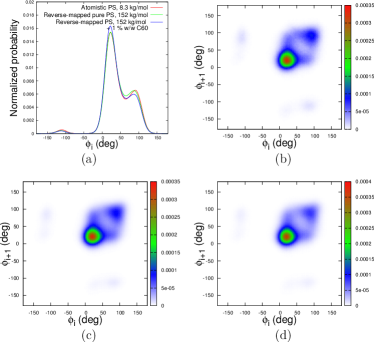
NMR measurements on atactic PS have helped gain insight into the conformations adopted by its chains. Suter and collaborators 51, 52, 53, 54 have shown that considerable deviations may occur between experimental findings and predictions obtained from bulk atomistic model structures of PS; furthermore, they have proposed several algorithms for the generation of atomistic structures by an appropriate choice of the target conformational probabilities in the spirit of the Rotational Isomeric State (RIS) model. Having this in mind, the ability of the proposed reverse mapping scheme to generate atomistic configurations with correct conformational statistics is examined. The resulting torsional distributions are shown in Figures 5 and 6 for meso and racemo diads, respectively.
| State frequency in % | |||
| t: | g: | : | |
| meso diads | 54.2 | 43.4 | 2.4 |
| racemo diads | 66.7 | 31.7 | 1.6 |
| overall | 60.4 | 37.6 | 2.0 |
| State a-priori RIS | |||
| probability (300 K)55 | 71 | 29 | - |
| Double-quantum | |||
| solid-state NMR56 | 68 | 32 | - |
The fusion of trans and gauche states is apparently produced by the atomistic potential at this high temperature, since it is also present in the single-chain system which has been equilibrated by MD. Comparing the curves in Figures 5 and 6 we observe that torsion angle distributions in the reverse-mapped structures are extremely close to those obtained from the 80mer structure that was directly equilibrated by MD at the atomistic level, without intervention of any coarse-graining and reverse mapping. This observation is extremely promising for our reverse mapping scheme, implying that we can achieve well-equilibrated structures down to the atomistic scale. The percentage of trans states is slightly increased in the presence of fullerenes, both for meso and racemo diads. In the case of racemo diads, the effect is accompanied with an equal reduction of the gauche percentage, which may be attributed to a mild extension of the chains trying to engulf the fullerenes. The overall content of trans conformations, as presented in 2 for the bulk systems, in the reverse-mapped structures is around 60%, which is in reasonable agreement with the experimental measured by NMR.56 The total percentage of conformations in the reverse-mapped structures was 1.8%, while, according to RIS models, it should be less than 2%.57, 58, 55 Clearly, capturing the correct torsion angle distribution is a stringent test for reverse mapping from the coarse-grained representation adopted in this work. Previous efforts by Spyriouni et al.,19 and Ghanbari et al. 59 could not capture the correct local structure of polystyrene, leading to a high percentage of unrealistic conformations.
Along with the torsion angle distributions in Figures 5 and 6, Ramachandran plots of the two-dimensional distributions characterizing two successive torsion angles are also shown. Following Flory et al.,47 in the case of a meso diad, is measured in the right-handed sense and in the left-handed sense. In the racemo diad obtained by inverting the chirality of the second methine carbon of the diad, both torsion angles are measured in the right-handed sense (the mirror image diad would require two left-handed frames of reference). Overall, the convention used to define the sense of rotation of the torsional angles is such that the same angles lead to the same molecular environments around the considered bond.60 In 5(b) the plot concerns the single-chain 80-mer system. It can be seen that for this system, tg and gt conformation probabilities are not equal, since the two regions are not evenly populated; this reflects incomplete equilibration by MD, even in this short-chain melt. On the other hand, systems produced by the proposed reverse mapping methodology, result in fully symmetric tg and gt conformations. The presence of fullerenes does not seem to affect the probabilities of successive torsion angles. In all cases, conformations involving ḡ torsion angles are extremely rare.
4 Atomistic Molecular Dynamics
All MD simulations have been conducted using the Large-scale Atomic/Molecular Massively Parallel Simulator (LAMMPS),30 extended with the united-atom force field of Lyulin and Michels,42 which we have incorporated into the LAMMPS source code. The equations of motion are those of Shinoda et al.,61 integrated by the time-reversible measure-preserving Verlet integrator derived by Tuckerman et al.62 In all cases, a timestep of 1 fs was used.
Initially, the reverse-mapped configurations were subjected to 50 ns of isothermal-isobaric () MD under and , using the barostat of LAMMPS. Keeping the temperature fixed, 20 ns of isothermal () integration followed, leading to the final 100 ns time integration under constant energy (), where the coordinates of the atoms were tracked in order to extract the dynamical properties. The final configuration from the melt at was subjected to further simulation with the set temperature lowered by 20 K every 40 ns (effective cooling rate 0.5 K/ns) down to a final temperature of 380 K. At every cooling step (20 K), a configuration of the system was recorded and used for 50 ns of equilibration, followed by 20 ns and 100 ns MD run in order to extract the dynamics at this temperature. All (three neat and three composite) independent reverse-mapped configurations were subjected to the same procedure. During the run, the system’s pressure and temperature were monitored in order to ensure that they correspond to the desired values.
We believe that simulations, where no barostatting or thermostatting take place, are the best means of studying dynamics under no external influence.63 The thermostatting and barostatting is achieved by adding some dynamical variables which are coupled to the particle velocities (thermostatting) and simulation domain dimensions (barostatting), in order to mimic a reservoir coupled to the system. If the coupling is loose, the energy flow from the system to the reservoir is slow. On the other hand, if the coupling is strong, long-lived weakly damped oscillations in the energy occur resulting in poor equilibration. It is necessary to choose the strength of the coupling wisely, so as to achieve satisfactory damping of these correlations.64
4.1 Hydrogen reconstruction
Hydrogen reconstruction aims at re-introducing hydrogens of \ceCH3, \ceCH2 groups and phenyl rings. The procedure we followed is inspired by the work of Ahumada et al.65 Methyl hydrogens are reconstructed at a staggered conformation, i.e. a methyl C-H bond being coplanar with the methyl stem and with the C-H bond of the methine group to which the methyl is connected and pointing in an opposite direction to the latter bond. For all methyls, C-H bonds are assumed to be long and to form an angle of with the methyl stem. As far as the \ceCH2 united atoms are concerned, two hydrogen atoms are placed symmetrically on both sides of the plane where the C-C bond lies, obeying the equilibrium bond length and equilibrium bond angle . In the case of the \ceCH united atom of the backbone, the single hydrogen atom is placed entirely symmetrically to the phenyl ring, using as a plane of symmetry the backbone of the chain. Finally, one hydrogen atom is attached to every aromatic atom in the direction defined by the center of mass of the ring and the carbon atom, at a distance from it. The addition of hydrogens to an end of a polystyrene chain is depicted in Figure S1 of the Supporting Information to the present paper.
4.2 Temperature dependence of segmental dynamics
We examine the segmental dynamics of the atactic PS melt, as predicted by the united-atom MD simulations, by analyzing time autocorrelation functions of various vectors. In the case of polystyrene, the vectors characterizing the orientation of the phenyl ring and the orientation of the C-H bonds are of special interest (Figure S1 of the Supporting Information to the present paper). The orientational decorrelation with time for each one of these vectors can be studied by considering ensemble-averaged Legendre polynomial of order , , of the inner product of the unit vector along the vector, at times and . It is quite common to fit the long-time behavior of orientational autocorrelation functions of this kind by a modified Kohlrausch - Williams - Watts (mKWW) function 66, 67, 68:
| (3) |
The mKWW function of eq 3 consists of two parts. The first term describes a fast exponential decay with amplitude , which is associated with the fast librations of torsion angles around skeletal bonds and with the bond stretching and bond angle bending vibrations of skeletal and pendant bonds near their equilibrium values, with characteristic time . The second term is a stretched exponential decay associated with cooperative conformational transitions in the polymer, with being the characteristic correlation time and the stretching exponent. The correlation time for segmental motion, , also referred to as “segmental relaxation time” in the following, can be calculated as the integral:
| (4) |
If a comparison with dielectric spectroscopy (DS) is sought, the relevant vector to study is the vector starting from the backbone \ceCH united atom and ending at the center of mass of the phenyl ring, . To a good approximation, monomer dipole moments are directed along this vector. DS measurements cannot discern between self and cross correlations of the dipole vectors. However, the contribution of the correlations of neighboring dipole moments to the segmental relaxation is minimal. 69, 70 In this case, the quantity of interest is the Legendre polynomial of the first kind, . In the inset to the 7 the calculated functions are presented with solid lines for both the bulk and the composite systems. Along with the simulation results, fits to the mKKW function (eq 3) are also presented. It can be seen that the mKWW expression describes well the simulation results for both cases and the whole temperature range. Each simulation curve represents the average of the three independent MD trajectories produced by the different reverse-mapped structures. The fitting to the mKWW equation allows us to analytically estimate the segmental relaxation time, , based on eq 4, using the fit parameters of Table S1 of the Supporting Information to the present paper.
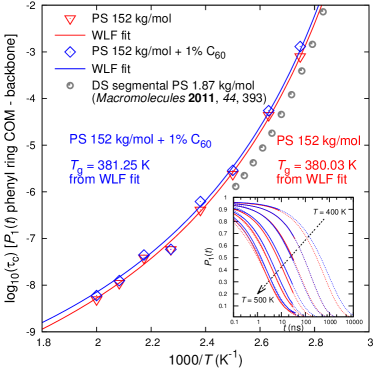
The temperature dependence of the segmental relaxation times is presented in the main part of 7. Segmental relaxation times calculated by our united-atom MD simulations are in favorable agreement with experimental DS measurements found in the work of Harmandaris et al.71 Experimental points from ref 71 are shifted to smaller timescales, due to the smaller molecular weight of the samples used in the DS measurements. This is expected, since PS dynamics exhibits molecular weight dependence which can shift the glass transition temperature from for PS to for PS.73 An estimate of the glass transition temperature, can be obtained by fitting the temperature dependence of segmental relaxation times to an equation such as Williams-Landel-Ferry (WLF).72 Fitted values of are given in 7, with the coefficient of WLF equation, , being and , close to the universal values and the experimental ones of Kumar et al. 74 As can be seen in 7, nanocomposite systems exhibit slightly longer segmental relaxation times, compared to their neat counterparts, for the majority of temperatures studied. This leads to an estimated glass transition shift of around upon the addition of fullerenes. The -shift predicted by the MD simulations is in excellent agreement to the shift found by differential scanning calorimetry (DSC) measurements of Kropka et al.6 However, for some temperatures, the dynamical behavior of unfilled and filled systems yields completely indistinguishable results.
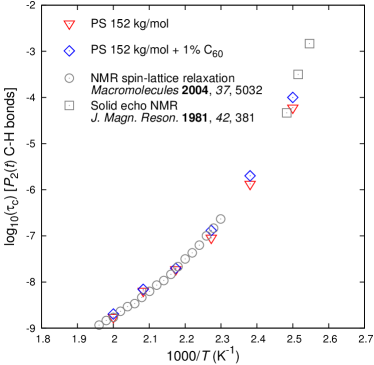
If one is interested in comparing with NMR data, an appropriate autocorrelation function to look at is the orientational autocorrelation function of C-H bonds. The reason is that, for nuclei, spin-lattice relaxation is dominated by electric quadrupole coupling and the spin relaxation time can be directly related to the reorientation of the C- bond. In this case, the second Legendre polynomial of the unit vector directed parallel to a C-H bond: is employed as a measure of the polymer segmental dynamics. is the angle of the bond vector at time relative to its original position at the time origin and the brackets denote an ensemble average over all C-H bonds in the system and across different time origins. Since our MD simulations were conducted using a united-atom model, hydrogens were reconstructed upon post-processing the trajectories, following the procedure described above.
8 presents the segmental correlation times, as extracted from the C-H vector autocorrelation functions from the simulation trajectories. The best fit parameters for the mKWW equation used are reported in Table S2 of the Supporting Information to the present paper. To be consistent with the NMR measurements, the weighted average autocorrelation function over the eight C-H vectors of each monomer was taken into account for the estimation of relaxation times. Again, functions were fitted with a mKWW equation (eq 3) in order to predict the relaxation time. C-H bond reorientation relaxation times are found to be in good agreement with the experimental data of He et al.75 obtained by NMR spin-lattice relaxation experiments and with the solid echo NMR measurements of Spiess and Sillescu.76 Despite the fact that our united-atom model with reconstruction of hydrogens exhibits faster dynamics at short time scales, it can capture reasonably well the evolution of autocorrelation functions at long timescales. Throughout the temperature range studied in our MD simulations, the segmental relaxation times are found to be in excellent agreement with the experimental measurements. Moreover, the nanocomposite system under study exhibits slower segmental dynamics than the bulk. However, as in the case of analysis, the overall dynamics of the systems are really close to each other, prompting the need for a local analysis of the segmental dynamics.
4.3 Many-nanoparticle influence on dynamics
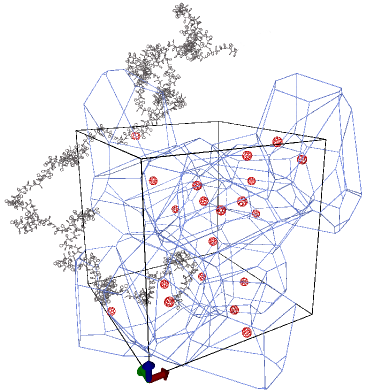
The study of local dynamics, when many nanoparticles are present, requires a tessellation of space, so as to quantify possible many-body effects. Two possible tessellation schemes are the partitioning of the space taken up by the material into Voronoi polyhedra, or their duals, Delaunay tetrahedra. Inspired by the work of Starr et al.77 on glass-forming liquids, we choose to carry out an analysis based on the Voronoi tessellation of the simulation box with fullerenes acting as the centers of the Voronoi cells ( 9). Voronoi polyhedra provide a direct way of quantifying the confinement imposed by a fullerene on its neighborhood. Smaller distances between neighboring fullerenes yield Voronoi cells of smaller volume. Thus, from now on, we will employ the volume of a Voronoi cell as a measure of the confinement experienced by the polymer lying in it (the smaller the cell the more confined the polymeric matrix around the specific fullerene). Some convenient features of the Voronoi tessellation, over its dual, are the constant number of cells (which is equal to the number of dispersed nanoparticles) and the significantly larger volume of the cells (since the Voronoi cells are always by one order of magnitude fewer than the Delaunay tetrahedra). The partitioning of the simulation box is carried out by using the well-established Voro++ software library of Rycroft et al.78, 79
4.4 Local mean-squared displacement of backbone carbon atoms
A rigorous way of studying the mobility of a polymeric melt is to calculate the mean-squared displacement (MSD) of backbone carbon atoms. In order to avoid chain end effects,80, 81 only the innermost backbone carbons along the chain contribute to the calculations:
| (5) |
with the value of the parameter quantifying the number of innermost atoms, on each side of the middle segment of each chain that are monitored. In our case, is set in such a way that we track half of the chain, excluding one fourth of the chain close to one end and one fourth close to the other end.
10 presents the mean-squared displacement of backbone carbon atoms as a function of time at a temperature of for both the filled and unfilled systems. As can be seen, nanocomposite systems exhibit lower mobility when compared to their neat counterparts. The MSD of backbone carbons is depressed upon the addition of fullerenes, in good agreement with the neutron scattering observations of Kropka et al.6 In the inset to 10, a logarithmic plot of the functions is presented. The scaling of is expected for the very short time behavior studied.82 As the Rouse model predicts, the segments do not feel the constraints of the entanglement network around them, following a Brownian motion in the free space available. This behavior is expected for times shorter than the characteristic time () when the segmental displacement becomes comparable to the tube diameter. Likhtman and McLeish 42 estimated that the time marking the onset of the effect of topological constraints on segmental motion, is for polystyrene. Since the results presented in 10 go up to , the scaling of is fully justifiable.
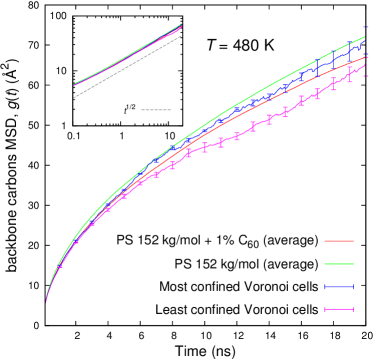
We now move to the estimation of the local MSD, for the timespan an atom spends inside a particular cell of the Voronoi tessellation. In our analysis we use the average MSD from the three most confined and three least confined cells, averaged over the three independent configurations created. We have observed that the volume of the Voronoi cells does not change significantly as a function of time. Based on this analysis for the nanocomposite system, the degree of depression is found to be a function of the confinement induced by the fullerenes. The diffusion of chains is spatially inhomogeneous, as observed by Desai et al.10 Small Voronoi cells tend to lead to higher mobility of the segments. This suggests an image of fullerenes as small grinders dispersed in the polystyrene matrix. Despite the fact that the addition of fullerenes limits the diffusion of polymeric chains, there exist regions in space, where the polymer can recover part of its dynamics due to the high level of confinement.
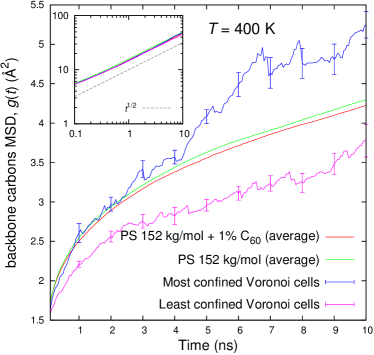
The dynamic heterogeneity of the nanocomposite systems grows as the temperature is lowered. The local mean-squared displacement of the backbone atoms, as a function of time, at a temperature of is presented in 11. As happens at higher temperature, the average MSD of the nanocomposite system is smaller compared to the average MSD of the bulk one. However, carbon atoms lying in the most confined Voronoi cells present larger displacements than the ones lying in the least confined. It can be observed that, despite the fact that MSD absolute values are getting smaller as expected, their variance when one studies local dynamics is larger. This observation strengthens our hypothesis that fullerenes act as nanoscopic grinders dispersed in the polymeric matrix, yielding strong deviation of polymer local dynamics from the bulk in their close neighborhood.
4.5 Fullerene rotational diffusivity
The fact that the fullerenes are geometrically rigid on an atomistic scale (although clearly vibrating) and essentially spherical enables their rotational motion to be readily characterized using a single rotational diffusion measure. If is any arbitrary unit vector embedded in the cluster and passing through its center, then the orientational correlation function can be computed. The simplest approach to define is to use the separation vector between each fullerene’s center of mass and a specific predefined atom.
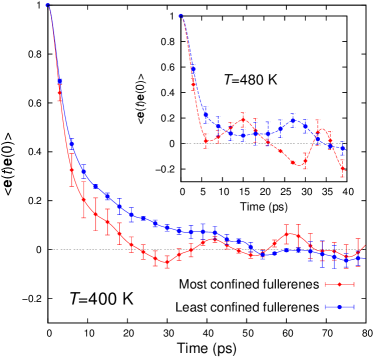
The results for two temperatures (which were considered for the local MSD calculation), are presented in 12. The main plot contains the results for the temperature of 400 K, while in the inset the rotational decorrelation function at 480 K is plotted. Despite the noise in the measurements (since only the three most confined and three least confined fullerenes contribute), it is clear that fullerenes which lie in the most confined cells rotate faster. There are many signs of anomalous rotational diffusion of fullerenes, which imply a strongly heterogeneous environment. An in-depth study of the fullerenes’ rotational diffusion is outside the scope of the present work. However, this surprising observation coheres to the image of the nanoparticles acting as nanoscopic grinders which force the polymeric chains to translate in their immediate neighborhood.
5 Local stresses
5.1 Distributions of atomic-level stresses
Atomic-level stresses can serve as a basis for characterizing local structure. Egami et al. 83 first applied atomic-level stresses to glasses in an atomistic computer model of amorphous iron. Theodorou and Suter 84 were the first to apply the idea of atomic level stresses to polymeric glasses, where both bonded and non-bonded interactions contribute to the stress. Following ref 84, we define the atomic stress tensor for atom , in a system with central forces by
| (6) |
where and are the position vectors of atoms and , the velocity of atom and is the force exerted on atom by atom . The indices and , indicating the three coordinate directions in a Cartesian system, assume the values , and . The superscript “min.im.” indicates interatomic distances and forces calculated according to the “minimum image convention”. Thompson et al.85 have described different ways of formulating per-atom and global virial and stress calculations, including how it is done in LAMMPS.30 According to their formulation, a virial contribution produced by a small set of atoms (e.g. 4 atoms in a dihedral angle) is assigned in equal portions to each one of these atoms.
In order to convert the virial into a stress, a local volume has to be associated with each atom. Here, we shall use a Voronoi tessellation to define atomic volumes, 78, 79 such that summing over all atoms gives the total volume of the system, . Note that this atom-level Voronoi tessellation is much finer than the Voronoi tessellation with respect to fullerene centers used to partition the sample volume among different fullerenes. Summation of all atomic-level stresses , multiplied by the appropriate volumes , yields the macroscopic stress; for a system in detailed mechanical equilibrium the “internal” stress tensor is recovered (this is a restatement of the virial theorem):86
| (7) |
Note that, as defined in eq 6, per-atom stress is the negative of the per-atom pressure tensor divided by an appropriate atomic volume. Thus, if the diagonal components of the per-atom stress tensor are summed for all atoms in the system and the sum is divided by where is the volume of the system, the ensemble average of the result should be , with being the total pressure of the system.
We introduce two invariants of the atomic-stress tensor83, 84 for characterizing local structure. The first is the “atomic-level hydrostatic pressure” , defined by:
| (8) |
Although is termed a “pressure”, it is really a tension or negative pressure. It can serve as a measure of local density fluctuations in the material. A high, positive value of is associated with a high coordination number around atom and with a lower than average atomic density. A low, negative value of is associated with a low coordination number and with higher than average local atomic density. The second invariant is the “atomic-level von Mises shear stress”, , defined by
| (9) |
where is the matrix representation of the unit tensor. The quantity reflects the degree of asymmetry of the local environment around atom .
Atomic-level stresses were calculated for an ensemble of 1200 configurations obtained during MD simulation at a temperature of . The characteristic quantities and were calculated according to eq 8 and eq 9, respectively. The distributions of and were accumulated seperately for each type of united atom interaction site (aliphatic \ceCH and \ceCH2, aromatic C and \ceCH, fullerene C) present in our system. These distributions are plotted in Figures S2 and S3 of the Supporting Information to the present paper. A striking feature, evident from the above figures, is the expected disparity in magnitude between the atomic-level stresses and the box (macroscopic) internal stress .84 There is a strong compensation effect in the summation of atomic-level stresses to the overall stress (eq 7). Theodorou and Suter84 have observed atomic-level stresses of the same order of magnitude as those reported here, in the case of well-relaxed configurations of glassy atactic polypropylene.
Atomic-level stresses are sensitive to the topology of bonded systems.84 Aliphatic \ceCH2 and aromatic \ceCH united atoms are under compression (), while aliphatic CH and aromatic C united atoms are under tension (). The same observations can be made for the nanocomposite systems. Fullerene carbon atoms, in the case of nanocomposite systems, are characterized by a broad distribution centered around zero. The moments of the distributions are reported in Table S3 of the Supporting Information to the present paper. In all cases, the distributions are slightly skewed to the left, meaning the peak of the distribution lies on the right of its mean value. However, skewness values are close to zero, implying nearly Gaussian distributions of atomic level hydrostatic pressures. The spread of the distribution reflects variations in density of the local environments. The distributions for aliphatic CH groups and aromatic carbons are considerably broader than those of aliphatic \ceCH2 and aromatic \ceCH groups, implying a variety of environments experienced by the atoms belonging to the former groups. The addition of fullerenes to PS does not seem to affect the atomic-level hydrostatic pressure distributions. Different species experience different shear stresses, as evidenced from Figure S3 and Table S4 of the Supporting Information to the present paper. Aromatic carbons are characterized by the broadest distribution of atomic-level von Mises shear stresses. This can be attributed to the exposure of the protruding phenyls to the surroundings of a chain, which creates a highly asymmetric local environment. On the contrary, aliphatic \ceCH2 interaction sites experience a considerably lower average shear stress, due to their shielded position in the backbone of the chain. The atomic shear-stress distributions are all skewed to the right (this is also the shape observed by Theodorou and Suter84) displaying extended tails to the right. Fullerene carbon atoms exhibit high atomic von-Mises shear stress, as expected, due to the stiff intramolecular potential which keeps them rigid.
5.2 Distribution of local stresses
In addition to the atomic-level stresses, we wish to obtain coarse-grained local stresses per Voronoi cell to examine the influence of the dispersed particles on the stress distribution in the material. There are several possibilities to compute the stress tensor in amorphous materials on intermediate scales. A widely accepted approach has been to partition the simulation cell into subvolumes, with only those atoms residing in each subvolume contributing to the local stress tensor of the region.87 The stress tensor within a region can be computed according to eq 7, where the sum runs only over those atoms that are in the given region at a particular time:88
| (10) |
This scheme converges to the macroscopic stress, eq 7, when the simulation box is taken as a single domain. The “local hydrostatic pressure”, , and the “local von Mises shear stress”, , can be calculated at a local level using eq 8 and eq 9, respectively.
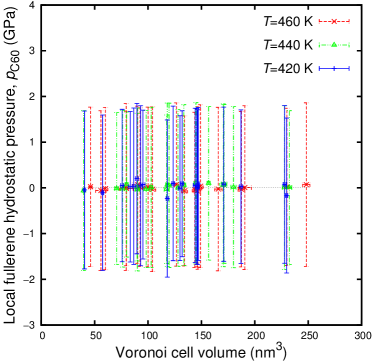
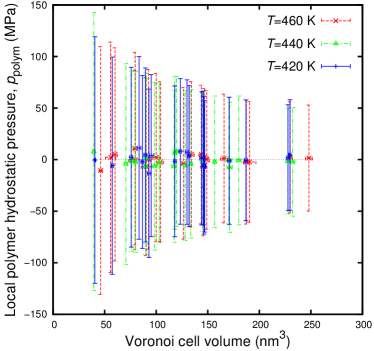
The influence of confinement on the local hydrostatic pressure, , as defined in eq 10, is examined in Figures 13 and 14. We first analyze the local pressure experienced by the fullerene atoms, , summing the stresses only for the 60 atoms constituting each fullerene ( 13). Then we study the local hydrostatic pressure experienced by the surrounding polymer atoms, . These quantities, when added, yield the negative of the box pressure, . is the sum of the volumes of the small (atomic) Voronoi polyhedra around the carbon atoms constituting a fullerene. By construction, this contains the hollow space in the fullerene, i.e. is approximately equal to the volume of the fullerene sphere. On the other hand, is the sum of the small atomic Voronoi volumes of polymer atoms contained in a larger Voronoi polyhedron around a fullerene obtained from the tessellation of the simulation box based on \ceC60 centers. The volume of the large Voronoi cell, i.e. the one used for quantifying confinement, serves as the abscissa of both Figures 13 and 14. The number of atoms per cell does not remain constant throughout the simulation but fluctuates slightly depending on the local particle density and the shape (number of faces) of the Voronoi cell. Inspecting the local hydrostatic pressures, we see in Figures 13 and 14 that the pressure distributions are almost symmetrically centered around the macroscopic set point pressure. The standard deviation of the distribution of local pressures becomes larger, as the volume of the Voronoi cell decreases. This fact is expected in the case of ( 14), where, as the length scale of the observation becomes smaller, increasing fluctuations are observed.88 On the contrary, in the case of ( 13), the dispersion of local pressures is not affected by the size of the Voronoi cell the fullerenes occupy, since a constant number of atoms (60) contribute to the local hydrostatic pressure. Fullerenes experience nearly zero hydrostatic pressure with a rather narrow distribution around its mean value. Figures 13 and 14 indicate that the local hydrostatic pressures are not sensitive to the temperature, in the melt state.
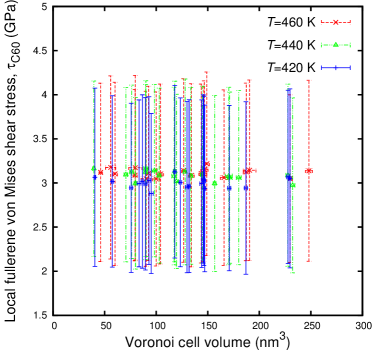
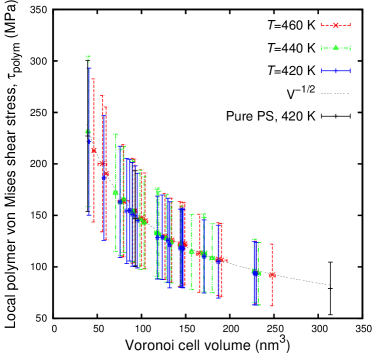
Figures 15 and 16 present the local von Mises stresses of fullerenes and surrounding polymeric atoms, respectively. As evident from 15, fullerenes experience strong shear stresses, which seem to be independent of the volume the Voronoi cell which they occupy. The average fullerene von Mises shear stress is approximately 3 GPa, irrespectively of the simulation temperature. This high value may be attributed to the stiff intramolecular potential which makes fullerenes behave as rigid bodies. On the contrary, the local von Mises shear stress of the polymer occupying a Voronoi cell is not fixed. It is a function of the volume of the cell, as presented in 16. Shear stresses become more pronounced, as the volume of the reference domain becomes smaller. As the length-scale of observation increases, fluctuations cancel each other yielding lower shear stress. At the length scale of the simulation box, shear stresses almost vanish. This length-scale dependence of von Mises shear stress has been also found for pure PS. In both cases (pure and composite), the von Mises shear stress scales as the inverse square root of the volume. This scaling can be envisioned as the dependence of an equilibrium fluctuation quantity on the observation length-scale. The length-scale dependence of the shear stresses will be the focus of future work. By a careful look at 16, it can be observed that the addition of fullerenes shifts the von Mises shear stresses of polymeric atoms to slightly higher values, retaining the same length-scale dependence.
6 Summary and Conclusions
In this paper, we have outlined a strategy for simulating monodisperse long-chain atactic polystyrene nanocomposite melts at two interconnected levels of description: a coarse-grained one, wherein each diad along the chains is represented as a single interaction site, or “superatom”, and a detailed one, employing a united-atom model representation for the polymer. Results from both levels, applied to a nanocomposite of high importance, have been presented. We focus on high molecular weight PS melts with fullerene (\ceC60) molecules dispersed at a mass fraction of 1% , specifications identical to systems already studied experimentally.6
A state-of-the-art Monte Carlo builder has been developed which can build polymeric chains of arbitrary geometry in heavily constrained environments. It is based on the well-known quasi-Metropolis scheme of Theodorou and Suter25 for generating amorphous configurations in a bond-by-bond fashion. The original source code has been extended by an on-the-fly minimization strategy for driving the insertion of monomers in constrained environments. The minimizer generates a set of minima, from which one is selected following a quasi-Metropolis procedure.
The coarse-grained simulations of the PS-\ceC60 composite were based on the PS model of Milano and Müller-Plathe.18 The coarse-grained model was equilibrated at using connectivity-altering Monte Carlo moves along with flips, rotations, reptations and concerted rotations.19 Chain conformations obtained through these coarse-grained simulations were found to be equilibrated at all length scales. Chain dimensions, as predicted from the mean square end-to-end distance ( 1) and from the mean square radius of gyrations ( 2) were found to be in excellent agreement with available experimental evidence. Chain conformations of the nanocomposite systems were found to be similar to the ones of the neat polymeric systems. No effect of the dispersion of \ceC60s has been observed at the coarse-grained level.
Well-equilibrated melt configurations sampled by coarse-grained MC were reverse-mapped to the atomistic level. In continuation to the previous efforts on reverse mapping of coarse-grained polystyrene, for the first time a rigorous and systematic approach is presented, which yields atomistic configurations exhibiting characteristics in excellent agreement with experimental measurements. Our approach encompasses three stages: (a) a quasi-Metropolis procedure for the re-introduction of the atomistic sites by selecting their locations from a set of candidate ones. (b) A local Metropolis Monte Carlo simulation where flips, ring rotations and configurationally biased regrowths of atomistic sites are used.19 This is the key step in order to guide the reverse-mapping process into a conformationally reasonable subspace of the configuration space of the detailed model. (c) an energy minimization step using the full atomistic forcefield with gradual introduction of non-bonded interactions. During the whole reverse-mapping procedure, \ceCH2 sites (centers of CG sites) are kept fixed, preserving the well-equilibrated coarse-grained configurations. The distributions of torsion angles in the reverse-mapped configurations (Figures 5(a) and 6(a)) are indistinguishable from those of 80-mer configurations equilibrated directly via MD using the same united-atom model. Moreover, configurations obtained from reverse mapping exhibit populations of trans, gauche and gauche-bar conformations in favorable agreement with NMR data and RIS calculations. Also, Ramachandran plots for successive torsion angles along the chain backbone (Figures 5(b,c,d) and 6(b,c,d)) exhibit symmetric tg and gt peaks and extremely low percentages of tḡ and ḡ t sequences. Torsion angle distributions constitute a stringent test for reverse-mapped structures, in which our reverse-mapping scheme fully succeeds.
The ultimate goal of our work, i.e. the study of PS-\ceC60 dynamics at the segmental and local levels, is accomplished via analyzing long MD trajectories of our well-equilibrated reverse-mapped structures. Our simulation results generally indicate that the addition of \ceC60 to PS leads to slower segmental dynamics (as estimated by characteristic times extracted from the decay of orientational time-autocorrelation functions of suitably chosen vectors). The characteristic times found by fitting the function of the orientation of the center of mass of the phenyl rings with respect to the chain backbone suggest an increase of the bulk of around , upon the addition of \ceC60s at a concentration of 1% by weight ( 7). This observation is in favorable agreement with DS measurements of Kropka et al.6 who reported a shift of . The same conclusion can be reached by studying the function of the orientation of C-H bonds. Despite the fact that we employ a united-atom model for our MD simulations, the introduction of hydrogen atoms at a post-processing step yields reasonable dynamics for C-H bonds in good agreement with spin-lattice relaxation and solid echo NMR measurements on molten polystyrene ( 8). Again, nanocomposite systems are found to exhibit slightly slower dynamics than their neat polymer counterparts.
We then employ a space discretization in order to study the effect of \ceC60s on segmental dynamics at a local level. Each fullerene serves as the center of a Voronoi cell, whose volume is determined by the neighboring fullerenes. Backbone carbons lying in every cell are tracked throughout the MD trajectory and their mean-squared displacement is measured for the time they reside in the same cell. Overall mean-squared displacement of backbone atoms is found to be smaller in the presence of fullerenes, than in bulk PS ( 10). However, atoms moving in smaller (more confined) Voronoi cells exhibit faster motion than the atoms moving inside larger Voronoi cells. This can be correlated with the increased rotational diffusion of fullerenes, as the volume of the Voronoi cell becomes smaller. These observations drive us to envision fullerenes as nanoscopic millstones, inducing shearing stresses on their environment and thus forcing the polymeric chains to move. The dynamic heterogeneity caused by the addition of fullerenes exhibits strong temperature dependence, getting larger as the temperature is lowered.
Finally, we study the atomic-level and local stresses which are present in our systems. Each united atom is characterized by a distribution of atomic stresses whose shape and position reflect its chemical nature, connectivity, and geometric disposition within the system. The addition of fullerenes causes an imperceptible broadening of the atomic-level stress distributions, implying a slightly higher stress heterogeneity for the composite material. This observation is further elaborated by the estimation of local stresses, at the level of Voronoi cells around individual fullerenes, into which the system has been partitioned. Dispersed fullerenes are characterized by large shear stresses, probably due to their intramolecular forcefield which reflects their rigidity. The local von Mises shear stress of the polymer has been found to scale as the inverse square root of the volume of the material used for the calculation, as expected from fluctuation theory. Local von Mises stresses are very similar between the neat polymer and the nanocomposite, being slightly higher in the latter. They are also rather insensitive to temperature.
Our analysis of polymer atom mean square displacement and fullerene rotational motion implies that fullerenes greatly amplify the dynamic heterogeneity of the molten atactic polystyrene, at the same time slowing down its overall dynamics slightly. Further work is required to establish the effect of the addition of nanoparticles on terminal relaxation and viscosity. In a future work we will focus on the effect of temperature and glass transition on the local stresses in the glassy state.
Part of this work was funded by the European Union through the project COMPNANOCOMP under grant number 295355. G.V. wants to thank the Alexander S. Onassis Public Benefit Foundation for a doctoral scholarship. We are grateful to Dr. Dora Spyriouni for sharing her PS MC code with us and thoroughly answering all our questions. Generous allocation of computer time on clusters of the School of Chemical Engineering of the National Technical University of Athens, expertly maintained by Prof. Andreas Boudouvis and his collaborators, is gratefully acknowledged. Computer time provided on clusters of the Department of Mechanical Engineering of the Technische Universiteit Eindhoven, maintained by Leo H.G. Wouters, is also acknowledged. Code development was greatly facilitated by using hardware donated by nVIDIA to the authors through nVIDIA Academic Partnership Program. Last but not least, fruitful discussions with Prof. Polykarpos Pissis (NTUA), Dr. Loukas Peristeras (Scienomics), Dr. Evangelos Voyiatzis (TU Darmstadt) and dr. ir. Lambert C.A. van Breemen (TU Eindhoven) are gratefully acknowledged.
Hydrogen reconstruction schematic, orientational autocorrelation functions fitting and atomic-level stress distributions.
References
- Einstein 1906 Einstein, A. Ann. Phys. 1906, 324, 289–306
- Einstein 1911 Einstein, A. Ann. Phys. 1911, 339, 591–592
- Mackay et al. 2003 Mackay, M. E.; Dao, T. T.; Tuteja, A.; Ho, D. L.; Van Horn, B.; Kim, H.-C.; Hawker, C. J. Nat. Mater. 2003, 2, 762–766
- Tuteja et al. 2005 Tuteja, A.; Mackay, M. E.; Hawker, C. J.; Van Horn, B. Macromolecules 2005, 38, 8000–8011
- Tuteja et al. 2007 Tuteja, A.; Duxbury, P. M.; Mackay, M. E. Macromolecules 2007, 40, 9427–9434
- Kropka et al. 2008 Kropka, J. M.; Garcia Sakai, V.; Green, P. F. Nano Lett. 2008, 8, 1061–1065
- Sanz et al. 2008 Sanz, A.; Ruppel, M.; Douglas, J. F.; Cabral, J. T. J. Phys.: Condens. Matter 2008, 20, 104209
- Wong et al. 2010 Wong, H. C.; Sanz, A.; Douglas, J. F.; Cabral, J. T. J. Mol. Liq. 2010, 153, 79 – 87
- Vacatello 2001 Vacatello, M. Macromolecules 2001, 34, 1946–1952
- Desai et al. 2005 Desai, T.; Keblinski, P.; Kumar, S. K. J. Chem. Phys. 2005, 122, 134910
- Smith et al. 2002 Smith, G. D.; Bedrov, D.; Li, L.; Byutner, O. J. Chem. Phys. 2002, 117, 9478–9489
- Smith et al. 2003 Smith, G. D.; Bedrov, D.; Borodin, O. Phys. Rev. Lett. 2003, 90, 226103
- Ndoro et al. 2012 Ndoro, T. V. M.; Böhm, M. C.; Müller-Plathe, F. Macromolecules 2012, 45, 171–179
- Toepperwein et al. 2011 Toepperwein, G. N.; Karayiannis, N. C.; Riggleman, R. A.; Kröger, M.; de Pablo, J. J. Macromolecules 2011, 44, 1034–1045
- Li et al. 2012 Li, Y.; Kröger, M.; Liu, W. K. Phys. Rev. Lett. 2012, 109, 118001
- Li et al. 2012 Li, Y.; Kröger, M.; Liu, W. K. Macromolecules 2012, 45, 2099–2112
- Theodorou 2007 Theodorou, D. N. Chem. Eng. Sci. 2007, 62, 5697 – 5714
- Milano and Müller-Plathe 2005 Milano, G.; Müller-Plathe, F. J. Phys. Chem. B 2005, 109, 18609–18619
- Spyriouni et al. 2007 Spyriouni, T.; Tzoumanekas, C.; Theodorou, D.; Müller-Plathe, F.; Milano, G. Macromolecules 2007, 40, 3876–3885
- Dünweg and Kremer 1993 Dünweg, B.; Kremer, K. J. Chem. Phys. 1993, 99, 6983–6997
- Hamaker 1937 Hamaker, H. Physica(Amsterdam) 1937, IV, 1058
- Girifalco 1992 Girifalco, L. A. J. Phys. Chem. 1992, 96, 858–861
- Müller et al. 2011 Müller, M.; Steinmüller, B.; Daoulas, K. C.; Ramirez-Hernandez, A.; de Pablo, J. J. Phys. Chem. Chem. Phys. 2011, 13, 10491–10502
- Mondello et al. 1994 Mondello, M.; Yang, H.-J.; Furuya, H.; Roe, R.-J. Macromolecules 1994, 27, 3566–3574
- Theodorou and Suter 1985 Theodorou, D. N.; Suter, U. W. Macromolecules 1985, 18, 1467–1478
- Sato et al. 1982 Sato, H.; Tanaka, Y.; Hatada, K. Makromol. Chem., Rapid Commun. 1982, 3, 181–185
- Kawamura et al. 1982 Kawamura, T.; Uryu, T.; Matsuzaki, K. Makromol. Chem., Rapid Commun. 1982, 3, 661–665
- Sato et al. 1983 Sato, H.; Tanaka, Y.; Hatada, K. J. Polym. Sci., Polym. Phys. Ed. 1983, 21, 1667–1674
- Nelder and Mead 1965 Nelder, J. A.; Mead, R. The Computer Journal 1965, 7, 308–313
- Plimpton 1995 Plimpton, S. J. Comp. Phys. 1995, 117, 1 – 19
- Polak 1971 Polak, E. Computational Methods in Optimization: A Unified Approach; Mathematics in science and engineering; Elsevier Science: New York, USA, 1971
- Ribière 1969 Ribière, G. Revue Française d’ Informatique et de Recherche Opérationnelle 1969, 16, 35–43
- Karayiannis et al. 2002 Karayiannis, N. C.; Mavrantzas, V. G.; Theodorou, D. N. Phys. Rev. Lett. 2002, 88, 105503
- Karayiannis et al. 2002 Karayiannis, N. C.; Giannousaki, A. E.; Mavrantzas, V. G.; Theodorou, D. N. J. Chem. Phys. 2002, 117, 5465–5479
- Dodd et al. 1993 Dodd, L.; Boone, T.; Theodorou, D. Mol. Phys. 1993, 78, 961–996
- Pant and Theodorou 1995 Pant, P. V. K.; Theodorou, D. N. Macromolecules 1995, 28, 7224–7234
- de Pablo et al. 1992 de Pablo, J. J.; Laso, M.; Suter, U. W. J. Chem. Phys 1992, 96, 2395–2403
- Auhl et al. 2003 Auhl, R.; Everaers, R.; Grest, G. S.; Kremer, K.; Plimpton, S. J. J. Chem. Phys. 2003, 119, 12718–12728
- Fetters et al. 1994 Fetters, L. J.; Lohse, D. J.; Richter, D.; Witten, T. A.; Zirkel, A. Macromolecules 1994, 27, 4639–4647
- Cotton et al. 1974 Cotton, J. P.; Decker, D.; Benoit, H.; Farnoux, B.; Higgins, J.; Jannink, G.; Ober, R.; Picot, C.; des Cloizeaux, J. Macromolecules 1974, 7, 863–872
- Vogiatzis et al. 2011 Vogiatzis, G. G.; Voyiatzis, E.; Theodorou, D. N. Eur. Polym. J. 2011, 47, 699 – 712
- Likhtman and McLeish 2002 Likhtman, A. E.; McLeish, T. C. B. Macromolecules 2002, 35, 6332–6343
- Destree et al. 2000 Destree, M.; Laupretre, F.; Lyulin, A.; Ryckaert, J.-P. J. Chem. Phys. 2000, 112, 9632–9644
- Lempesis et al. 2013 Lempesis, N.; Vogiatzis, G. G.; Boulougouris, G. C.; van Breemen, L. C.; Hütter, M.; Theodorou, D. N. Mol. Phys. 2013, 111, 3430–3441
- Mayo et al. 1990 Mayo, S. L.; Olafson, B. D.; Goddard, W. A. J. Phys. Chem. 1990, 94, 8897–8909
- Monticelli 2012 Monticelli, L. J. Chem. Theory Comput. 2012, 8, 1370–1378
- Flory et al. 1974 Flory, P. J.; Sundararajan, P. R.; DeBolt, L. C. J. Am. Chem. Soc. 1974, 96, 5015–5024
- Humphrey et al. 1996 Humphrey, W.; Dalke, A.; Schulten, K. J. Mol. Graphics 1996, 14, 33 – 38
- Nocedal and Wright 2000 Nocedal, J.; Wright, S. Numerical Optimization, 2nd ed.; Springer series in operations research and financial engineering; Springer-Verlag: New York, USA, 2000
- Bristow and Watson 1958 Bristow, G. M.; Watson, W. F. Trans. Faraday Soc. 1958, 54, 1742–1747
- Robyr et al. 1995 Robyr, P.; Tomaselli, M.; Grob-Pisano, C.; Meier, B. H.; Ernst, R. R.; Suter, U. W. Macromolecules 1995, 28, 5320–5324
- Robyr et al. 1998 Robyr, P.; Gan, Z.; Suter, U. W. Macromolecules 1998, 31, 8918–8923
- Robyr et al. 1999 Robyr, P.; Müller, M.; Suter, U. W. Macromolecules 1999, 32, 8681–8684
- Rapold et al. 1994 Rapold, R. F.; Suter, U. W.; Theodorou, D. N. Macromol. Theory Simul. 1994, 3, 19–43
- Rapold and Suter 1994 Rapold, R. F.; Suter, U. W. Macromol. Theory Simul. 1994, 3, 1–17
- Dunbar et al. 1998 Dunbar, M.; Novak, B.; Schmidt-Rohr, K. Solid State Nucl. Magn. Reson. 1998, 12, 119 – 137
- Williams and Flory 1969 Williams, A. D.; Flory, P. J. J. Am. Chem. Soc. 1969, 91, 3111–3118
- Fujiwara and Flory 1970 Fujiwara, Y.; Flory, P. J. Macromolecules 1970, 3, 43–49
- Ghanbari et al. 2011 Ghanbari, A.; Böhm, M. C.; Müller-Plathe, F. Macromolecules 2011, 44, 5520–5526
- Yoon et al. 1975 Yoon, D. Y.; Sundararajan, P. R.; Flory, P. J. Macromolecules 1975, 8, 776–783
- Shinoda et al. 2004 Shinoda, W.; Shiga, M.; Mikami, M. Phys. Rev. B 2004, 69, 134103
- Tuckerman et al. 2006 Tuckerman, M. E.; Alejandre, J.; López-Rendón, R.; Jochim, A. L.; Martyna, G. J. J. Phys. A: Math. Gen. 2006, 39, 5629
- Allen and Tildesley 1989 Allen, P.; Tildesley, D. Computer Simulation of Liquids; Oxford University Press: USA, 1989
- Nosé 1984 Nosé, S. Mol. Phys. 1984, 52, 255–268
- Ahumada et al. 2002 Ahumada, O.; Theodorou, D. N.; Triolo, A.; Arrighi, V.; Karatasos, C.; Ryckaert, J.-P. Macromolecules 2002, 35, 7110–7124
- Kohlrausch 1854 Kohlrausch, R. Ann. Phys. (Berlin, Ger.) 1854, 167, 56–82
- Williams and Watts 1970 Williams, G.; Watts, D. C. Trans. Faraday Soc. 1970, 66, 80–85
- Logotheti and Theodorou 2007 Logotheti, G. E.; Theodorou, D. N. Macromolecules 2007, 40, 2235–2245
- Smith et al. 1997 Smith, G. D.; Yoon, D. Y.; Wade, C. G.; O’Leary, D.; Chen, A.; Jaffe, R. L. J. Chem. Phys. 1997, 106, 3798–3805
- Doxastakis et al. 2003 Doxastakis, M.; Theodorou, D. N.; Fytas, G.; Kremer, F.; Faller, R.; Müller-Plathe, F.; Hadjichristidis, N. J. Chem. Phys. 2003, 119, 6883–6894
- Harmandaris et al. 2011 Harmandaris, V. A.; Floudas, G.; Kremer, K. Macromolecules 2011, 44, 393–402
- Williams et al. 1955 Williams, M. L.; Landel, R. F.; Ferry, J. D. J. Am. Chem. Soc. 1955, 77, 3701–3707
- Hintermeyer et al. 2008 Hintermeyer, J.; Herrmann, A.; Kahlau, R.; Goiceanu, C.; Rössler, E. A. Macromolecules 2008, 41, 9335–9344
- Kumar et al. 1996 Kumar, S. K.; Colby, R. H.; Anastasiadis, S. H.; Fytas, G. J. Chem. Phys. 1996, 105, 3777–3788
- He et al. 2004 He, Y.; Lutz, T. R.; Ediger, M. D.; Ayyagari, C.; Bedrov, D.; Smith, G. D. Macromolecules 2004, 37, 5032–5039
- Spiess and Sillescu 1981 Spiess, H.; Sillescu, H. J. Magn. Reson. (1969-1992) 1981, 42, 381 – 389
- Starr et al. 2002 Starr, F. W.; Sastry, S.; Douglas, J. F.; Glotzer, S. C. Phys. Rev. Lett. 2002, 89, 125501
- Rycroft 2009 Rycroft, C. H. Chaos 2009, 19, 041111
- Rycroft et al. 2006 Rycroft, C. H.; Grest, G. S.; Landry, J. W.; Bazant, M. Z. Phys. Rev. E 2006, 74, 021306
- Harmandaris et al. 2002 Harmandaris, V. A.; Doxastakis, M.; Mavrantzas, V. G.; Theodorou, D. N. J. Chem. Phys. 2002, 116, 436–446
- Harmandaris et al. 2003 Harmandaris, V. A.; Mavrantzas, V. G.; Theodorou, D. N.; Kröger, M.; Ramírez, J.; Öttinger, H. C.; Vlassopoulos, D. Macromolecules 2003, 36, 1376–1387
- Doi and Edwards 1990 Doi, M.; Edwards, S. The Theory of Polymer Dynamics; The International Series of Monographs on Physics Series; Oxford University Press: New York, USA, 1990
- Egami et al. 1980 Egami, T.; Maeda, K.; Vitek, V. Philos. Mag. A 1980, 41, 883–901
- Theodorou and Suter 1986 Theodorou, D. N.; Suter, U. W. Macromolecules 1986, 19, 379–387
- Thompson et al. 2009 Thompson, A. P.; Plimpton, S. J.; Mattson, W. J. Chem. Phys. 2009, 131, 154107
- Theodorou et al. 1993 Theodorou, D. N.; Boone, T. D.; Dodd, L. R.; Mansfield, K. F. Macromol. Theory Simul. 1993, 2, 191–238
- Yoshimoto et al. 2004 Yoshimoto, K.; Jain, T. S.; Workum, K. V.; Nealey, P. F.; de Pablo, J. J. Phys. Rev. Lett. 2004, 93, 175501
- MacNeill and Rottler 2010 MacNeill, D.; Rottler, J. Phys. Rev. E 2010, 81, 011804