Discovery and Observations of ASASSN-13db, an EX Lupi-Type Accretion Event on a Low-Mass T Tauri Star
Abstract
We discuss ASASSN-13db, an EX Lupi-type (“EXor”) accretion event on the young stellar object (YSO) SDSS J051011.01032826.2 (hereafter SDSSJ0510) discovered by the All-Sky Automated Survey for SuperNovae (ASAS-SN). Using archival photometric data of SDSSJ0510 we construct a pre-outburst spectral energy distribution (SED) and find that it is consistent with a low-mass class II YSO near the Orion star forming region ( pc). We present follow-up photometric and spectroscopic observations of the source after the 5.4 magnitude outburst that began in September 2013 and ended in early 2014. These data indicate an increase in temperature and luminosity consistent with an accretion rate of yr-1, three or more orders of magnitude greater than in quiescence. Spectroscopic observations show a forest of narrow emission lines dominated by neutral metallic lines from Fe I and some low-ionization lines. The properties of ASASSN-13db are similar to those of the EXor prototype EX Lupi during its strongest observed outburst in late 2008.
Subject headings:
stars: activity — stars: individual (SDSS J051011.01032826.2) — stars: pre-main sequence1. Introduction
Young stars are often variable (e.g., Herbst et al., 1994), and are known to undergo significant eruptions marking substantial increases in their accretion rates (e.g., Herbig, 1977; Hartmann & Kenyon, 1996), during which they are thought to accrete a significant fraction of their total mass. A class of young stellar objects (YSOs) that repeatedly undergo these eruptions, named “EXors” after the prototype EX Lupi (e.g., Herbig, 1989, 2008), has been the subject of recent studies (e.g., Sicilia-Aguilar et al., 2012; Lorenzetti et al., 2012; Antoniucci et al., 2013; Kóspál et al., 2014). The physical mechanisms responsible for triggering these outbursts remain poorly understood (e.g., Sicilia-Aguilar et al., 2012; Kóspál et al., 2014), but a recent study of the 2008 EX Lupi outburst by Kóspál et al. (2014) suggests that a sub-stellar binary companion could be involved. Other possible causes include the magnetorotational instability (e.g., Bae et al., 2013), disk fragmentation (e.g., Vorobyov & Basu, 2005), and instabilities at the disk truncation radius from the stellar magnetosphere (e.g., D’Angelo & Spruit, 2010).
Among the defining characteristics of EXors are that they erupt every few years with variable peak luminosities, typical visual amplitudes of up to mag, and outburst durations of a few months to a year. At minimum light, EXors resemble classical T Tauri stars (TTSs) with absorption spectra like those of late K- or early M-dwarfs and a strong Li I line at 6707Å (Herbig, 2008). At maximum light, their spectra are dominated by a hot continuum and quiescent absorption features appear as emission lines, indicating increased accretion (Herbig, 1989, 2008; Lorenzetti et al., 2012).
In this Letter we describe the discovery and follow-up observations of a new EXor-type outburst, ASASSN-13db. The transient was discovered by the All-Sky Automated Survey for SuperNovae (ASAS-SN111http://www.astronomy.ohio-state.edu/${∼}$assassin/index.shtml), a long-term project to monitor the whole sky on a rapid cadence to find nearby supernovae and other transients (see Shappee et al. 2013 for details). Our transient source detection pipeline was triggered on 2013 September 24, detecting a change in -band magnitude from to over a span of 15 days in the red source SDSS J051011.01032826.2 (hereafter SDSSJ0510). The source is located roughly ( 50 pc) from the Orion Nebula and roughly ( 10 pc) from the L1615/L1616 cloud, both regions of star formation at a distance of pc (averaging recent estimates from Menten et al. (2007); Hirota et al. (2007); and Sandstrom et al. (2007)). We assume this distance for SDSSJ0510. Follow-up spectroscopic observations with the Magellan Echellette spectrograph (MagE; Marshall et al. 2008) on 2013 September 26 showed a highly unusual spectrum with a plethora of emission lines, and we began a follow-up campaign in order to characterize this transient.
In §2 we describe pre-outburst archival observations, including a previous outburst recorded in 20102011, and new data taken during and after the outburst as part of our follow-up campaign. In §3 we analyze these data and describe the properties of the star in quiescence and in outburst. Finally, in §4 we compare these properties to those of known EXors and the prototype EX Lupi.
2. Observations and Survey Data
Here we summarize the available archival data in quiescence and outburst as well as our new photometric and spectroscopic observations.
2.1. Photometry in Quiescence
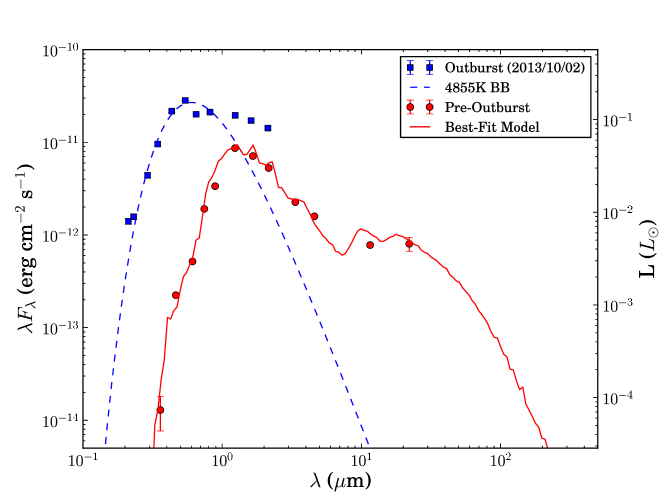
We retrieved archival photometry of SDSSJ0510 in quiescence spanning the optical to the mid-infrared (IR) from the Sloan Digital Sky Survey (SDSS; York et al., 2000), the Two-Micron All Sky Survey (2MASS; Skrutskie et al., 2006), and the Wide-field Infrared Survey Explorer (WISE; Wright et al., 2010) based on a coordinate cross-match to the ASAS-SN position. There are no Spitzer, Herschel, or AKARI observations of the source. We used the , , and magnitudes in §3.1 to construct a Spectral Energy Distribution (SED) for the progenitor, as shown in Figure 1. From the SDSS data, and using M-dwarf templates from Bochanski et al. (2007), we estimate the quiescent V-band magnitude to be .
2.2. Prior Outburst
After the discovery of ASASSN-13db, we examined existing data for SDSSJ0510 from the Catalina Real-Time Transient Survey (CRTS; Drake et al., 2009), the Mobile Astronomical System of TElescope Robots (MASTER), and the Near-Earth Asteroid Tracking program (NEAT). The NEAT data indicate that SDSSJ0510 did not have any eruptions between December 2000 and February 2003, but we found that it had a previously unreported outburst in late 2010 and early 2011 that was observed by CRTS and MASTER (Denisenko et al., private communication). SDSSJ0510 had on 2010 November 08 (CRTS) and 2011 October 2 (CRTS), but had in 2010 December (multiple CRTS epochs) and was brighter than the present outburst with on 2011 January 22 (MASTER). The length and magnitude of this previous outburst are consistent with a large EXor-type event.
2.3. New Photometric Observations
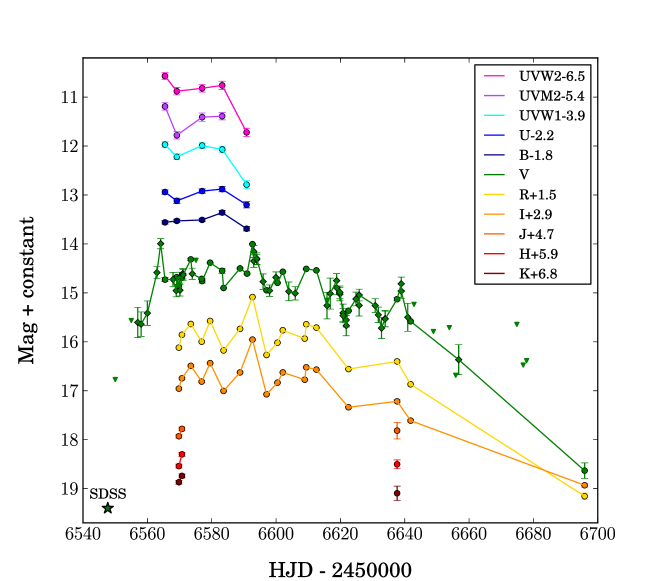
The emission lines seen in the initial follow-up spectrum of ASASSN-13db indicated that it must be hot and should have increased ultraviolet (UV) emission. Based on this, we requested and were granted a series of Swift X-ray Telescope (XRT; Burrows et al., 2005) and UltraViolet and Optical Telescope (UVOT; Roming et al., 2005) ToO observations. The Swift UVOT observations of ASASSN-13db were obtained in 6 filters: (5468 Å), (4392 Å), (3465 Å), (2600 Å), (2246 Å), and (1928 Å) (Poole et al., 2008). We used the UVOT software task uvotsource to extract the source and background counts from a 50 radius region and a sky region with radius of 200. The UVOT count rates were converted into magnitudes and fluxes based on the most recent UVOT calibration (Poole et al., 2008; Breeveld et al., 2010). The UVOT data are shown along with other photometric data in Figure 2.
The XRT was operating in Photon Counting mode (Hill et al., 2004) during our observations. The data were reduced and combined with the software tasks xrtpipeline and xselect to obtain an image in the 0.310 keV range with total exposure time of 5388 s. We used a region with a radius of 20 pixels (471) centered on the source position to extract source counts and a source-free region with a radius of 100 pixels (2357) for background counts. We measured 7 counts in the source region and 113 counts in the background region, giving an expected number of counts in the source region of 4.5. We do not detect X-ray emission from ASASSN-13db to a 3-sigma upper limit (Kraft et al., 1991) of counts s-1, equivalent to erg cm-2 s-1. This is not strongly constraining, as the source’s emission drops strongly at sub-UV wavelengths, so we do not use this limit when fitting the outburst SED.
In addition to the Swift observations, we obtained optical and near-IR photometry from a number of ground-based observatories. observations were obtained at the Las Cumbres Observatory Global Telescope Network (LCOGT) 1-m facilities in Cerro Tololo, Chile and Sutherland, South Africa (Brown et al., 2013) and with the Ohio State Multiobject Spectrograph (OSMOS; Martini et al. 2011) on the MDM 2.4-m telescope. observations were obtained with ANDICAM on the CTIO 1.3-m telescope. All images were reduced following standard procedures. The aperture magnitudes were calibrated using SDSS stars in the field transformed onto the Johnson-Cousins magnitude system using Lupton (2005), while the magnitudes were calibrated using a 2MASS star in the field. These data are shown in Figure 2, along with all photometric data from the ASAS-SN pipeline.
2.4. New Spectroscopic Observations
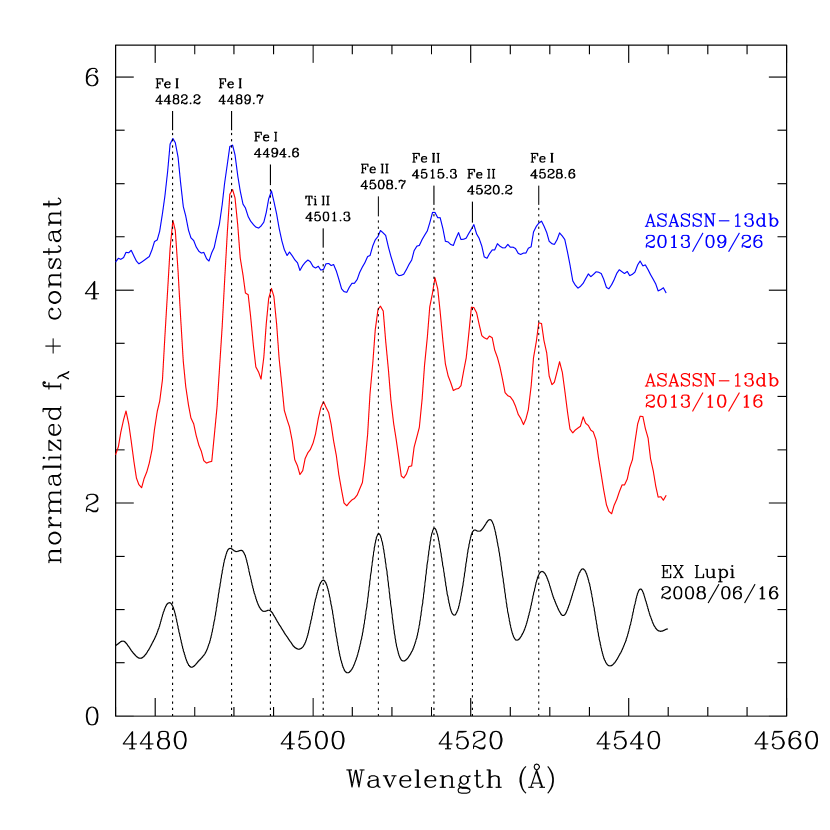
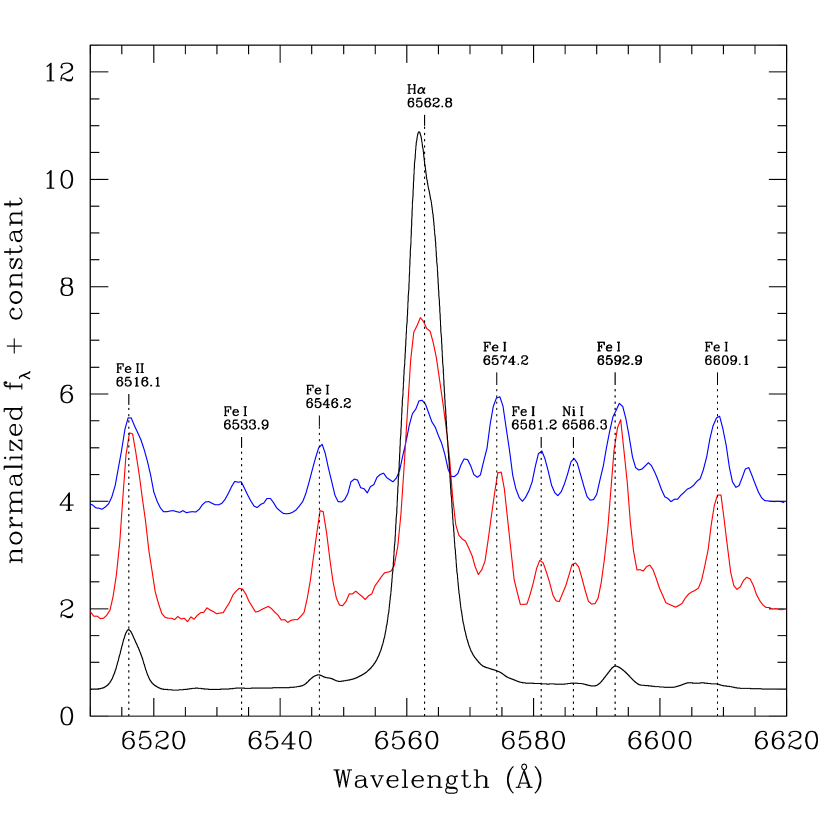
We obtained optical spectra with multiple telescopes and instruments between 2013 September 26 and 2014 January 19. The instruments/telescopes used were CCDS on the MDM 2.4-m, the Magellan Echellette spectrograph (MagE) on the Magellan Clay 6.5-m at Las Campanas Observatory (LCO), the Multi-Object Double Spectrographs (MODS; Pogge et al. 2010) on the 8.4-m Large Binocular Telescope (LBT) on Mount Graham, the Dual Imaging Spectrograph (DIS) on the Apache Point Observatory 3.5-m telescope, and the B&C spectrograph on the Steward Observatory Bok 2.3-m telescope at the Kitt Peak National Observatory (KPNO). The spectra from CCDS, DIS, and B&C were reduced using standard techniques in IRAF. The spectra from MODS were reduced using IRAF and the MODS pipeline in IDL. The spectra from MagE were reduced using the Carnegie pipeline. Figure 3 shows a montage of the flux-calibrated spectra from MODS, CCDS, and the B&C. Figure 4 shows a small section of the MagE intermediate-resolution () spectra.
3. Analysis
3.1. Spectral Energy Distribution
Figure 1 shows the pre-outburst SED of SDSSJ0510 as compared to its SED during outburst on 2013 October 2. Also shown is the best-fit SED model for SDSSJ0510 generated by the Robitaille et al. (2007) YSO SED fitting tool222http://caravan.astro.wisc.edu/protostars/sedfitter.php (model ID 3016557). The fitting method compares the observed SED to 200,000 model YSO SEDs consisting of pre-main sequence stars with various combinations of stellar parameters embedded in circumstellar disks with outflow cavities in order to sample a large range of parameter space. To account for any variability of SDSSJ0510 in quiescence, we used 10% minimum uncertainties on all input magnitudes.
| Best-Fit Model (Pre-Outburst) | Range (Pre-Outburst) | During Outburst | |
|---|---|---|---|
| Stellar Age (yr) | — | ||
| Stellar Mass () | 0.15 | — | |
| Stellar Radius () | 1.1 | — | |
| Effective Temperature (K) | 3075 | 4855 | |
| Total Luminosity () | 0.1 | ||
| Accretion Luminosity () | — | 0.2 | |
| Disk Accretion Rate ( yr-1) | |||
| Disk Mass () | — | ||
| Disk Inner Radius (AU) | 0.6 | — | |
| Disk Outer Radius (AU) | 900 | — | |
| Disk Scale Height at 100 AU (AU) | 7 | — | |
| Disk Flaring Power | 1.1 | — |
The properties of SDSSJ0510 before and during outburst are summarized in Table 1. The pre-outburst SED is well-modeled as a class II YSO at a distance of pc. The best-fit model is consistent with a luminosity of , K, and M⊙. In addition to the properties of the best-fit model, we also list the minimum and maximum values for each parameter taken from all models with for all individual data points, as suggested in Robitaille et al. (2007). While most parameters are well-constrained, some are not. For example, the best fitting accretion rate is yr-1, but realistically this should be viewed as an upper limit of yr-1. Similarly, the distribution of inner disk radii is bimodal, at 0.02 and 0.5 AU, and only the latter is consistent with estimates for EX Lupi (Sipos et al., 2009). None of the models are consistent with SDSSJ0510 having an envelope.
Other EXors in outburst have shown additional thermal emission (Lorenzetti et al., 2012; Sicilia-Aguilar et al., 2012). Fitting a blackbody curve to the outburst SED assuming the same extinction as before the outburst ( for the best-fit model), we find that the bluer outburst data are well-fit by a K blackbody curve, slightly higher than the typical range of K K (Lorenzetti et al., 2012). The near-IR outburst data are not well-fit by this blackbody curve, indicating the presence of increased disk emission, but we lack the mid-to-far-IR data needed to fit an additional disk component. Integrating over the blackbody curve gives a lower limit to the total luminosity in outburst of .
Assuming the total luminosity in outburst is equivalent to the accretion luminosity, we estimate the mass accretion rate of ASASSN-13db in outburst using two methods. First, we use the scaling from Natta et al. (2004) based on the width of the H line at 10% of maximum. We measure this width to be 600 km s-1, which gives an accretion rate of yr-1. We also use our estimate of the accretion luminosity combined with the stellar mass, stellar radius, and inner disk radius estimates from the SED fits and the method described in Dahm (2008). This gives a lower limit of yr-1. These two estimates are mutually consistent, and we conclude that yr-1 is a reasonable estimate of the accretion rate during the outburst.
3.2. Light Curve of ASASSN-13db
Figure 2 shows the UV, optical, and near-IR light curves of ASASSN-13db from HJD 2546550 ( week prior to detection) through our latest epoch of observations on HJD 2546695. The ASAS-SN data show SDSSJ0510 brightening by magnitudes, at which point it was flagged by the ASAS-SN detection pipeline. Subsequent follow-up observations show the transient reaching a peak magnitude of and fluctuating by up to magnitude across all observed bands on timescales as short as day. These variation timescales and amplitudes are consistent with other EXor events (e.g., Lorenzetti et al., 2012). SDSSJ0510 showed little variation in NIR colors before and during the outburst, implying the apparent brightening is likely not due a change in circumstellar extinction. During the -month outburst, SDSSJ0510 was consistently magnitudes brighter than in quiescence. The star began to exhibit lower average magnitudes beginning around HJD 2456622, and has faded to on HJD 2456695, indicating the outburst has likely ended.
3.3. Spectral Analysis of ASASSN-13db
The spectral time-sequence of ASASSN-13db is shown in Figure 3. The spectra are completely dominated by a forest of emission lines during the outburst. The lines are mostly neutral metallic lines from Fe I, with some low-ionization lines, including Fe II, Ca II, and Ti II. Figure 3 shows some of the strongest lines identified in the MODS spectrum from 2013 October 31, which include Fe I, H, and the Ca II infrared triplet. In contrast, the latest spectrum shows a strong red continuum and features characteristic of a TTS (M5 spectral type), again indicating the outburst has likely ended. In this spectrum we detect the Å Li I line, but we are unsure whether SDSSJ0510 is in a fully quiescent state.
The emission line dominated spectra of ASASSN-13db are broadly similar to EXors in outburst, but with an unusually rich set of emission lines and little continuum. In Figure 4 we show two small sections ( Å and Å) of MagE spectra obtained at two different epochs separated by 20 days. For comparison, we also show a spectrum of EX Lupi from Sicilia-Aguilar et al. (2012) obtained in June 2008 during its strongest observed outburst (e.g., Kóspál et al., 2008; Aspin et al., 2010). We identify Fe I, Ni I, Fe II, and Ti II lines in emission, which are clearly present in the spectra of both ASASSN-13db and EX Lupi. The metallic lines in the spectra of ASASSN-13db are resolved with km s-1, consistent with the broad components of the metallic emission lines in the spectra of EX Lupi during its 2008 outburst. Our spectra of ASASSN-13db do not have enough resolution to show the narrow-line components observed in some emission lines during the EX Lupi outburst (Herbig, 2007; Sicilia-Aguilar et al., 2012). ASASSN-13db does not show signs of large amplitude ( km s-1) radial velocity variations.

4. Discussion
Pre-outburst photometry and SED fitting indicate that SDSSJ0510 is likely a TTS near the Orion star-forming region at a distance of pc, consistent with its post-outburst spectrum. During the strong outburst from September 2013January 2014, it increased in -band flux by a factor of over 140 and maintained a level of emission magnitudes greater than in quiescence for much of this time. The magnitude of this outburst, its evolution, and its duration are consistent with those of the 2008 outburst of EX Lupi, the prototype of the EXor variable class. In addition to this outburst, SDSSJ0510 also experienced a similar outburst in late-2010/early-2011. As EXors are known to experience recurring events every few years, this also suggests that SDSSJ0510 is an EXor.
Spectroscopy of SDSSJ0510 during outburst also shows similarities to the spectra of other EXors in the literature (e.g., Sicilia-Aguilar et al., 2012; Herbig, 2008; Lorenzetti et al., 2012). In particular, spectra of the source in outburst are dominated by a forest of narrow emission lines at all epochs, primarily Fe I and other low-ionization lines. Comparison with spectra of EX Lupi during its 2008 outburst from Sicilia-Aguilar et al. (2012) shows that the spectra of ASASSN-13db have many of the same emission features as EX Lupi in 2008. However, the spectra of ASASSN-13db also show a number of lines not present in the EX Lupi spectra, indicating possible differences in excitation temperature and/or abundances between the sources. As of late January 2014, the spectrum is that of an M5 TTS star.
The similarities between our observations of ASASSN-13db and EXors in the literature lead us to conclude that SDSSJ0510 likely underwent an EXor accretion event. The magnitude of the change in luminosity and the presence of many unique spectral features, however, are unusual for typical EXor outbursts, and more closely resemble the large 2008 outburst in EX Lupi. If this was an EXor outburst, SDSSJ0510 would appear to be one of the lowest mass TTSs with such an event, and it seems to be experiencing large-scale events on a more rapid timescale than the typical EXor.
References
- Antoniucci et al. (2013) Antoniucci, S., Giannini, T., & Lorenzetti, D. 2013, New A, 23, 98
- Aspin et al. (2010) Aspin, C., Reipurth, B., Herczeg, G. J., & Capak, P. 2010, ApJ, 719, L50
- Bae et al. (2013) Bae, J., Hartmann, L., Zhu, Z., & Gammie, C. 2013, ApJ, 774, 57
- Bochanski et al. (2007) Bochanski, J. J., West, A. A., Hawley, S. L., & Covey, K. R. 2007, AJ, 133, 531
- Breeveld et al. (2010) Breeveld, A. A., Curran, P. A., Hoversten, E. A., et al. 2010, MNRAS, 406, 1687
- Brown et al. (2013) Brown, T. M., Baliber, N., Bianco, F. B., et al. 2013, PASP, 125, 1031
- Burrows et al. (2005) Burrows, D. N., Hill, J. E., Nousek, J. A., et al. 2005, Space Sci. Rev., 120, 165
- Dahm (2008) Dahm, S. E. 2008, AJ, 136, 521
- D’Alessio et al. (1999) D’Alessio, P., Calvet, N., Hartmann, L., Lizano, S., & Cantó, J. 1999, ApJ, 527, 893
- D’Angelo & Spruit (2010) D’Angelo, C. R., & Spruit, H. C. 2010, MNRAS, 406, 1208
- Drake et al. (2009) Drake, A. J., Djorgovski, S. G., Mahabal, A., et al. 2009, ApJ, 696, 870
- Hartmann & Kenyon (1996) Hartmann, L., & Kenyon, S. J. 1996, ARA&A, 34, 207
- Herbig (1977) Herbig, G. H. 1977, ApJ, 217, 693
- Herbig (1989) Herbig, G. H. 1989, in Proc. ESO Workshop on Low Mass Star Formation and Pre-Main Sequence Events, ed. B. Reipurth, Vol. 33 (Garching: ESO), 233
- Herbig (2007) —. 2007, AJ, 133, 2679
- Herbig (2008) —. 2008, AJ, 135, 637
- Herbst et al. (1994) Herbst, W., Herbst, D. K., Grossman, E. J., & Weinstein, D. 1994, AJ, 108, 1906
- Hill et al. (2004) Hill, J. E., Burrows, D. N., Nousek, J. A., et al. 2004, in SPIE Conference Series, Vol. 5165, X-Ray and Gamma-Ray Instrumentation for Astronomy XIII, ed. K. A. Flanagan & O. H. W. Siegmund, 217–231
- Hirota et al. (2007) Hirota, T., Bushimata, T., Choi, Y. K., et al. 2007, PASJ, 59, 897
- Kóspál et al. (2014) Kóspál, Á., Mohler-Fischer, M., Sicilia-Aguilar, A., et al. 2014, A&A, 561, A61
- Kóspál et al. (2008) Kóspál, A., Nemeth, P., Ábrahám, P., et al. 2008, Information Bulletin on Variable Stars, 5819, 1
- Kraft et al. (1991) Kraft, R. P., Burrows, D. N., & Nousek, J. A. 1991, ApJ, 374, 344
- Lorenzetti et al. (2012) Lorenzetti, D., Antoniucci, S., Giannini, T., et al. 2012, ApJ, 749, 188
- Lupton (2005) Lupton, R. 2005, http://www.sdss.org/dr5/algorithms/sdssUBVRITransform.html
- Marshall et al. (2008) Marshall, J. L., Burles, S., Thompson, I. B., et al. 2008, in SPIE Conference Series, Vol. 7014, Ground-based and Airborne Instrumentation for Astronomy II, ed. I. S. McLean & M. M. Casali, 701454
- Martini et al. (2011) Martini, P., Stoll, R., Derwent, M. A., et al. 2011, PASP, 123, 187
- Menten et al. (2007) Menten, K. M., Reid, M. J., Forbrich, J., & Brunthaler, A. 2007, A&A, 474, 515
- Natta et al. (2004) Natta, A., Testi, L., Muzerolle, J., et al. 2004, A&A, 424, 603
- Pogge et al. (2010) Pogge, R. W., Atwood, B., Brewer, D. F., et al. 2010, in SPIE Conference Series, Vol. 7735, Ground-based and Airborne Instrumentation for Astronomy III, ed. I. S. McLean, S. K. Ramsay, & H. Takami, 77350A
- Poole et al. (2008) Poole, T. S., Breeveld, A. A., Page, M. J., et al. 2008, MNRAS, 383, 627
- Robitaille et al. (2007) Robitaille, T. P., Whitney, B. A., Indebetouw, R., & Wood, K. 2007, ApJS, 169, 328
- Roming et al. (2005) Roming, P. W. A., Kennedy, T. E., Mason, K. O., et al. 2005, Space Sci. Rev., 120, 95
- Sandstrom et al. (2007) Sandstrom, K. M., Peek, J. E. G., Bower, G. C., Bolatto, A. D., & Plambeck, R. L. 2007, ApJ, 667, 1161
- Shappee et al. (2013) Shappee, B. J., Prieto, J. L., Grupe, D., et al. 2013, ArXiv e-prints, arXiv:1310.2241
- Sicilia-Aguilar et al. (2012) Sicilia-Aguilar, A., Kóspál, Á., Setiawan, J., et al. 2012, A&A, 544, A93
- Sipos et al. (2009) Sipos, N., Ábrahám, P., Acosta-Pulido, J., et al. 2009, A&A, 507, 881
- Skrutskie et al. (2006) Skrutskie, M. F., Cutri, R. M., Stiening, R., et al. 2006, AJ, 131, 1163
- Vorobyov & Basu (2005) Vorobyov, E. I., & Basu, S. 2005, ApJ, 633, L137
- Wright et al. (2010) Wright, E. L., Eisenhardt, P. R. M., Mainzer, A. K., et al. 2010, AJ, 140, 1868
- York et al. (2000) York, D. G., Adelman, J., Anderson, Jr., J. E., et al. 2000, AJ, 120, 1579