Galaxy Zoo: an independent look at the evolution of the bar fraction over the last eight billion years from HST-COSMOS††thanks: This publication has been made possible by the participation of more than 85,000 volunteers in the Galaxy Zoo project. Their contributions are individually acknowledged at http://authors.galaxyzoo.org/ .
Abstract
We measure the redshift evolution of the bar fraction in a sample of 2380 visually selected disc galaxies found in Cosmic Evolution Survey (COSMOS) Hubble Space Telescope (HST) images. The visual classifications used both to identify the disc sample and to indicate the presence of stellar bars were provided by citizen scientists via the Galaxy Zoo: Hubble (GZH) project. We find that the overall bar fraction decreases by a factor of 2, from % at ( Gyr) to % at ( Gyr), consistent with previous analysis. We show that this decrease, of the strong bar fraction in a volume limited sample of massive disc galaxies [stellar mass limit of ], cannot be due to redshift-dependent biases hiding either bars or disc galaxies at higher redshifts. Splitting our sample into three bins of mass we find that the decrease in bar fraction is most prominent in the highest mass bin, while the lower mass discs in our sample show a more modest evolution. We also include a sample of 98 red disc galaxies. These galaxies have a high bar fraction (), and are missing from other COSMOS samples which used SED fitting or colours to identify high redshift discs. Our results are consistent with a picture in which the evolution of massive disc galaxies begins to be affected by slow (secular) internal process at . We discuss possible connections of the decrease in bar fraction to the redshift, including the growth of stable disc galaxies, mass evolution of the gas content in disc galaxies, as well as the mass-dependent effects of tidal interactions.
keywords:
galaxies: evolution – galaxies: spiral – galaxies: structure1 Introduction
A variety of physical processes act to change the morphologies of galaxies over their lifetimes, from being hot, clumpy and flocculent in the high-redshift Universe (Elmegreen et al., 2009), to dynamically cool, disc-dominated spiral galaxies (Weiner et al., 2006; Kassin et al., 2007; Sheth et al., 2012) and, in some cases, to lenticular or elliptical galaxies in the local Universe. These processes are either external or internal to the galaxy in question. External processes are dominated by dramatic, dynamically fast processes, such as galaxy-galaxy interactions. Mergers, both major and minor, rapidly change the morphology of a galaxy, with this violent phase of galaxy evolution being dominant at higher redshifts (e.g. Abraham 1999; Ryan et al. 2008; Lin et al. 2008; Kartaltepe et al. 2010; Lotz et al. 2011). As the Universe expands and the galaxy population becomes more mature, major mergers become rare in all but the densest parts of the Universe. The major merger rate is also dependent on the stellar masses of the galaxies involved (e.g. Conselice et al. 2003; Conselice et al. 2008). For example, the last major merger for our Milky Way, a relatively massive disc galaxy, was believed to have been 10-12 Gyr ago (Wyse, 2001; Gilmore et al., 2002).
In this era, slower and often internally driven processes become more important to the evolution of galaxies. These processes are often dependent on the host galaxy’s properties, e.g. the shape of its dark matter halo, its stellar mass or its gas content (see Sellwood 2013 and references therein for examples). This calmer period of evolution affects the evolution of massive, well formed disc galaxies in the local Universe and is often referred to as the secular epoch’. In this paper we focus on studying the cosmic evolution of one of the major drivers of secular evolution in disc galaxies: the formation and evolution of barred stellar structures since .
Bars form naturally in dynamically cool disc galaxies, stabilizing stellar orbits by allowing gas to dissipate energy and fall inwards towards the galactic centre, while the angular momentum is redistributed to both the stellar and dark matter halo (e.g. Athanassoula 2005, 2012; Combes 2009). This is one of many influences a bar has on its host galaxy, and determining which other morphological and physical properties are directly affected by the presence of a bar is of significant interest to the understanding of how galaxy populations are evolving in the secular epoch.
Theoretical understanding of the impact of bar formation on galactic discs, along with observational studies, suggests that the possible evolutionary effects of bars include: (i) the formation of a pseudo-bulge at the galaxy’s centre (Pfenniger & Norman, 1990; Kormendy & Kennicutt, 2004; Combes, 2009; Athanassoula, 2012), (ii) the fuelling of star formation at the galaxy’s centre (Sérsic & Pastoriza, 1965; Hawarden et al., 1986; Ho et al., 1997; Martinet & Friedli, 1997; Sakamoto et al., 1999; Sheth et al., 2005; Ellison et al., 2011), (iii) possible feeding of a central active galactic nucleus (Knapen et al., 2000; Coelho & Gadotti, 2011; Oh et al., 2012; Alonso et al., 2013), although no correlation between active galactic nuclei activity and bar fraction has been observed so far (Mulchaey & Regan, 1997; Regan & Mulchaey, 1999; Cisternas et al., 2013); (iv) a possible role in the cessation of star formation, thereby moving the galaxy on to the red sequence (Masters et al., 2010, 2012; Saintonge et al., 2012; Wang et al., 2012; Cheung et al., 2013). The overall conclusion from these, and other works, is that bars do play an important role in the evolution of disc galaxies in the local Universe (although for an opposing view see van den Bergh 2011 and references therein).
Many observations have been made to determine the quantity of stellar bars in our local Universe (). The abundance of bars can be quantified as the bar fraction (), which is simply found by calculating what fraction of disc galaxies in a sample possess a barred structure. In the local Universe, observed bar fractions range from to depending on several selection effects: (i) bar classification method, (ii) the strength of the bars observed, (iii) which wave-bands they are observed in. The selection of discs can also affect the outcome, with the denominator of the bar fraction being dependent on whether S0s, S0/as or Sdms are included as disc galaxies.
The high resolution of the Hubble Space Telescope (HST) allowed astronomers to begin exploring the bar fraction at higher redshifts. Small samples of disc galaxies from early HST observations found conflicting results as to how the bar fraction evolved towards higher redshifts. Abraham et al. (1999) found a decreasing bar fraction towards higher redshifts, while Elmegreen et al. (2004) and Jogee et al. (2004) observed a constant bar fraction up . Sheth et al. (2003); Sheth et al. (2004) also observed a constant bar fraction towards higher redshifts, but this was for only the largest bars, due to the coarse resolution of the NICMOS camera. Using a sample of disc galaxies an order of magnitude larger () than any previous study, Sheth et al. (2008) [hereafter S08] presented a result where the bar fraction declined towards higher redshifts (across the range ). This result has since been replicated by Cameron et al. (2010), who explored the trend using a sample of disc galaxies across the redshift range . It is also worth noting that, in light of these more recent works, the trends presented by Elmegreen et al. (2004) and Jogee et al. (2004) can also be interpreted as a declining bar fraction towards higher redshifts.
Understanding whether the bar fraction evolves across cosmic time-scales is important. Typically, bars tend to form in galaxies which have become relaxed, cool and disc dominated, although it is worth noting that some bars may also be formed by galaxy-galaxy interactions (Barnes & Hernquist, 1991; Cox et al., 2008; Hopkins et al., 2009). Although these interactions can also destroy bars, they are typically long lived features, and so the presence of a barred structure can be used as a tracer for when disc galaxies become dynamically stable and mature’. Once a disc galaxy reaches this dynamically relaxed state, in the absence of external influences, secular processes begin to dominate its evolution.
Here, we complement and expand on the work of S08, with our observations exploring the redshift evolution of the bar fraction over a wider range of redshifts, and extending to higher redshifts (), as well as exploring its dependence on stellar mass []. As in both S08 and Cameron et al. (2010), we base our study on images taken as part of the Cosmic Evolution Survey (COSMOS; Scoville et al. 2007b); however we use a different sample selection and bar identification method (see Section 2 for more details). We combine photometric and spectroscopic data from COSMOS with visual morphological classifications from the third incarnation of the Galaxy Zoo project111www.galaxyzoo.org, namely the Galaxy Zoo: Hubble (GZH)222hubble.galaxyzoo.org project, producing a catalogue of 2380 disc galaxies (317 barred). Using these visual classifications allows us to include a sample of quiescent disc galaxies in our work.
In Section 2 we describe the selection criteria used to produce our disc galaxy sample, including how GZH classifications are used. In Section 3 we explore potential biases in our sample. We present our results in Section 4, followed by a discussion in Section 5. Finally, we finish with our summary and conclusions in Section 6. Throughout this paper we use the AB magnitude system, and where necessary we adopt the following cosmology; Mpc-1, and (Bennett et al., 2013).
2 Data & sample
2.1 COSMOS
We provide a brief summary of the observational photometric and spectroscopic data obtained by COSMOS and the selection criteria we apply. A more detailed discussion of COSMOS and the HST imaging can be found in Scoville et al. (2007a, b).
The COSMOS survey observed galaxies using the HST Advanced Camera for Surveys (ACS) F814W (I-band) filter over a 2 deg2 equatorial field. With its excellent spatial resolution (0.05 arcsec/pixel), the ACS is able to observe structures with radii smaller than 1 kpc up to redshifts of . This resolution is ideal for detecting galactic bars, whose typical lengths in the local Universe are in excess of 2 kpc (Elmegreen & Elmegreen, 1985; Barazza et al., 2008; Aguerri et al., 2009; Hoyle et al., 2011) (also see Menéndez-Delmestre et al. 2007; Sheth et al. 2003 and section 2 of S08 for an alternative discussion of bar resolution using the ACS). Initial ACS observations were followed up with observations from a wide range of telescopes, which provided additional data across 16-30 different wave-bands for each galaxy (Scoville et al., 2007b; Capak et al., 2007; Ilbert et al., 2009).
In addition to the imaging, a follow-up spectroscopic survey (zCOSMOS; Lilly et al. 2007, 2009) provided spectroscopic redshifts for a fraction of galaxies detected in COSMOS (12% of Galaxy Zoo COSMOS galaxies are included). The remaining galaxies have photometric redshifts taken from Ilbert et al. (2009). For detailed discussions of the spectroscopic and photometric redshifts used in this paper, see Lilly et al. (2007) and Ilbert et al. (2009) respectively, while Griffith et al. (2012) provide a useful summary of this information for the COSMOS galaxies used in GZH (see section 2.3.2 of Griffith et al. 2012).
We apply the redshift range to our COSMOS galaxies. The lower limit is chosen so that the HST imaging resolves structures of similar size to those observed in the Sloan Digital Sky Survey (SDSS) Main Galaxy Sample (Strauss et al., 2002) at (see Section 2.3). We note that SDSS imaging can resolve structures on scales of 2.2 kpc at (approximately the mid-redshift point of the low-redshift sample; see Section 2.3), while the ACS minimum resolution ranges from 1.3 kpc at to 2 kpc at . Therefore, despite large differences in angular resolutions, the surveys are well matched in physical resolution and are able to observe all large-scale barred structures in their respective redshift ranges.
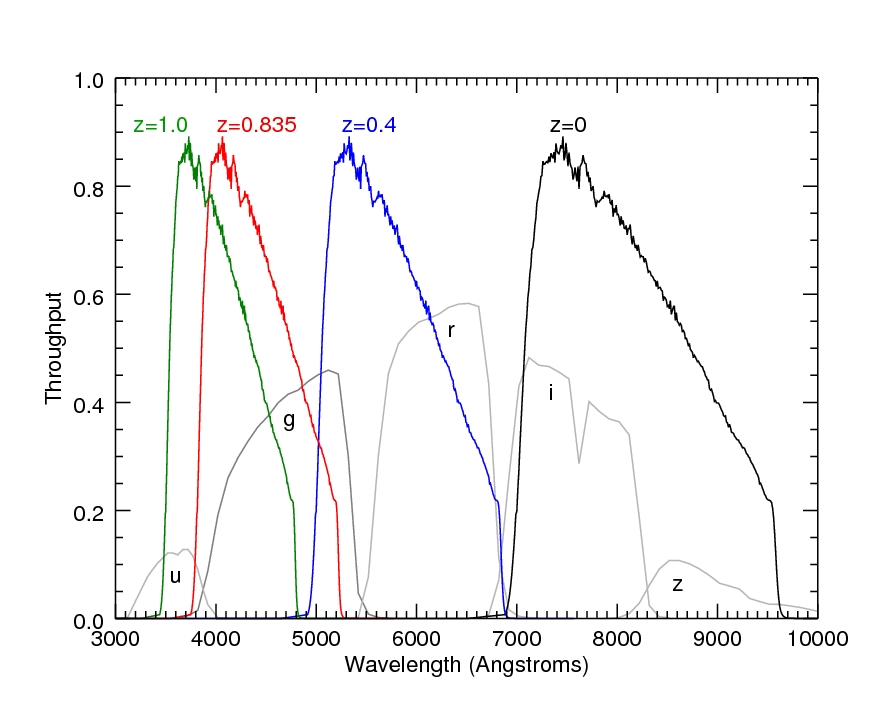
The upper redshift limit is set not by the constraints of resolution, but by band shifting. Figure 1 highlights this effect on the ACS F814W filter, showing it shifting bluewards across the rest-frame SDSS filters as the redshift increases. Identification of bars in the bluest and/or UV wavelengths is known to be hampered by the effects of clumpy star formation hiding the smooth bar structure, with bars also becoming dimmer in these bands due to being dominated by older stellar populations. S08 demonstrated this effect, showing a reduction in bar identification in the SDSS -band filter relative to the filters (see their Figure 7 in Appendix A1; this was especially a problem when using an ellipse fitting method to identify bars). In this study we do begin to probe the rest-frame -band, but even at our highest redshift (), of the light gathered in the F814W band is above the break (bars become difficult to detect bluewards of this break). Therefore, despite partly probing the rest-frame -band, we are still predominantly probing the rest-frame -band, where there is no depreciation in bar detection. We expect to detect all strong bars that are present within the full redshift range we explore (), but if we exclude galaxies at , our main conclusions are unaffected.
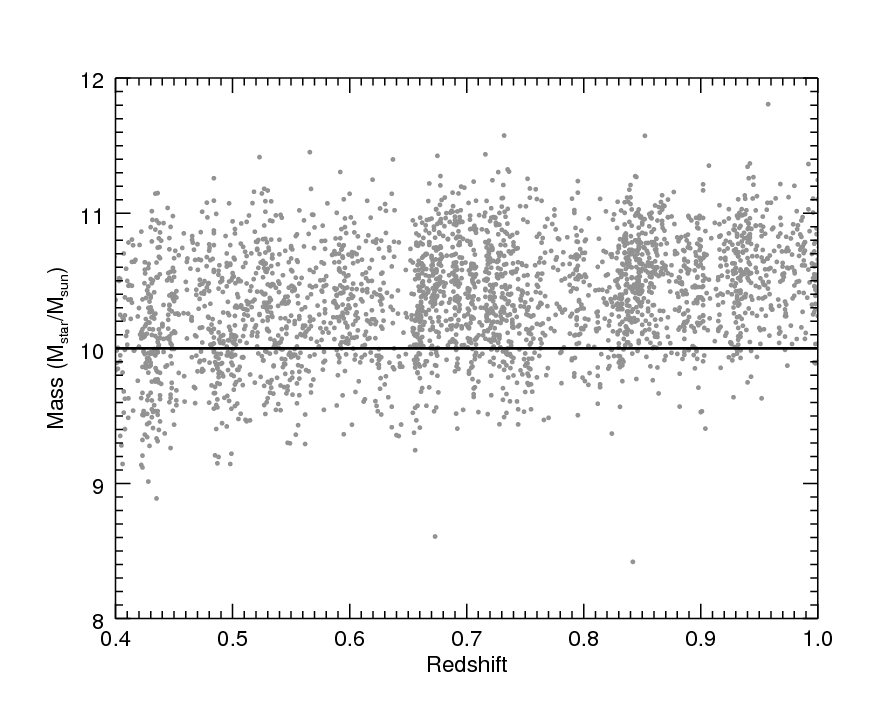
In addition, we apply the following stellar mass limit to our data: , as shown in Figure 2. Although we apply the same mass limit at all redshifts, this is consistent with exploring disc galaxies from the same area of the stellar mass function distribution at all redshifts, as does not evolve significantly across the redshifts we explore (Bundy et al., 2006; Ilbert et al., 2010, 2013). The stellar mass estimates used here are taken from Mobasher et al. (2007), with an expected error less than 0.5 dex (see section 6.1 of Mobasher et al. 2007 for details of the stellar masses used in this paper). We also note that these stellar masses are the same as those used in S08. The mass limit is applied so that the low-mass galaxies explored are detectable across the whole redshift range.
2.2 Galaxy Zoo: Hubble
Running from 2010 April 23 until 2012 September 10, Galaxy Zoo: Hubble (hereafter GZH) was the third incarnation of the Galaxy Zoo project (GZ), and the first to show images from the HST. During this time, GZH attracted 86,520 individual volunteers who in turn provided 40,631,068 individual clicks.
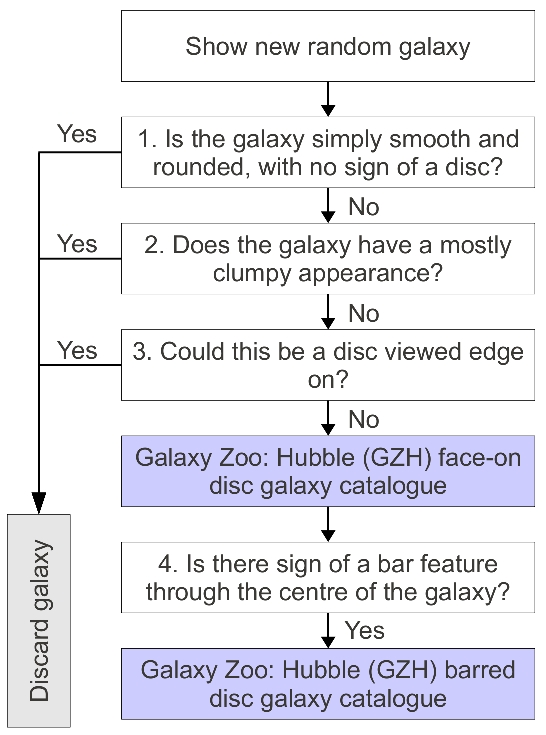
To classify a galaxy, a volunteer is first shown a randomly selected image of a galaxy and is asked; (1) is the galaxy simply smooth and rounded with no sign of a disc? Their answer to this question determines any further questions they are asked about each galaxy, with the GZH decision tree used in this work being an updated version of the decision tree used in Galaxy Zoo 2 (Willett et al. 2013, hereafter W13). We show an edited version of the GZH decision tree,333The full GZH decision tree can be seen at http://data.galaxyzoo.org/GZH/images/GZ_HST.jpg. in Figure 3, which shows that a volunteer who answers no’ to questions 1-3 (as numbered in Figure 3) classifies a galaxy as being a face-on disc galaxy. Furthermore, a volunteer who answers question 4 with yes’ classifies said galaxy as barred.
As each galaxy is viewed by many volunteers (the minimum number of volunteers that classify a galaxy is 33, with the median number of volunteers being 47), the clicks provided by each volunteer are combined with those made by other volunteers to produce morphological classifications for each galaxy which are represented by vote fractions’, i.e. the fraction of volunteers answering a given question positively. These vote fractions, or estimated likelihoods (), are constructed via a weighting scheme where volunteers whose individual classifications tend to disagree with the majority are downweighted. This weighting rewards consistency and removes outliers. An in-depth discussion of the original GZ project, including how volunteers’ classifications are weighted and combined, is provided in Lintott et al. (2008), the appendix of Bamford et al. (2009) and Lintott et al. (2011). This method was repeated for GZ2 in W13, with similar methods applied to the GZH classifications.
To determine whether a galaxy is a face-on disc, we apply a minimum threshold of for questions 1-3 (Figure 3). In explicit terms, we require the following: ; ; . The threshold chosen () for each of the questions posed is a compromise between the sample size and its purity. A higher threshold (say ) would offer a purer but smaller sample. Conversely, a lower threshold (say ) would increase the sample size, but at the expense of including more uncertain classifications. In addition to our threshold criteria, we apply an inclination cut similar to those used in other studies of bars []444Semi-major and semi-minor axis are measured using SExtractor and are taken from the COSMOS 2005 morphology catalog - http://irsa.ipac.caltech.edu/data/COSMOS/datasets.html, as well as removing any galaxies that are obviously merging ( with a minimum of 18 volunteers answering the Is there anything odd? question). This produces the final sample size of 2380 face-on disc galaxies. Hereafter, our face-on disc sample is referred to as our “GZH sample”.
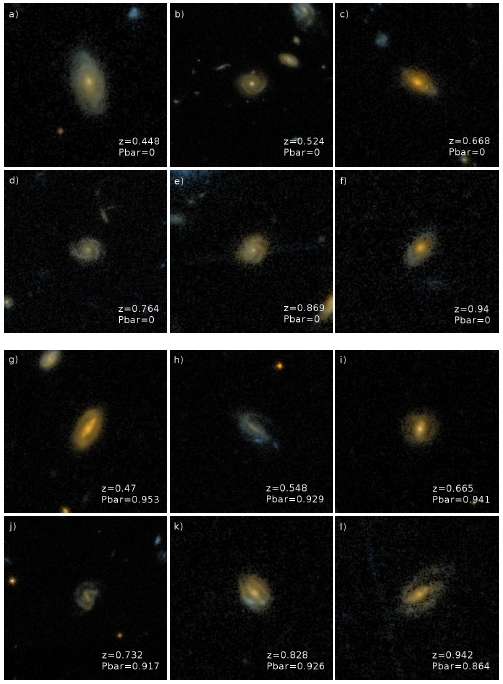
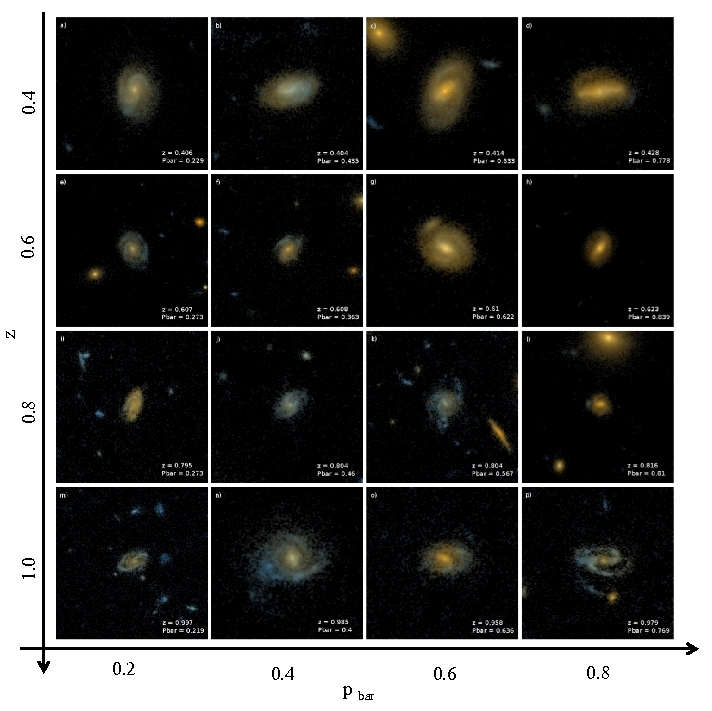
Finally, to classify a GZH disc galaxy as barred, we apply the same threshold used in questions 1-3 to question 4; , with a median of 29 volunteers having answered question 4. This criterion gives a sample of 317 barred disc galaxies (% for whole sample), which will be referred to as our barred GZH sample’ herein. A selection of images of the GZH and barred GZH samples are shown in Figure 4555Images of the full sample are available at http://data.galaxyzoo.org/.. We explore the effects of using different thresholds in Appendix A.1, finding that they vary the absolute value of the bar fraction at all redshifts, but do not significantly change the trends we observe. Additionally, when exploring lower thresholds for , the trend we observe remains robust.
2.3 Local comparison sample
We make use of a low-redshift sample of disc galaxies as a comparison set for our GZH sample. We use classifications from Galaxy Zoo 2 (GZ2)666http://zoo2.galaxyzoo.org/ (W13), specifically the GZ2 disc sample, which was used to explore trends of the bar fraction with galaxy properties in our local Universe (Masters et al., 2011, 2012) [hereafter M12]. Here, we use the revised sample from M12, which was based on the final GZ2 classifications. We briefly discuss how this sample was compiled; a more detailed description can be found in Masters et al. (2011) and M12.
The GZ2 disc galaxy catalogue is based on bright () galaxies from the SDSS Main Galaxy Sample (Strauss et al., 2002). These were used in the second GZ phase that ran from 2009 to 2010. A volume limit (; ) was applied, as well as an inclination cut (). Each of these galaxies was visually classified in GZ2, with a median number of 45 independent classifiers for each galaxy. The decision tree used in GZ2 to determine the disc galaxy sample is similar to that used for the GZH sample, with the main difference relevant to this study being the omission of the question: does the galaxy have a mostly clumpy appearance?’. M12 applied a threshold of for each question to define the face-on disc and barred disc galaxies. This produced a final sample of 15,292 disc galaxies (GZ2 sample hereafter), with an overall bar fraction of %.
M12 compared the GZ2 classifications with those from Nair & Abraham (2010). Using a cross-matched sample of 3,638 disc galaxies, M12 conclude that disc galaxies with a (as used in Masters et al. 2011, and M12) corresponded to strong bar classifications made by Nair & Abraham (2010). M12 also found reasonable agreements with strong bar classifications made by de Vaucouleurs et al. (1991) and Barazza et al. (2008). Similarly, when comparing GZ2 bar classifications with those made by the Extractions de Formes Idéalisées de Galaxies en Imageriem (EFIGI) group (Baillard et al., 2011), W13 conclude that GZ2 classifications are excellent for identifying strong bars in disc galaxies, but may miss shorter bars.
We use these comparisons, along with the fact that the physical resolution of the HST and SDSS images are comparable within their respective redshift ranges, to argue that our selection of from GZH classifications may be interpreted as an identification of a strong bar in the observed galaxy. Here we describe a strong bar as being one which is easily identifiable in its host galaxy.
Here, we carefully review the make-up of our GZH and GZ2 disc samples to avoid confusion with comparisons with other disc, spiral or late-type selections based on GZ morphologies. The disc galaxy selections presented herein possibly include a fraction of early-type disc galaxies (Sa or S0), which would normally be included in a majority of early-type samples selected by either colour, or central concentration. This results in our diverse disc galaxy samples showing bimodality in their optical colour magnitude. However, other GZ samples which were more focused on late-type discs or spiral galaxies (Sb, Sc or later) can be constructed using the Galaxy Zoo 1 clean’ spiral criterion, as first discussed in Land et al. (2008), and most recently used in Schawinski et al. (submitted). This can also be achieved by applying stricter limits in GZ2/GZH data. This more conservative late-type sample will be more dominated by blue cloud’ spirals and thus show less bimodality of their galaxy properties.
2.4 Stellar mass subsamples
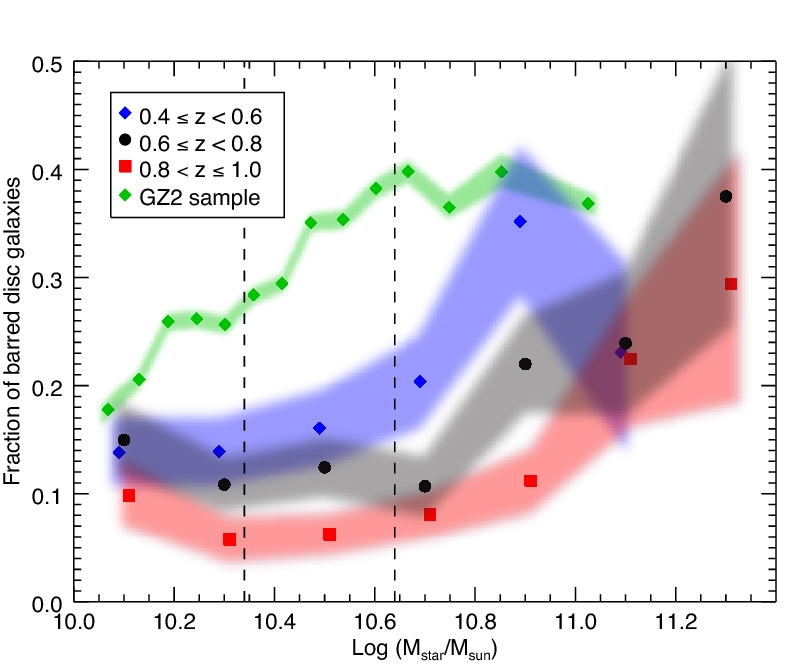
It is now understood that the bar fraction in disc galaxies depends on the stellar mass distribution of the sample (e.g. Nair & Abraham 2010). Figure 5 shows the dependence of bar fraction on stellar mass for our GZH sample across three redshift bins: (blue); (black); (red). We also include data from the GZ2 sample (green). In each of the GZH redshift bins we observe increasing bar fractions towards higher stellar masses, with this trend also seen in the GZ2 sample.
We split the GZH (and GZ2) sample into three stellar mass subsamples, each containing approximately the same number of galaxies. These mass cuts are shown as vertical dashed lines in Figure 5. In detail, the subsamples are:
-
1. Low mass:
Galaxies having stellar masses, . For the GZH sample this contains 789 disc galaxies (3782 in the GZ2 sample).
- 2. Intermediate mass:
-
3. High mass:
Galaxies with masses . In the local Universe disc galaxies with these masses are significantly more likely to be found on the red sequence (e.g. Masters et al. 2010). For the GZH sample this contains 790 disc galaxies (2995 in the GZ2 sample).
We note that at typical star formation rates (SFR) of 1-2 yr (at ) a disc galaxy could gain extra stellar mass totalling up to over the 8 Gyr from to . This could move some of the lowest mass galaxies at into the intermediate-mass bin by , as well as moving some of the intermediate-mass galaxies into the high-mass bin by . However, this mass growth will have a negligible effect on the high-mass galaxies.
3 Redshift-dependent biases
To ensure that any conclusions based on our sample are reliable, we must first explore any potential redshift-dependent biases that may affect our results. Our final result is based on the trends of bar fraction in the sample of disc galaxies, so we must determine whether we can detect bars in all galaxies across the whole redshift range, particularly for galaxies with smaller radii (addressing the numerator in our bar fraction measurement). We must also explore whether surface brightness dimming affects a GZH volunteer’s ability to classify a galaxy as disc-like, especially towards higher redshifts (i.e. the denominator of the bar fraction measurement).
As our work and that of S08 both use the same imaging data, we point the reader to the extensive discussion by S08 of the impact of selection effects (their appendices A1-A4). Much of the discussion in these appendices is directly applicable to this work, with the exception of A2. This section explores the possible inclusion of objects with peculiar morphology affecting the bar fraction when using ellipticity and position angle information to determine morphological classifications, which is not relevant for our sample of visually selected disc galaxies. We note that the effects of band shifting across this redshift range have already been discussed in Section 2.1.
3.1 Spatial resolution
As the ACS is capable of resolving all structures larger than 2 kpc across our specified redshift range (see Section 2.1), we are confident that all large-scale bars should be detectable in our GZH sample. In the local Universe, bars smaller than 2 kpc in massive disc galaxies are classified as nuclear bars (Erwin, 2004), which are not the bars we are concerned with in this study. Additionally, in their appendix A4, S08 find there is little change in the median disc scale length for their sample of disc galaxies up to (also see Ravindranath et al. 2004; Barden et al. 2005; Sargent et al. 2007). They conclude the lack of change in the size of disc galaxies over this redshift range should therefore mean that the sizes of bars will also remain unchanged.
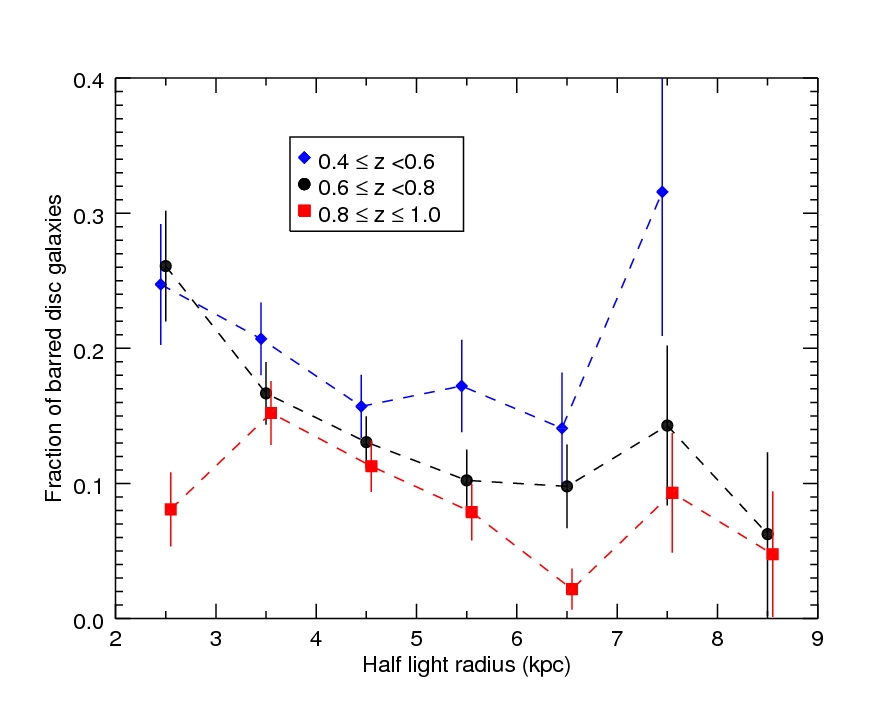
Following S08 (A4), we explore the effects of resolution further by examining how the bar fraction of GZH sample depends on disc galaxy size (Figure 6, top) in three redshift bins (; ; ). If bars were missing in smaller galaxies due to problems with resolution, we should observe this effect in a trend of decreasing for the smallest galaxies, and specifically this should be largest in the highest redshift bin. In fact, the data show that for the low- and intermediate-redshift bins we see a declining bar fraction towards larger disc galaxies, while the high-redshift bin shows little change in the bar fraction across all galaxy sizes.
Finally, we also explored the redshift evolution of the bar fraction in three angular size bins, finding that our overall result (see Section 4.1) is observed in all three bins.
We conclude that the effects of resolution do not cause large-scale bars to be lost in any size of galaxy. Therefore, an inability to detect and classify bars does not bias our final results.
3.2 Surface brightness
Surface brightness dimming has the potential to have a significant impact as it evolves strongly with redshift. It may cause disc galaxies to be missing from the sample entirely, or to be misclassified either as smooth’ galaxies (in the language of GZH), or potentially in the case of barred galaxies as inclined discs (if the outer disc fades leaving only the bar visible).
S08 (see their A3) investigate the ability of COSMOS imaging to trace the outer discs of galaxies as a function of redshift in an attempt to quantify this effect. Their Figure 10 demonstrates that COSMOS imaging is sufficiently able to detect the outer parts of typical disc galaxies out to .
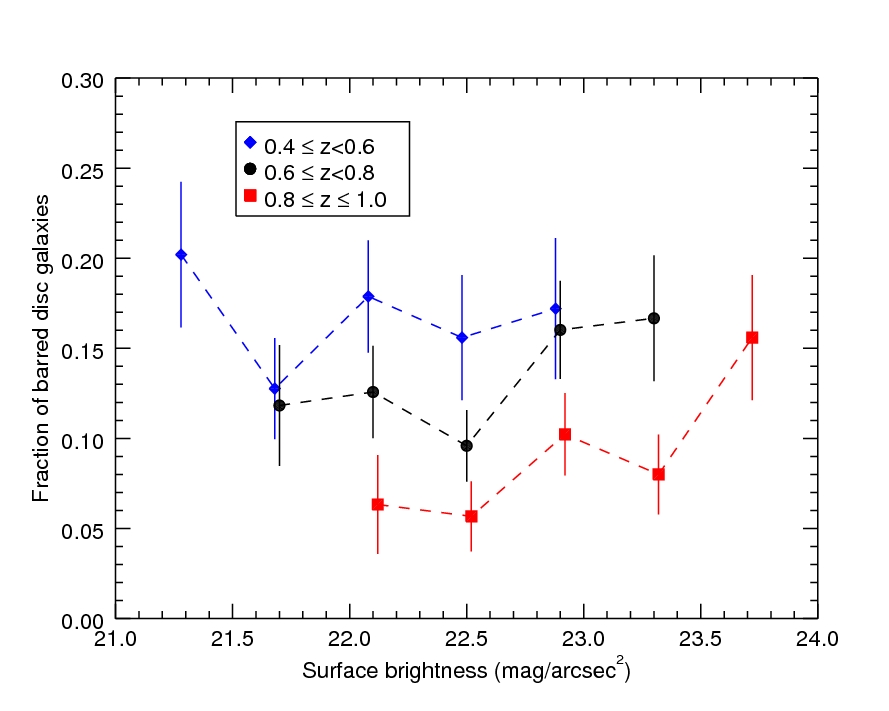
In addition, they suggest an empirical test to see how the bar fraction depends on surface brightness. This is done by comparing the bar fraction as a function of the observed surface brightness of the discs in three redshift bins (the same bins used in Section 3.1). Any impact of surface brightness dimming on the bar fraction would be revealed by a correlation of bar fraction with surface brightness, and specifically should be largest in the highest redshift bin. We observe no correlation of the bar fraction with surface brightnesses for each of the redshift bins when conducting this test using our GZH disk sample (Figure 6, bottom). This observed constant bar fraction with surface brightness demonstrates that bars/discs are equally detectable in the dimmest galaxies to the brightest disc galaxies.
We conclude that surface brightness dimming does not bias our final results.
4 Results
4.1 Redshift evolution of the bar fraction
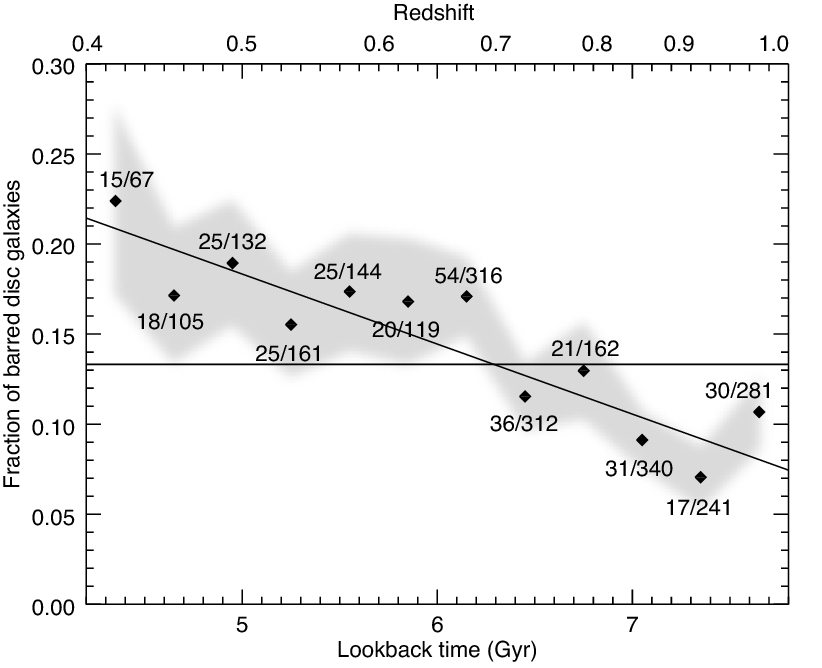
We explore the trend of the bar fraction, , across Gyr of cosmic history, from a lookback time of Gyr (at ) to Gyr (). The redshift evolution of the bar fraction is observed in Figure 7, where the fraction of barred galaxies decreases from 5% at Gyr () to 2% at Gyr (). We show that a linear relationship (bold line) offers a good fit to our observations, with this relationship given in Table 1.
Our GZH disc sample is split into equal time bins, with the bar fraction calculated for each 0.3 Gyr interval, which approximately corresponds to redshift bins of . Although this is fine binning for the use of photometric redshifts, it is appropriate, as the photometric redshifts of our galaxies are accurate to up to (Ilbert et al., 2009). Each point is labelled with the number of barred disc galaxies () over the total number of disc galaxies () observed within the given bin. We show 1 errors for each point (grey), with the errors calculated as follows;
Our result is consistent with that of S08, whose observed strong bar fraction decreased from % to % across the redshift range they explored (). See Section 5.1.1 for more details on the comparison between our results and those of S08. We are also consistent with the observations of Jogee et al. (2004) and Cameron et al. (2010).
4.2 Galaxy mass-dependent redshift evolution of the bar fraction
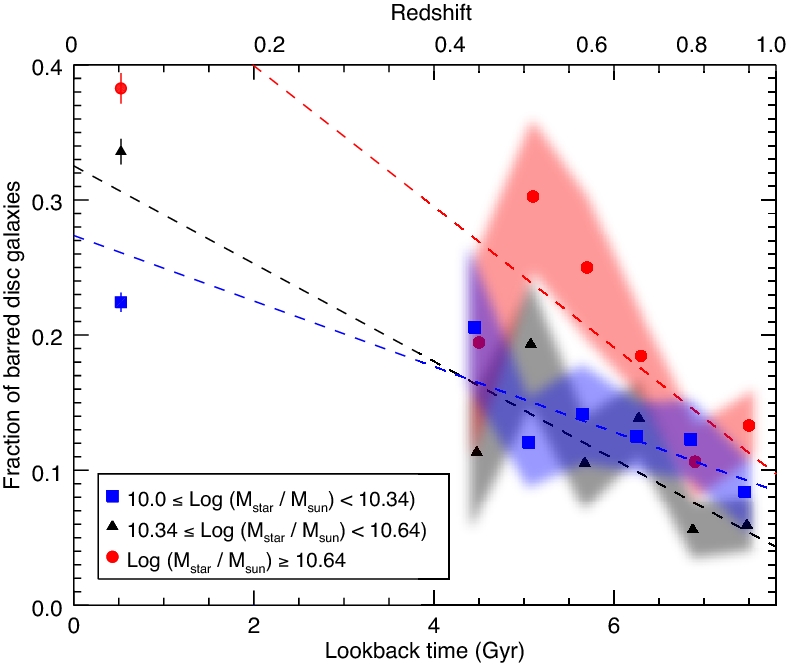
We split the GZH disc sample into three seperate mass bins (as described in Section 2.4), enabling us to explore the mass dependence of the evolving bar fraction with time. These observations are shown in Figure 8, with the low-redshift GZ2 data also shown in equivalent mass bins. The GZH disc sample is split into 0.6 Gyr bins (which span Gyr), with the GZ2 data representing a bin of 0.57 Gyr ( Gyr, or ).
We find that the increase in bar fraction over cosmic time is driven by the most massive galaxies. Specifically we observe the following.
-
1. Low-mass subsample:
we observe a slow evolution of the bar fraction within the 1 errors shown in Figure 8, with the bar fraction decreasing by a factor of 2.2 over 4.2 Gyr, from 5% at Gyr to % at Gyr. Extending this to the local Universe GZ2 sample, we see that the bar fraction () has only increased slightly since . The shallow decrease in bar fraction towards higher redshifts for the GZH low-mass discs is illustrated by a linear fit shown in Figure 8 (blue dashed line), with the parameters of this fit given in Table 1. We also show in Table 1 the linear equation when the GZ2 data point is included, which gives a shallower evolution of the bar fraction for these galaxies over the 8 Gyr explored.
-
2. Intermediate-mass subsample:
the bar fraction almost halves from % at Gyr to % at Gyr. Extending this to the GZ2 sample, we find that the bar fraction is higher (%) than at in the GZH sample. Overall, the bar fraction for intermediate galaxies decreases by around a factor of 5 across the full 8 Gyr. We fit a linear trend to this subsample (dashed black line in Figure 8), with the equation shown in Table 1.
-
3. High-mass subsample:
we observe a decrease in the bar fraction with redshift, from % at to % at . Extending this to the GZ2 sample, the bar fraction has increased to % at . Over the full 8 Gyr, the bar fraction has increased by a factor of 3. A linear fit for our high-mass sample (red dashed line on Figure 8), is given in Table 1.
| Sample (GZH data only) | ||
|---|---|---|
| GZH (Fig. 7) | ||
| Low mass | ||
| Intermediate mass | ||
| High mass |
| Sample (GZH + GZ2 data) | ||
|---|---|---|
| Low mass | ||
| Intermediate mass | ||
| High mass |
5 Discussion
Our visually classified GZH disc sample shows a decreasing bar fraction with increasing redshift. More specifically, the bar fraction decreases from % down to % across the 3.6 Gyr () explored (Figure 7). When splitting the GZH disc sample into three subsamples by galaxy mass (Figure 8), we find that the low-mass and intermediate-mass galaxies have slowly increasing bar fractions towards lower redshifts, while the high-mass galaxies have a much steeper increase in bar fraction towards lower redshifts. When extending our results into the local Universe () using the GZ2 disc sample, we find that all trends continue in a similar manner.
In this section we compare our results with other works, both observational and theoretical, which have also explored the redshift evolution of the bar fraction. We follow this by providing an interpretation of our result.
5.1 Comparison with other work
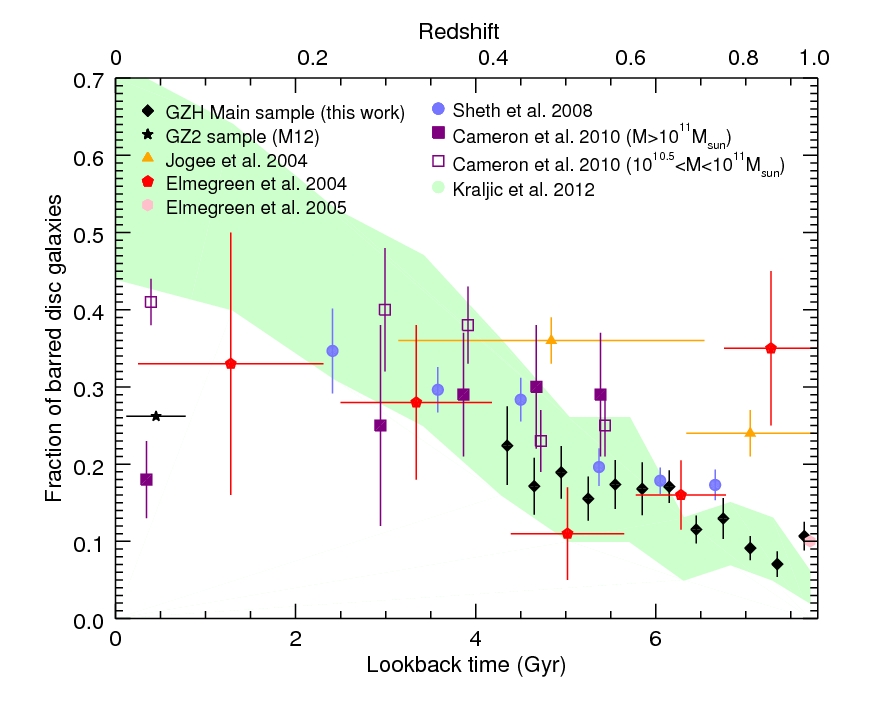
The literature regarding bar fraction measurements at both high and low redshifts is extensive (see Sellwood 2013 for a recent review). Figure 9 shows the redshift evolution for our results (black), including the GZ2 bar fraction (as published in M12). In addition to these, we show several other high-redshift studies; Elmegreen et al. (2004) - red; Jogee et al. (2004) - orange; Elmegreen et al. (2005) - pink; S08 - blue; Cameron et al. (2010) - purple. We also include a theoretical prediction of the expected bar fraction evolution based on the re-simulation of discs embedded in a cosmological simulation (Kraljic et al. 2012; green). Here, we will not attempt to make a comprehensive comparison of our results to all the studies shown in Figure 9, although it is clear that our observations of a decreasing bar fraction with increasing redshift agree with the picture built by the combination of these results. Instead, we will compare our results with two particularly relevant studies: S08, whose disc sample is the largest used to explore the redshift evolution of the bar fraction, and the simulated predictions of Kraljic et al. (2012).
5.1.1 Comparison with S08
Following the results of Elmegreen et al. (2004) and Jogee et al. (2004), who concluded that the bar fraction did not evolve with redshift, S08 explored the evolving bar fraction with a carefully selected disc galaxy sample. Their sample was an order of magnitude larger than these previous studies (), and showed a declining bar fraction with increasing redshift. Our GZH results agree well with S08, although in revisiting their work, we attempt to extend the redshift space explored by allowing for classifications up to .
While the results of S08 and our own are both from the same survey (COSMOS), the processes we use to select our visually classified GZH disc and barred disc samples differ to the selection criteria used by S08. We discuss the selection processes used to determine our GZH disc sample in Section 2.2.
To produce their disc galaxy sample, S08 used spectral energy distribution (SED) classifications based on a match to published templates (see Mobasher et al. 2007 for details). These classifications range from to , where corresponds to elliptical galaxy, 2=Sbc, 3=Scd, 4=Irr (from Coleman et al. 1980), and types 5 and 6 are starburst models (from Kinney et al. 1996). S08 include only galaxies with 777This differs from the published selection () due to a typographical error in publication (K. Sheth private communication.) in order to exclude all elliptical and lenticular galaxies from the sample. Applying the same criteria to our own catalogue, we find that 95.9% (2282) of our visually identified disc galaxies have , with 98 of our GZH disc galaxies categorized with earlier type SEDs. The volume limit and inclination cuts applied by S08 are also different from our selection.
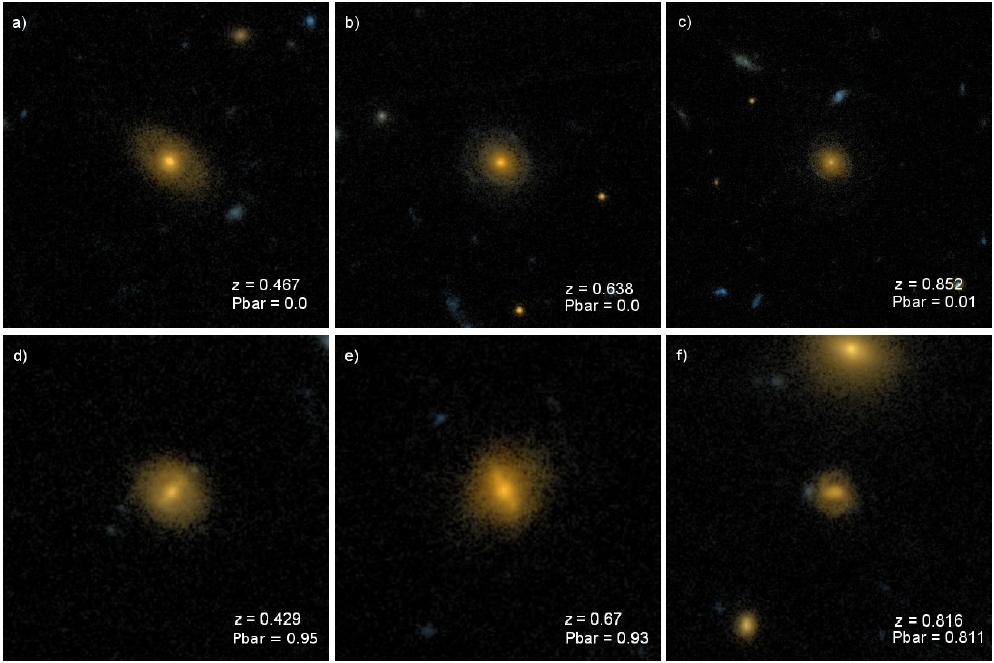
The 98 (4% of the GZH disc sample) disc galaxies we identify with are the high-redshift equivalents of red spirals’ (Masters et al., 2010), which have previously been identified in the COSMOS data (Bundy et al., 2010). In our local Universe up to 20% of disc galaxies are red’ (Bamford et al., 2009; Skibba et al., 2009), and even among late-type disc galaxies (i.e. Sb and Sc type galaxies) 6% are found near the red sequence (Masters et al., 2010). Of particular relevance to this work is that red spirals in the local Universe are found to have high bar fractions (Masters et al., 2010, 2011). Indeed, among the 98 red spirals’ in our sample, 45% (44) are identified as having a strong bar, compared to 11.5% for late-type galaxies selected by (i.e. ). Example images888Images of all 98 red spirals are shown at http://data.galaxyzoo.org/GZH/samples/tphot_disks.html of some of the red disc galaxies are shown in Figure 10.
The bar identification used in S08 is also different from our own. S08 identify bars by an ellipse fitting method, and also through visual classifications by a single author, with a cross check of 500 galaxies by a second author. These two methods were cross checked and found to be consistent 85% of the time. We use GZ identifications based on a median of 29 citizen scientists per galaxy.
Despite these variations in selection criteria, both studies observe similar overall trends of bar fraction with redshift (see Figure 9). We show in Appendix A.1 that, by altering the threshold of we use to define our barred GZH sample, we can replicate the absolute bar fraction values observed by S08 (using ), without significantly changing the trend we observe.
Where the studies appear to differ initially, is in the interpretation of the galaxy mass dependence of the redshift evolution of the bar fraction. However, when we only consider the data where the redshift bins and mass ranges are directly comparable [ and ], we find that the qualitative trends are in agreement.
5.1.2 Comparison with predictions of Kraljic et al. (2012)
There has been substantial progress in the theoretical modelling of bar formation in disc galaxies (e.g. Combes & Sanders 1981; Berentzen et al. 1998; Athanassoula 2003; Debattista et al. 2006; Martinez-Valpuesta et al. 2006; Villa-Vargas et al. 2009; Saha & Naab 2013). The realization that the transfer of angular momentum between dark matter haloes and the gaseous component in disc galaxies was vital to the growth of bars over time (e.g. Athanassoula 2003), along with improvements in computational power, has led to a significant increase in the sophistication of bar modelling.
Of particular interest to this work is Kraljic et al. (2012) who published a prediction for the redshift evolution of the bar fraction for a sample of 33 simulated disc galaxies which they followed over cosmic history. Initially part of a full cosmological dark matter simulation (see Martig et al. 2012 for details), the 33 galaxies were selected to have masses of . Kraljic et al. re-simulated these galaxies using a zoom-in’ technique, with a sticky-particle’ scheme used to model interstellar gas dynamics. The re-simulations began at , and the evolution of the galaxies were traced from to . For more information, including the method of bar identification and other analysis, see Kraljic et al. (2012) and Martig et al. (2012).
The work of Kraljic et al. (2012) provides an interesting theoretical comparison to our observed results for two main reasons. First, the present day (and ; see Martig et al. 2012) mass range explored is similar to the stellar mass ranges in our observed sample, and secondly, these simulations focus on disc-like galaxies, and a range of bar strengths are available to compare against.
We show in Figure 9 that, over the range of lookback times explored by our GZH data, the predicted evolution of the bar fraction in Kraljic et al. (2012) (green tramlines which represent Poissonian errors) agrees with our observations (and those of S08).
At lower redshifts (), we do not agree with Kraljic et al. (2012). The simulations predict a strong bar fraction of 58%: considerably higher than that observed in GZ2 (%). Their strong bar fraction prediction does agree with other published values of the bar fraction in the local Universe (e.g. Barazza et al. 2003; Aguerri et al. 2009); however, these observations include both strong and weak bars.
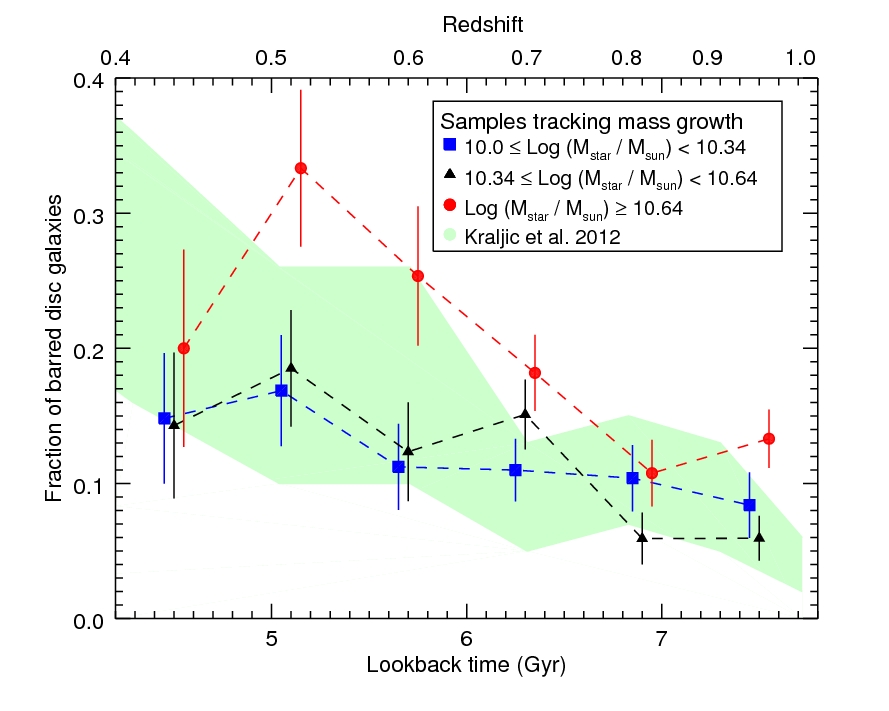
We note that in Kraljic et al. (2012), the strong bar fraction is observed in the same 33 discs as they are tracked through their evolution (see Figure 6 from Kraljic et al. 2012), while our GZH observations show only how the bar fraction in a population of galaxies of a given mass range changes with redshift. Here, we attempt to make a fairer comparison by exploring the bar fraction for three mass evolving disc galaxy subsamples.
We assume a typical SFR of 1.5 yr. This value is approximately the expected SFR of these disc galaxies over the 3.6 Gyr explored (yr; Damen et al. 2009; van Dokkum et al. 2010; Karim et al. 2011), with significantly lower SFRs only found in massive elliptical galaxies and higher for rare starburst galaxies.
| Mass sample | mass range | mass range |
|---|---|---|
| Low mass | ||
| Intermediate mass | ||
| High mass |
Table 2 shows the initial stellar mass ranges for our three subsamples (as described in Section 2.4), and their corresponding mass ranges after 3.6 Gyr have elapsed. The result of including the effects of star formation, and therefore mass growth, means that galaxies which are of low or intermediate mass at , may have accumulated sufficient mass to be moved into a higher mass bin by . The most massive galaxies at are less affected by mass growth, as the accumulation of yr is negligible for them.
5.2 Implications - the role of stellar mass in bar formation and evolution
The observations presented in Figure 8 show that the evolution of bar fraction with time is dependent on stellar mass, with the bar fraction of the most massive disc galaxies () being almost double that of our low-mass disc galaxies () by . Additionally, the lowest mass disc galaxies we track [] show the shallowest evolution of the bar fraction, increasing by 2% per Gyr over 8 Gyr, compared to 6% per Gyr for the most massive.
When interpreting these differing trends we observe for each mass subsample, it is important to remember that the bar fraction is not only dependent on the number of bars present in each time bin (), but also on the number of disc galaxies (). If we first look at our high-mass sample, it is a reasonable assumption that most massive disc galaxies are in place by , and so will remain approximately constant across the 8 Gyr explored. Therefore, the steep bar fraction evolution we see in our high-mass sample is being driven by an increasing towards lower redshifts.
Bars are predicted to form quickest in massive, dynamically cool stellar discs (Athanassoula 2005; Athanassoula et al. 2009; Cheung et al. 2013), and are long lived structures (e.g. Debattista et al. 2006; Athanassoula et al. 2013, but see Combes 2008 or Bournaud & Combes 2002 for an opposing view). The results we present support this theory, as it is the most massive disc galaxies that are more likely to host bars at earlier times.
S08, Sheth et al. (2012) and Cameron et al. (2010) all observed the bar fraction to be highest in the most massive galaxies at high redshifts, with Kraljic et al. (2012) also showing that their more massive simulated galaxies formed their bars earliest. At low redshifts, such as the range explored by the GZ2 sample, it is observed that strong bars are more likely to be found in more massive galaxies (see Nair & Abraham 2010; Skibba et al. 2012). This can all be explained by massive galaxies becoming dynamically cool, disc dominated quicker (i.e. is constant at for massive disc galaxies) and having lower gas fractions than their lower mass counterparts.
The increasing bar fraction we observe in the most massive disc galaxies over the 3.6 Gyr coincides with a proposed first epoch of substantial bar formation at (Kraljic et al., 2012), who suggest that secular processes begin to dominate the evolution of massive disc galaxies at . Our observations are consistent with this picture, as it is the increasing that drives the rapid evolution of the bar fraction for our high-mass disc galaxies.
Alternatively, we observe a population of lower mass disc galaxies whose bar fraction increases at a much slower rate compared to that seen for the more massive disc galaxies. For these discs, we will assume that increases at a similar rate to that for higher mass galaxies. However, for our low-mass sample we expect that is also increasing towards lower redshifts, and so the overall increase in the bar fraction is much shallower than observed in our high-mass discs.
Nair & Abraham (2010) observed a bimodality in the fraction of bars in disc galaxies with a minimum at the typical mass transition of the colour-magnitude diagram []. They suggest the bimodality could be revealing fundamental differences in bar formation mechanisms in these two regimes and postulate that bars may be more easily triggered, and will form more quickly in lower mass disc galaxies. They also state that bars would be easier to destroy in these lower mass galaxies. In this scenario, the relatively low increase in bar fraction we see in our lowest mass subsample [] over 8 Gyr can be explained by the combination of both the balance between the time-scales of these two processes across cosmic time and the continually increasing number of unbarred disc galaxies () entering our sample towards lower redshifts. In higher mass galaxies, bars are predicted to be more stable, so once formed, they will persist over long periods. The monotonic increase in bar fraction we observe for these galaxies is consistent with this explanation.
More recently, works with smaller samples of galaxies (Méndez-Abreu et al. 2010; Méndez-Abreu et al. 2012; Sheth et al. in preperation) do not observe the low-mass peak in the bar fraction. In this scenario the low increase of the bar fraction in our lowest mass galaxies can be interpreted as these disc galaxies not yet having bars.
The differing rates of increase we observe in the evolution of the bar fraction for different mass galaxies suggest more than one process is at play in determining the observed bar fraction; affecting both rates of bar formation in discs (), as well as the rate of galaxies becoming disc dominated (). We review possible mass-dependent processes that could affect these time-scales:
-
Gas content:
simulations suggest that increasing the gas fraction in disc galaxies will inhibit bar formation (e.g. Friedli & Benz 1993; Berentzen et al. 2007; Heller et al. 2007; Villa-Vargas et al. 2010; Kraljic et al. 2012; Athanassoula et al. 2013), with observations offering support to these theories (Masters et al., 2012). Correlations exist between the total gas content of disc galaxies and their stellar mass (e.g. Kauffmann et al. 2003; Catinella et al. 2010, 2012), such that more massive disc galaxies tend to be less gas rich. The gas content of disc galaxies is also known to decrease over cosmic time (e.g. Tacconi et al. 2013), which can naturally explain the increasing bar fractions of the massive and intermediate disc galaxies as they gradually lose their gas. In this scenario, the lower-mass galaxies that continuously enter our low mass sample towards lower redshifts start out unbarred, and may remain unable to form strong bars even to . However, the situation may be different for weaker bars, which are still able to form and grow, albeit at a slower rate, in gas-rich galaxies (Athanassoula et al., 2013), and so they may be more abundant in these gas-rich galaxies (e.g. Nair & Abraham 2010).
-
Tidal heating:
the impact that tidal heating, or harassment (i.e. minor mergers adding random motion to the stellar disc), has on a galaxy will depend sensitively on its mass. S08, Sheth et al. (2012) and Giordano et al. (2011) have all argued that this effect may drive the different evolutions of the bar fraction observed in disc galaxies with differing masses (with redshift and environment, respectively). Interactions which would act to trigger bar formation in more massive galaxies (e.g. Moore et al. 1996; Skibba et al. 2012) may instead heat the disc of a lower mass galaxy, preventing any bar formation. As cosmic time proceeds, such interactions become less likely as the galaxy number density decreases. This would lead to not only less tidal triggering, but also less inhibition of bar formation from disc heating, and less disruption of bars from more violent encounters. Indeed, the phase of increased bar formation that we observe in the most massive discs in our sample at coincides with an observed reduction in major merger rates (see Conselice et al. 2003; Ryan et al. 2008; Lotz et al. 2011). As discussed in Kraljic et al. (2012), prior to the evolution of galaxies is dominated by violent interactions (such as major and minor mergers). Therefore, as the merger rate begins to decline, the evolution of disc galaxies becomes dominated by secular processes.
How the bar fraction continues to evolve in these different mass regimes at is of significant interest. Kraljic et al. (2012) make a clear prediction that at , as stable discs become rare. We are extending our observations of the bar fraction to higher redshifts, using images from the Cosmic Assembly Near-Infrared Deep Extragalactic Legacy Survey (CANDELS; Grogin et al. 2011; Koekemoer et al. 2011). These images are currently being classified by GZ volunteers in the fourth incarnation of GZ999www.galaxyzoo.org.
6 Summary
We present a study of the redshift evolution of the bar fraction from a sample of 2380 disc galaxies. The galaxy images were taken as part of the COSMOS programme, and were visually classified by GZH volunteers. Our GZH disc sample is volume limited [; ], and does not include highly inclined discs []. The identification of barred structures hosted in these disc galaxies is based on GZH visual classifications. We present evidence that suggests the barred disc galaxies identified in this way host strong bars.
We explore the stellar mass dependence of the redshift evolution of the bar fraction by splitting the GZH sample into three equally populated stellar mass bins: and . Our main results and conclusions are as follows.
-
•
We observe a decrease in the bar fraction towards higher redshifts, with the overall reduction being a factor of 2 across 3.6 Gyr of cosmic time, from % at Gyr () to % at Gyr ().
-
•
We find that splitting the GZH sample by stellar mass reveals differing redshift evolution of the bar fraction. Lower mass disc galaxies are observed to have a steady but slowly decreasing bar fraction towards , with the intermediate-mass galaxies having a similar, but slightly steeper decrease.
-
•
The steepest decrease in bar fraction evolution is seen in the most massive disc galaxies, with this trend observed across the whole 8 Gyr explored. We suggest that the redshift evolution of the bar fraction we find is predominantly driven by the evolution observed in these high-mass disc galaxies.
-
•
An extrapolation of the trends we see to higher redshifts suggests that we may be observing an era of transition in disc galaxy evolution, where secular processes have recently begun to affect the evolution of some of the more massive disc galaxies. At this epoch, we suggest that the first galaxies have become dynamically cool and disk dominated and are able to form and sustain barred structures. This time coincides with a decreasing rate of major mergers in these same massive galaxies (Conselice et al., 2003; Ryan et al., 2008; Lotz et al., 2011).
-
•
The slow evolution of the bar fraction observed for lower mass disc galaxies suggests that different processes may dominate bar formation and disruption in these galaxies. The suggestion that lower mass disc galaxies may host different types of bars with separate formation processes has previously been made by Nair & Abraham (2010), based on the bimodal trend of bar fraction with galaxy mass they observed in the local Universe.
-
•
We combine GZH visual classifications with values (see Mobasher et al. 2007) to identify a subsample of 98 quiescent disc galaxies. The bar fraction of these discs, %, is a factor of 3.8 greater than the bar fraction observed across the whole GZH sample (), as well as being a factor of 3.9 times greater than the bar fraction observed in late-type (i.e. ) galaxies ().
This paper provides the first results from the third incarnation of the Galaxy Zoo project, Galaxy Zoo: Hubble. The observations we have discussed identify an important point in a disc galaxy’s lifetime, where the regime of dramatic and dynamically quick evolutionary processes curtail and an epoch of a calmer (secular) evolution begins. We demonstrate that this point in a galaxy’s evolution can be identified simply by exploring its morphological features, specifically whether the galaxy in question hosts a barred structure.
Acknowledgements
This work has been made possible by the participation of more than 86,000 volunteers of the Galaxy Zoo: Hubble project. Their contributions are individually acknowledged at http://authors.galaxyzoo.org/. The development of the project was supported by The Leverhulme Trust.
We thank the referee for many helpful comments and suggestions that improved the paper. TM acknowledges funding from the Science and Technology Facilities Council ST/J500665/1. KLM acknowledges funding from The Leverhulme Trust as a 2010 ECF. RN and EME acknowledge funding from the Science and Technology Facilities Council ST/K00090X/1. KS gratefully acknowledges support from Swiss National Science Foundation Grant PP00P2_138979/1. RAS is supported by the NSF grant AST-1055081. SPB gratefully acknowledges support from an STFC Advanced Fellowship. LF and KW would like to acknowledge support from the US National Science Foundation under grant DRL-0941610.
Funding for the SDSS and SDSS-II has been provided by the Alfred P. Sloan Foundation, the Participating Institutions, the National Science Foundation, the U.S. Department of Energy, the National Aeronautics and Space Administration, the Japanese Monbukagakusho, the Max Planck Society and the Higher Education Funding Council for England. The SDSS web site is http://sdss.org/.
Any data used in this work which are not already published are available on request, email: tom.melvin@port.ac.uk.
References
- Abraham et al. (1999) Abraham R., Merrifield M., Ellis R., Tanvir N., Brinchmann J., 1999, Mon.Not.Roy.Astron.Soc., 308, 569
- Abraham (1999) Abraham R. G., 1999, in Barnes J. E., Sanders D. B., eds, Galaxy Interactions at Low and High Redshift. IAU Symp. Vol. 186, A Review of High-Redshift Merger Observations. p. 11
- Aguerri et al. (2009) Aguerri J. A. L., Méndez-Abreu J., Corsini E. M., 2009, A&A, 495, 491
- Alonso et al. (2013) Alonso M. S., Coldwell G., Lambas D. G., 2013, A&A, 549, A141
- Athanassoula (2003) Athanassoula E., 2003, MNRAS, 341, 1179
- Athanassoula (2005) Athanassoula E., 2005, Celest.Mech.Dyn.Astron., 91, 9
- Athanassoula ( 2012) Athanassoula E., 2012, ArXiv e-prints:1211.6752
- Athanassoula et al. (2009) Athanassoula E., Gadotti D. A., Carrasco L., Bosma A., de Souza R. E., Recillas E., 2009, arXiv e-prints:0910.0768
- Athanassoula et al. (2013) Athanassoula E., Machado R. E. G., Rodionov S. A., 2013, MNRAS, 429, 1949
- Baillard et al. (2011) Baillard A. et al, 2011, A&A, 532, A74
- Baldry et al. (2004) Baldry I. K., Glazebrook K., Brinkmann J., Ivezic Z., Lupton R. H., Nichol R. C., Szalay A. S., 2004, Astrophys.J., 600, 681
- Bamford et al. (2009) Bamford S. P. et al., 2009, MNRAS, 393, 1324
- Barazza et al. (2003) Barazza F. D., Jogee S., Marinova I., 2003, Astrophys.J., 675, 1194
- Barazza et al. (2008) Barazza F. D., Jogee S., Marinova I., 2008, ApJ, 675, 1194
- Barden et al. (2005) Barden M. et al., 2005, ApJ, 635, 959
- Barnes & Hernquist (1991) Barnes J. E., Hernquist L. E., 1991, ApJ, 370, L65
- Bennett et al. (2013) Bennett C., Larson D., Weiland J., Jarosik N., Hinshaw G., 2013, ApJS, 208, 20
- Berentzen et al. (1998) Berentzen I., Heller C. H., Shlosman I., Fricke K. J., 1998, MNRAS, 300, 49
- Berentzen et al. (2007) Berentzen I., Shlosman I., Martinez-Valpuesta I., Heller C. H., 2007, ApJ, 666, 189
- Bournaud & Combes (2002) Bournaud F., Combes F., 2002, A&A, 392, 83
- Bundy et al. (2006) Bundy K. et al., 2006, ApJ, 651, 120
- Bundy et al. (2010) Bundy K. et al., 2010, ApJ, 719, 1969
- Cameron et al. (2010) Cameron E. et al., 2010, MNRAS, 409, 346
- Capak et al. (2007) Capak P. et al., 2007, Astrophys.J.Suppl., 172, 99
- Catinella et al. (2012) Catinella B. et al., 2012, A&A, 544, A65
- Catinella et al. (2010) Catinella B. et al., 2010, MNRAS, 403, 683
- Cheung et al. (2013) Cheung E. et al., 2013, ApJ, 779, 162
- Cisternas et al. (2013) Cisternas M. et al., 2013, ApJ, 776, 50
- Coelho & Gadotti (2011) Coelho P., Gadotti D. A., 2011, ApJ, 743, L13
- Coleman et al. (1980) Coleman G. D., Wu C.-C., Weedman D. W., 1980, ApJS, 43, 393
- Combes (2008) Combes F., 2008, in Bureau M., Athanassoula E., Barbuy B., eds, Proc. IAU Symposium Vol. 245 of IAU Symposium, Gaseous Flows in Galaxies. p 151
- Combes (2009) Combes F., 2009, in Jogee S., Marinova I., Hao L., Blanc G. A., eds, Galaxy Evolution: Emerging Insights and Future Challenges Vol. 419 of Astronomical Society of the Pacific Conference Series, Secular Evolution and the Assembly of Bulges. p. 31
- Combes & Sanders (1981) Combes F., Sanders R. H., 1981, A&A, 96, 164
- Conselice et al. (2003) Conselice C. J., Bershady M. A., Dickinson M., Papovich C., 2003, AJ, 126, 1183
- Conselice et al. (2008) Conselice C. J., Rajgor S., Myers R., 2008, MNRAS, 386, 909
- Cox et al. (2008) Cox T. J., Jonsson P., Somerville R. S., Primack J. R., Dekel A., 2008, MNRAS, 384, 386
- Damen et al. (2009) Damen M., Labbé I., Franx M., van Dokkum P. G., Taylor E. N., Gawiser E. J., 2009, ApJ, 690, 937
- de Vaucouleurs et al. (1991) de Vaucouleurs G., de Vaucouleurs A., Corwin J. H. G., Buta R. J., Paturel G., Fouqué P., 1991, Third Reference Catalogue of Bright Galaxies. Springer-Verlag, Berlin
- Debattista et al. (2006) Debattista V. P., Mayer L., Carollo C. M., Moore B., Wadsley J., Quinn T., 2006, ApJ, 645, 209
- Ellison et al. (2011) Ellison S. L. , Nair P., Patton D. R., Scudder J. M., Mendel J. T., Simard L., 2011, MNRAS, 416, 2182
- Elmegreen & Elmegreen (1985) Elmegreen B. G., Elmegreen D. M., 1985, ApJ, 288, 438
- Elmegreen et al. (2004) Elmegreen B. G., Elmegreen D. M., Hirst A. C., 2004, Astrophys.J., 612, 191
- Elmegreen et al. (2009) Elmegreen D. M., Elmegreen B. G., Marcus M. T., Shahinyan K., Yau A., Petersen M., 2009, ApJ, 701, 306, 329
- Elmegreen et al. (2005) Elmegreen D. M., Elmegreen B. G., Rubin D. S., Schaffer M. A., 2005, ApJ, 631, 85
- Erwin (2004) Erwin P., 2004, A&A, 415, 941
- Friedli & Benz (1993) Friedli D., Benz W., 1993, A&A, 268, 65
- Gilmore et al. (2002) Gilmore G., Wyse R. F. G., Norris J. E., 2002, ApJ, 574, L39
- Giordano et al. (2011) Giordano L., Tran K.-V. H., Moore B., Saintonge A., 2011, arXiv e-prints:1111.1532
- Griffith et al. (2012) Griffith R. L. et al., 2012, Astrophys.J.Suppl., 200, 9
- Grogin et al. (2011) Grogin N. A. et al., 2011, Astrophys.J.Suppl., 197, 35
- Hawarden et al. (1986) Hawarden T. G., Mountain C. M., Leggett S. K., Puxley P. J., 1986, MNRAS, 221, 41P
- Heller et al. (2007) Heller C. H., Shlosman I., Athanassoula E., 2007, ApJ, 657, L65
- Ho et al. (1997) Ho L. C., Filippenko A. V., Sargent W. L. W., 1997, ApJ, 487, 591
- Hopkins et al. (2009) Hopkins P. F., Cox T. J., Younger J. D., Hernquist L., 2009, ApJ, 691, 1168
- Hoyle et al. (2011) Hoyle B. et al., 2011, MNRAS, 415, 3627
- Ilbert et al. (2009) Ilbert O. et al., 2009, Astrophys.J., 690, 1236
- Ilbert et al. (2013) Ilbert O. et al., 2013, A&A, 556A, 551
- Ilbert et al. (2010) Ilbert O. et al., 2010, Astrophys.J., 709, 644
- Jogee et al. (2004) Jogee S. et al., 2004, Astrophys.J., 615, L105
- Karim et al. (2011) Karim A. et al., 2011, ApJ, 730, 61
- Kartaltepe et al. (2010) Kartaltepe J. S. et al., 2010, Astrophys.J., 721, 98
- Kassin et al. (2007) Kassin S. A. et al., 2007, ApJ, 660, L35
- Kauffmann et al. (2003) Kauffmann G., et al., 2003, Mon.Not.Roy.Astron.Soc., 341, 33
- Kauffmann et al. (2003) Kauffmann G. et al., 2003, MNRAS, 341, 54
- Kinney et al. (1996) Kinney A. L., Calzetti D., Bohlin R. C., McQuade K., Storchi-Bergmann T., Schmitt H. R., 1996, ApJ, 467, 38
- Knapen et al. (2000) Knapen J. H., Shlosman I., Peletier R. F., 2000, Astrophys.J., 529, 93
- Koekemoer et al. (2011) Koekemoer A. M. et al., 2011, Astrophys.J.Suppl., 197, 36
- Kormendy & Kennicutt (2004) Kormendy J., Kennicutt R. J., 2004, ARA&A, 42, 603
- Kraljic et al. (2012) Kraljic K., Bournaud F., Martig M., 2012, ApJ, 757, 60
- Land et al. (2008) Land K. et al., 2008, MNRAS, 388, 1686
- Lilly et al. (2007) Lilly S. J., et al., 2007, Astrophys.J.Suppl., 172, 70
- Lilly et al. (2009) Lilly S. J., et al., 2009, VizieR Online Data Catalog, 217, 20070
- Lin et al. (2008) Lin L. et al. 2008, ApJ, 681, 232
- Lintott et al. (2011) Lintott C. et al., 2011, MNRAS, 410, 166
- Lintott et al. (2008) Lintott C. J. et al., 2008, Mon.Not.Roy.Astron.Soc., 389, 1179
- Lotz et al. (2011) Lotz J. M., Jonsson P., Cox T., Croton D., Primack J. R., Siomerville R. S., Stewart K., 2011, Astrophys.J., 742, 103
- Martig et al. (2012) Martig M., Bournaud F., Croton D. J., Dekel A., Teyssier R., 2012, ApJ, 756, 26
- Martinet & Friedli (1997) Martinet L., Friedli D., 1997
- Martinez-Valpuesta et al. (2006) Martinez-Valpuesta I., Shlosman I., Heller C., 2006, ApJ, 637, 214
- Masters et al. (2010) Masters K. L. et al., 2010, MNRAS, 405, 783, 799
- Masters et al. (2012) Masters K. L. et al., 2012, MNRAS, 424, 2180
- Masters et al. (2011) Masters K. L. et al., 2011, Mon.Not.Roy.Astron.Soc., 411, 2026
- Méndez-Abreu et al. (2010) Méndez-Abreu J., Sánchez-Janssen R., Aguerri J. A. L., 2010, ApJ, 711, L61
- Méndez-Abreu et al. (2012) Méndez-Abreu J., Sánchez-Janssen R., Aguerri J. A. L., Corsini E. M., Zarattini S., 2012, ApJ, 761, L6
- Menéndez-Delmestre et al. (2007) Menéndez-Delmestre K., Sheth K., Schinnerer E., Jarrett T. H., Scoville N. Z., 2007, ApJ, 657, 790
- Mobasher et al. (2007) Mobasher B. et al., 2007, ApJS, 172, 117
- Moore et al. (1996) Moore B., Katz N., Lake G., Dressler A., Oemler A., 1996, Nature, 379, 613
- Mulchaey & Regan (1997) Mulchaey J. S., Regan M. W., 1997, ApJ, 482, L135
- Nair & Abraham (2010) Nair P. B., Abraham R. G., 2010, ApJ, 714, L260
- Oh et al. (2012) Oh S., Oh K., Yi S. K., 2012, ApJS, 198, 4
- Pfenniger & Norman (1990) Pfenniger D., Norman C., 1990, ApJ, 363, 391
- Ravindranath et al. (2004) Ravindranath S. et al., 2004, Astrophys.J., 604, L9
- Regan & Mulchaey (1999) Regan M. W., Mulchaey J. S., 1999, AJ, 117, 2676
- Ryan et al. (2008) Ryan J. R. E., Cohen S. H., Windhorst R. A., Silk J., 2008, ApJ, 678, 751
- Saha & Naab (2013) Saha K., Naab T., 2013, MNRAS, 434, 1287
- Saintonge et al. (2012) Saintonge A. et al., 2012, ApJ, 758, 73
- Sakamoto et al. (1999) Sakamoto K., Okumura S. K., Ishizuki S., Scoville N. Z., 1999, ApJ, 525, 691
- Sargent et al. (2007) Sargent M. T., et al., 2007, ApJS, 172, 434
- Scoville et al. (2007a) Scoville N., et al., 2007a, Astrophys.J.Suppl., 172, 38
- Scoville et al. (2007b) Scoville N., et al., 2007b, Astrophys.J.Suppl., 172, 1
- Sellwood (2013) Sellwood J. A., 2013, Dynamics of Disks and Warps. p. 923
- Sérsic & Pastoriza (1965) Sérsic J. L., Pastoriza M., 1965, PASP, 77, 287
- Sheth et al. (2008) Sheth K. et al., 2008, Astrophys.J., 675, 1141 (S08)
- Sheth et al. (2012) Sheth K., Melbourne J., Elmegreen D. M., Elmegreen B. G., Athanassoula E., Abraham A. G., Weiner B. J., 2012, Astrophys.J., 758, 136
- Sheth et al. (2004) Sheth K., Menendez-Delmestre K., Scoville N., Jarrett T., Strubbe L., Regan M. W., Schinnerer E., Block D. L., 2004, in Block D. L., Puerari I., Freeman K. C., Groess R., Block E. K., eds, Penetrating Bars Through Masks of Cosmic Dust Vol. 319 of Astrophysics and Space Science Library, Using Bars As Signposts of Galaxy Evolution at High and Low Redshifts. p. 405
- Sheth et al. (2003) Sheth K., Regan M. W., Scoville N. Z., Strubbe L. E., 2003, ApJ, 592, L13
- Sheth et al. (2005) Sheth K., Vogel S. N., Regan M. W., Thornley M. D., Teuben P. J., 2005, ApJ, 632, 217
- Skibba et al. (2009) Skibba R. A. et al., 2009, MNRAS, 399, 966
- Skibba et al. (2012) Skibba R. A. et al., 2012, MNRAS, 423, 1485
- Strauss et al. (2002) Strauss M. A., et al., 2002, Astron.J., 124, 1810
- Tacconi et al. (2013) Tacconi L. et al., 2013, ApJ, 768, 74
- van den Bergh (2011) van den Bergh S., 2011, AJ, 141, 188
- van Dokkum et al. (2010) van Dokkum P. G. et al., 2010, ApJ, 709, 1018
- Villa-Vargas et al. (2009) Villa-Vargas J., Shlosman I., Heller C., 2009, ApJ, 707, 218
- Villa-Vargas et al. (2010) Villa-Vargas J., Shlosman I., Heller C., 2010, ApJ, 719, 1470
- Wang et al. (2012) Wang J. et al., 2012, MNRAS, 423, 3486
- Weiner et al. (2006) Weiner B. J. et al., 2006, ApJ, 653, 1027
- Willett et al. (2013) Willett K. W. et al., 2013, MNRAS, 435, 2835
- Wyse (2001) Wyse R. F. G., 2001, in Funes J. G., Corsini E. M., eds, ASP Conf. Ser. Vol. 230. Galaxy Disks and Disk Galaxies. The Merging History of the Milky Way Disk. Astron. Soc. Pac., San Fransisco, p.71
Appendix A Appendix
A.1 Varying the threshold
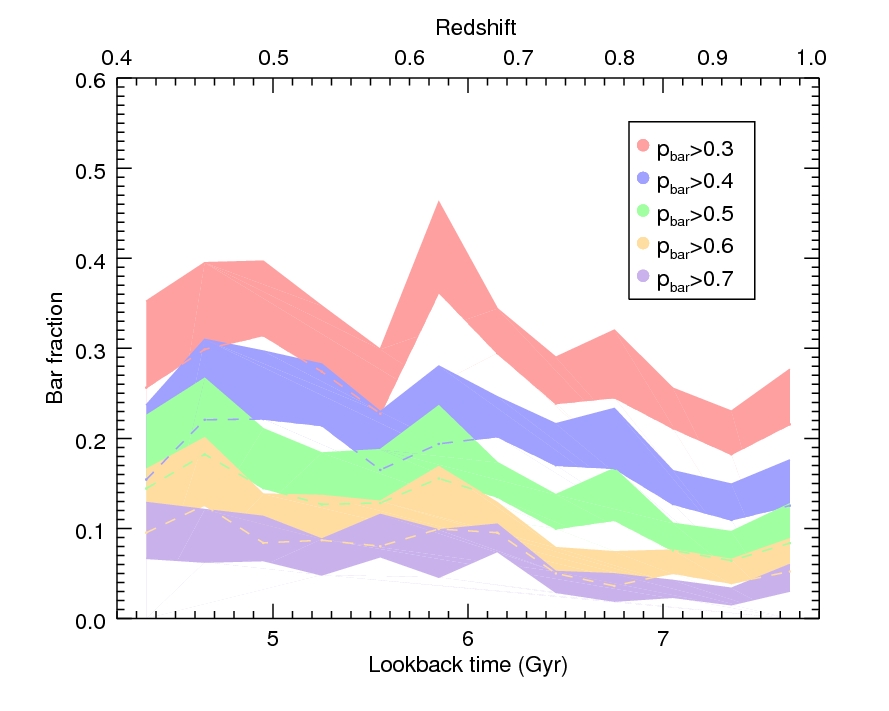
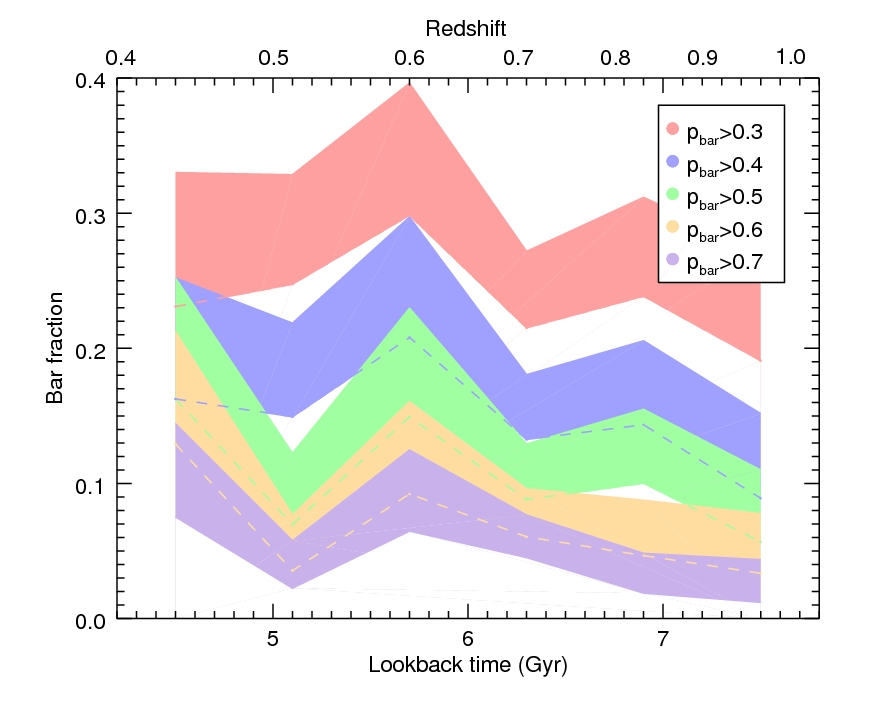
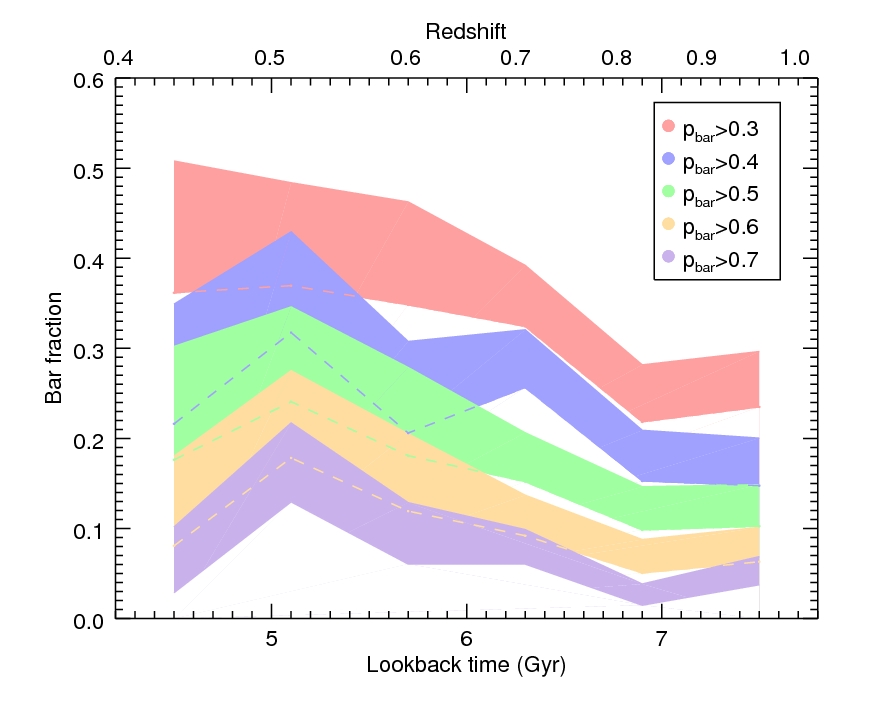
As described in the main text, the threshold we choose for is selected so bars in our GZH sample should have similar properties (i.e. strength) to those in the GZ2 low-redshift comparison sample. We allude to the fact that differing bar fractions observed at low and high redshifts may be due to different strengths of bars being used to determine such results. Figure 11 of W13 illustrates for GZ2 how correlates with the length of bars relative to their disc. Here we explore the redshift evolution of the bar fraction for a range of thresholds (from to ), where we expect a lower threshold to include weak bars, and the higher threshold to only include the strongest’ bars.
Figure 12 gives examples of galaxies with a range of and redshift values. Combining these images with those from Figure 4, which show disc galaxies with and , we provide images which illustrate the full range of values () at selected redshift values within our range ().
Figure 13 shows the evolution of the bar fraction for each of these thresholds. As expected, the bar fractions seen in each lookback bin differ for each threshold, as expected the bar fraction increases as the threshold is lowered. Linear relationships for each of the thresholds are shown in Table 3. We show that varying the threshold does not significantly change the slope of the trend seen in our results, where the bar fraction increases towards lower redshifts. We do find that the rate of increase of the bar fraction towards lower redshifts does slightly increase as the threshold is reduced.
| threshold | ||
|---|---|---|
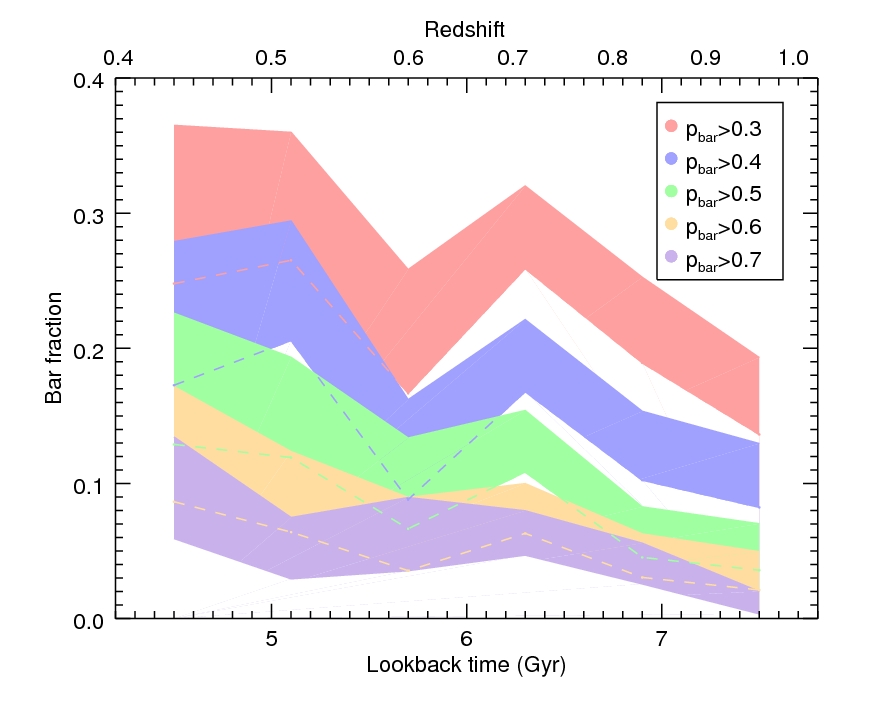
In Figure 14, we explore the mass-dependent redshift evolution of the bar fraction for the thresholds used in Figure 13. As we found for the GZH sample as a whole, the absolute bar fractions observed in each of the stellar mass ranges increase as the threshold drops. The rate of increase of the bar fraction with time, shown in Table 4, also becomes steeper as is reduced. Despite these differences, the observed trends we discussed in Section 4.2 remain for all thresholds, across each of the three stellar mass bins.
| Low-mass sample - | ||
| threshold | ||
| Intermediate-mass sample - | ||
| threshold | ||
| High-mass sample - | ||
| threshold | ||