Search for [CII] emission in star-forming galaxies.
Abstract
We present the search for the [C II] emission line in three Lyman-alpha emitters (LAEs) and one J-Dropout galaxy using the Combined Array for Research in Millimeter-wave Astronomy (CARMA) and the Plateau de Bure Interferometer (PdBI). We observed three bright LAEs discovered in the SUBARU deep field (SDF) and the Multiple Imaged lensed galaxy candidate found behind the galaxy cluster MACSJ0647.7+7015. For the LAEs IOK-1 (), SDF J132415.7+273058 () and SDF J132408.3+271543 () we find upper limits for the [C II] line luminosity of , and respectively. We find upper limits to the FIR luminosity of the galaxies using a spectral energy distribution template of the local galaxy NGC 6946 and taking into account the effects of the Cosmic Microwave Background on the mm observations. For IOK-1, SDF J132415.7+273058 and SDF J132408.3+271543 we find upper limits for the FIR luminosity of , and respectively. For the lensed galaxy MACS0647-JD , one of the highest redshift galaxy candidate to date with we put an upper limit in the [C II] emission of and an upper limit in the FIR luminosity of (where is the magnification factor). We explore the different conditions relevant for the search for [C II] emission in high redshift galaxies as well as the difficulties for future observations with ALMA and CCAT.
Subject headings:
galaxies: high-redshift– galaxies: individual (IOK-1, SDF J132415.7+273058, SDF J132408.3+271543, MACS0647-JD) –ISM: lines and bands1. Introduction
Lyman-alpha Emitters (LAE) are galaxies selected through strong Ly emission and are among the most studied galaxy populations at high redshift. The use of narrow band filters over a wide area on the sky has proven to be a very effective method to find galaxies up to (Iye et al., 2006; Fontana et al., 2010; Vanzella et al., 2011; Rhoads et al., 2012; Shibuya et al., 2012; Schenker et al., 2012; Ono et al., 2012). The possibility of finding LAEs from to shows that this type of galaxies can be used to understand galaxy evolution over cosmic time. It has been observed that the LAE fraction in UV selected galaxies increases with redshift up to (Stark et al., 2010), which is expected due to the decreasing dust content at higher redshifts. Beyond it is expected that the LAE fraction decreases as the amount of neutral Hydrogen (H I ) increases, due to the incomplete reionization of the Intergalactic Medium (IGM) (Ota et al., 2008; Stark et al., 2010; Pentericci et al., 2011; Ono et al., 2012; Schenker et al., 2012). This is consistent with the comparatively low success rate of detection of Ly emission at .
If Lyman-alpha photons from redshifts are absorbed by H I in the IGM (Dayal & Ferrara, 2012), it will be difficult to spectroscopically confirm the candidates at high redshift, such as the candidate galaxy UDFj-39546284 discovered in the Hubble Space Telescope (HST) Ultra Deep Field (UDF) (Bouwens et al., 2011; Ellis et al., 2013; Brammer et al., 2013; Capak et al., 2013), and the candidates found behind galaxy clusters at MACS1149-JD and MACS0647-JD (Zheng et al., 2012; Coe et al., 2013).
Among the usual Interstellar medium (ISM) tracers at optical/UV wavelengths, the only line that has been observed at in galaxies is Ly-alpha. The emission of Ly-alpha is complicated by its high optical depth in the emission region and its escape through resonant scattering, by dust absorption, and by the contribution from outflows. Therefore direct constrains on the gas properties from the Ly-alpha line strength and shape are difficult to derive. This motivates the exploration of alternative means to study the highest redshift galaxies. Promising candidates include far-infrared fine structure emission lines, e.g., [C II] (2P3/2 2P1/2) at m, which is not affected by the increasingly neutral IGM at and can account for up to of the total infrared luminosity in some galaxies, especially in those with low luminosity and metallicity (Crawford et al., 1985; Stacey et al., 1991; Israel et al., 1996; Madden et al., 1997).
The [C II] line traces photo-dissociation (a.k.a. photon-dominated) regions (PDRs), as well as diffuse H I and H II regions. In PDRs, the far-UV radiation produced by OB stars heats the surface layers of molecular clouds, which cool preferentially through [C II] emission. It has been observed that most of the [C II] emission in IR-bright galaxies is coming from PDRs, and that the PDR gas mass fraction can be up to in starbursts like M82 (Crawford et al., 1985).
Modeling of FIR emission lines observed in starburst galaxies showed that at least 70% of the [C II] emission is produced in PDRs (Carral et al., 1994; Lord et al., 1996; Colbert et al., 1999). In the low-metallicity system Haro 11, on the other hand, at least 50% of the [C II] emission arises from a more diffuse, extended ionized medium (Cormier et al., 2012). The different conditions in which the [C II] emission is produced, and the direct or indirect relation of these conditions with the star formation process, suggest that [C II] emission should be a good tracer of the global galactic star formation activity (de Looze et al., 2011), at least for galaxies with low or low (Diaz-Santos et al., 2013). [C II] is found to be the strongest emission line, stronger than CO, and thus is the most promising tracer of the dense, star forming regions in distant galaxies where [C II] can be detected with ground-based telescopes due to the redshift into observable atmospheric windows.
In the past years, the [C II] 158 m emission line has been established as a promising observable in high-redshift galaxies (Maiolino et al., 2005; Iono et al., 2006; Maiolino et al., 2009; Walter et al., 2009; Hailey-Dunsheath et al., 2010; Stacey et al., 2010; Ivison et al., 2010; Wagg et al., 2010; Cox et al., 2011; De Breuck et al., 2011; Valtchanov et al., 2011; Gallerani et al., 2012; Venemans et al., 2012; Wagg et al., 2012; Walter et al., 2012a; Carilli et al., 2013; Wang et al., 2013; Willott et al., 2013; Riechers et al., 2013). Most of the high-z detections were for infrared-luminous starbursts, many of which also show signatures of AGN. See the review by Carilli & Walter (2013) for more details.
With star formation rates of a few tens , based on the Ly and UV continuum emission, LAEs are classified as “normal” star forming galaxies. Different studies claim that LAEs are young, dust free, starbursting galaxies, supported by UV observations (Gawiser et al., 2006; Finkelstein et al., 2007; Lai et al., 2008). Recent MIR detection of LAEs at and show that a significant fraction of the star formation in these galaxies is strongly obscured by dust (Oteo et al., 2012a; Oteo et al., 2012b). Thus, LAEs are promising targets for the detection of [C II] at high redshift.
Previous attempts to detect [C II] in a small sample of LAEs at were unsuccessful (Walter et al., 2012b; Kanekar et al., 2013; Ouchi et al., 2013).
Here we present the result of a search for [C II] in three LAEs at and in a lensed galaxy at . In Sect. 2 we describe the target selection and observations. The data is shown in Sect. 3 together with some implications and analysis in Sect. 4. A summary of the paper is presented in Sect. 5. Throughout this paper we use a -Cold Dark Matter cosmology with H0 = 70 km s-1 Mpc-1, and .
2. Observations
2.1. Source Selection
The three Lyman- emitters targeted in this study were discovered in the Subaru Deep Field (SDF). Two of the LAEs observed belong to the sample of LAEs at discovered by Taniguchi et al. (2005). The targets are the brightest LAEs (sources 3 and 4 in their catalog) and have a narrow and bright Lyman- emission line. The third LAE (IOK-1) was discovered at by Iye et al. (2006). It is one of the brightest and most distant LAEs known to date.
The fourth target, MACS0647-JD, is a lensed Lyman-break galaxy (LBG) discovered behind the galaxy cluster MACSJ0647.7+7015 at (Coe et al., 2013). The galaxy was discovered as a J-Dropout galaxy lensed into 3 magnified images as part of The Cluster Lensing And Supernova survey with Hubble (CLASH) (Postman et al., 2012). The three images of the galaxy MACS0647-JD1, MACS0647-JD2 and MACS0647-JD3, have a magnification of 8,7 and 2 respectively. The photometric redshift of the galaxy is (95% confidence limits). This is one of the highest redshift galaxy candidates known to date.
2.2. CARMA Observations
Observations of the three LAEs were carried out using the Combined Array for Research in Millimeter-wave Astronomy (CARMA) between 2008 July and 2010 July. The array configurations used were the most compact, D and E, to minimize phase decoherence and maximize point source sensitivity. The [C II] line has a rest frequency of 1900.54 GHz (157.74 m). For the redshifts of the targets, the line is shifted to the 1 mm band. The receivers were tuned to a frequency 150 km s-1 bluer than the expected frequency from the redshift determined by the peak of the Lyman- line. This is for taking into account the possible absorption by the IGM in the Lyman- line. The setups provide an instantaneous bandwidth of GHz () with a spectral resolution of 31.25 MHz ( km s-1 ).
The observations were processed using MIRIAD (Sault et al., 1995). The absolute flux calibrators used are 3C84, MWC349, 3C273 and Mars, the latter being the most used. As passband calibrators the QSOs 3C273, 3C345 and 0854+201 were used. As gain calibrator the QSO 1310+323 was used. The time on source for IOK-1 was 58.5 hours, for SDF J132415.7+273058 was 15.9 hours and for SDF J132408.3+271543 4.6 hours. The final cubes were made using natural weighting to maximize point source sensitivity. The observations resulted in the following beamsizes: IOK-1: , PA, SDF J132415.7+273058: , PA, SDF J132408.3+271543: , PA (all targets: D and E configurations). For D configuration the minimum baseline is 11 meters and the maximum is 150 meters. For E configuration the minimum baseline is 8 meters and the maximum is 66 meters. Table 1 summarizes the sensitivities reached for the observations of the LAEs.
2.3. PdBI Observations
All MACS0647-JD observations were carried out in 2012 November as part of a DDT (Director’s Discretionary Time) program with the Plateau de Bure Interferometer (PdBI). The target was observed with 4 WideX frequency setups (3.6 GHz bandwidth each), covering 80% of the photometric redshift range (). Two of the three lensed images (JD1 and JD2) are within of each other and they were covered in a common 2 mm pointing. The absolute flux calibrators used are MWC349, 2200+420, 3C279 and 0716+714. As gain calibrator the QSO 0716+714 was used. The total on source time for all tunings was 7.4 hours (6-antennas equivalent). The observations were processed using GILDAS. The beamsize of the observations is the following: MACS0647-JD : , PA (C configuration). For C configuration the minimum baseline is 22 meters and the maximum is 184 meters. Table 2 summarizes the sensitivity reached for the observations of MACS0647-JD .
3. Results
| source | RA | DEC | zaaReferences: IOK–1:Iye et al. (2006); Ono et al. (2012) –SDF J132415.7+273058 and SDF J132408.3+271543 : Taniguchi et al. (2005) | bbObserving Frequencies; tuned 125 MHz blueward of the Ly– redshifts for all targets. | cc1 continuum sensitivity at 158m rest wavelength. | dd1 [C II] line sensitivity over a channel width of 50 km s-1. | L[CII]ee3 [C II] luminosity limit over a channel width of 50 km s-1 assuming , where the line luminosity, , is measured in ; the velocity integrated flux, =, in Jy km s-1 ; the rest frequency, , in GHz; and the luminosity distance, , in Mpc. (e.g. Solomon et al. (1992) | Lff3 limit based on the SED of NGC 6946 and including the effect of the CMB. | SFRdust,CMBgg3 limit based on L including the effect of the CMB. | SFRUVhhUV–based SFR from Jiang et al. (2013a) |
|---|---|---|---|---|---|---|---|---|---|---|
| J2000.0 | J2000.0 | GHz | mJy b-1 | mJy b-1 | 108 L⊙ | 1011 L⊙ | M⊙ yr-1 | M⊙ yr-1 | ||
| IOK–1 | 13:23:59.80 | +27:24:56.0 | 6.965 | 238.881 | 0.19 | 1.17 | 2.05 | 6.34 | 109.1 | 24 |
| SDF J132415.7 | 13:24:15.70 | +27:30:58.0 | 6.541 | 252.154 | 0.37 | 2.82 | 4.52 | 10.3 | 177.2 | 34 |
| SDF J132408.3 | 13:24:08.30 | +27:15:43.0 | 6.554 | 251.594 | 0.75 | 5.67 | 10.56 | 21.0 | 360.9 | 15 |
Note. — All luminosities upper limits are 3 .
| Parameter | MACS0647-JD1, JD2 |
|---|---|
| Coordinates (J2000) JD1 | 06:47:55.731,+70:14:35.76 |
| Coordinates (J2000) JD2 | 06:47:53.112,+70:14:22.94 |
| (JD1+JD2) | |
| Redshift | |
| UV SFR | [M⊙yr-1] |
| 156.7-171.1 [GHz] | |
| aa1 continuum sensitivity at 158m rest wavelength. | 0.17 mJy b-1 |
| (Setup A)bb1 [C II] line sensitivity over a channel width of 50 km s-1. | 3.31 mJy b-1 |
| (Setup B)bb1 [C II] line sensitivity over a channel width of 50 km s-1. | 4.12 mJy b-1 |
| (Setup C)bb1 [C II] line sensitivity over a channel width of 50 km s-1. | 3.19 mJy b-1 |
| (Setup D)bb1 [C II] line sensitivity over a channel width of 50 km s-1. | 6.42 mJy b-1 |
| (Setup C)cc3 [C II] luminosity limit over a channel width of 50 km s-1 as in Tab. 1. The two results correspond to the most sensitive and the least sensitive setups. | |
| (Setup D)cc3 [C II] luminosity limit over a channel width of 50 km s-1 as in Tab. 1. The two results correspond to the most sensitive and the least sensitive setups. | |
| Ldd3 limit based on the SED of NGC 6946 and including the effect of the CMB. (Corrected CMB) | |
| SFR () (Corrected CMB)ee3 limit based on L including the effect of the CMB. | [M⊙yr-1] |
| SFR () (Setup C)ffBased on the De Looze et al., 2011 relation. The two results correspond to the most sensitive and the lest sensitive setups. | [M⊙yr-1] |
| SFR () (Setup D)ffBased on the De Looze et al., 2011 relation. The two results correspond to the most sensitive and the lest sensitive setups. | [M⊙yr-1] |
Note. — All luminosities upper limits are 3 .
References: Coordinates, magnification, redshift and UV-SFR from Coe et al. 2013.
All the luminosities and SFR are corrected by magnification.
3.1. Line Emission
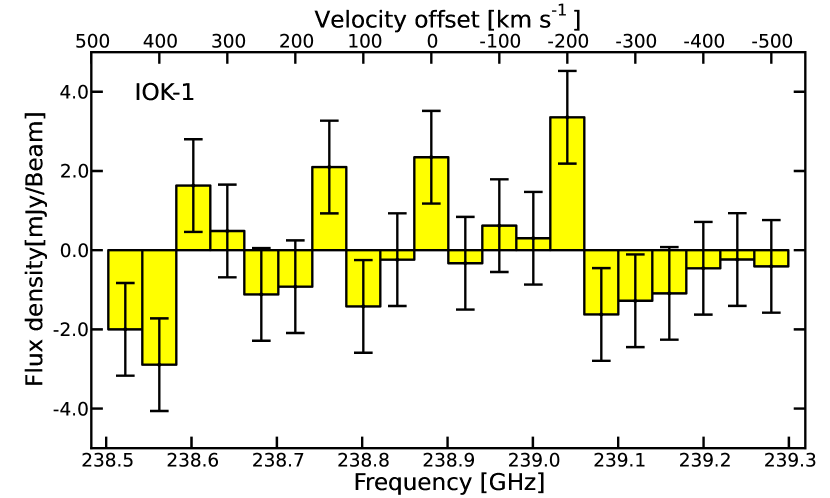
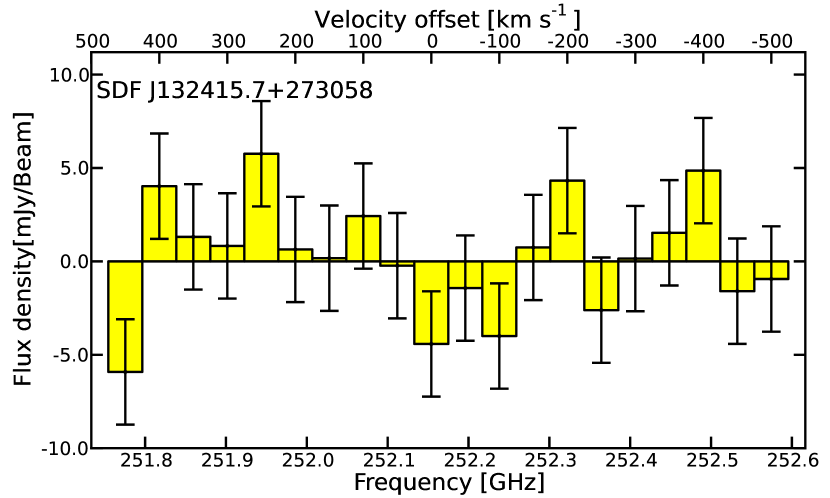
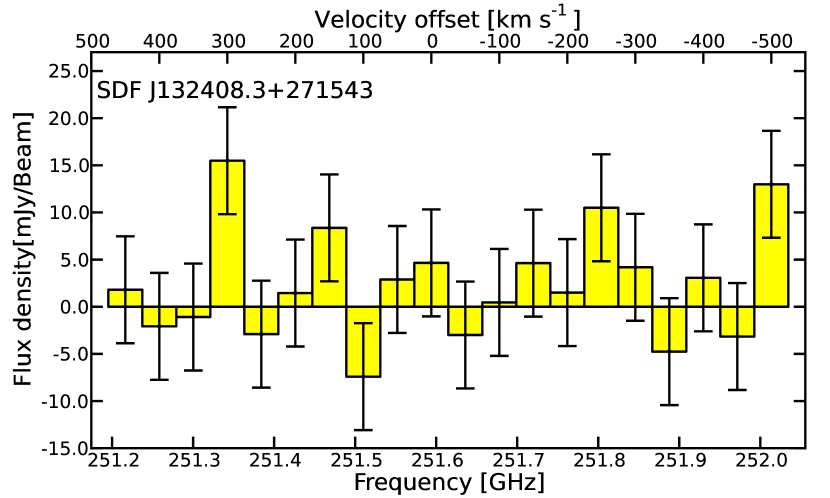
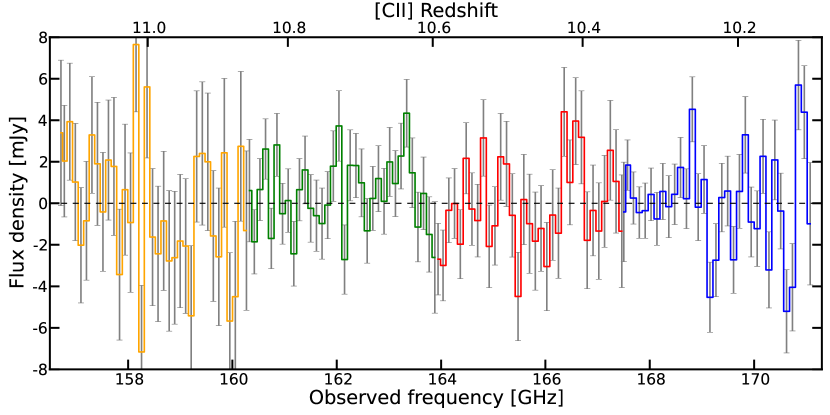
The spectra of the three LAEs are presented in Fig. 1 and the spectrum of MACS0647-JD is shown in Fig.2. No significant emission is detected at the redshifted line frequencies or close to them. The observations were sampled to a channel resolution of 50 km s-1 similar to the expected FWHM of the [C II] emission line (see Sect. 4.1). We use our non-detections to put constrains on the luminosities of the [C II] lines for all targets. The results for the LAEs can be seen in the Table 1 and for the MACS0647-JD in Table 2. The upper limits were estimated assuming that the sources were unresolved. For MACS0647-JD the spectra of the two images were corrected by the primary beam pattern before combination. The [C II] luminosities were estimated assuming that the velocity integrated flux of the line is =, with being 3 times the r.m.s. of the 50 km s-1 channel and the range in velocity (details on Tab. 1 notes). Using over a 50 km s-1 channel to estimate the upper limit in the luminosities can result in a underestimation. We point out that for a more conservative estimation the luminosities should be multiplied by a factor 2. (i.e. over 200 km s-1 channel). Assuming a channel width of 200 km s-1 , our IOK-1 [C II] limit is deeper than the previous PdBI limit (Walter et al., 2012b).
3.2. Continuum Emission
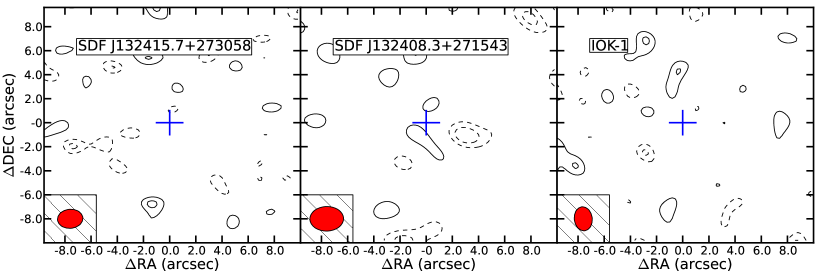
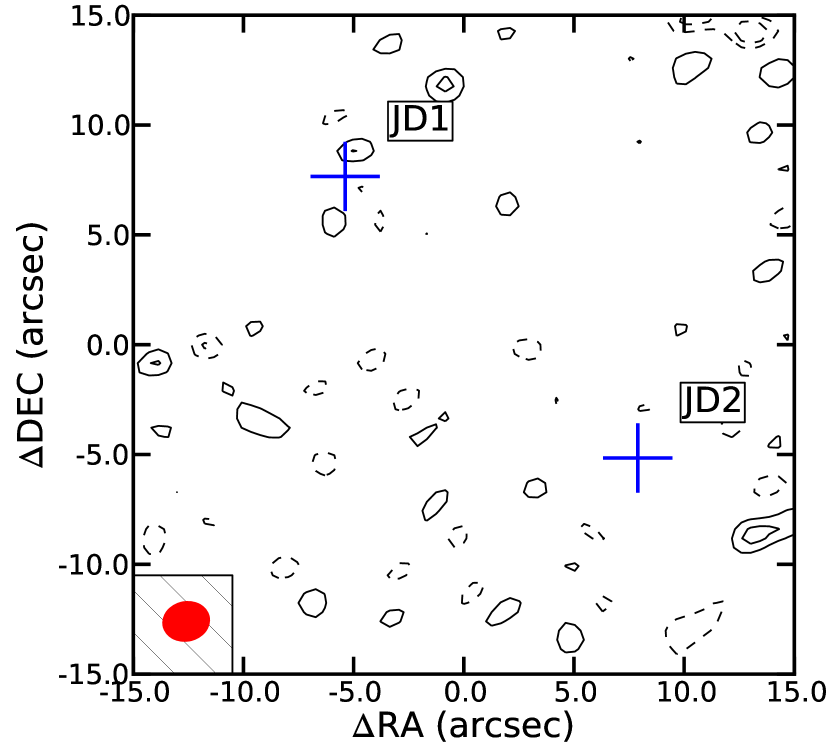
No continuum emission is detected in our observations of the three LAEs and the LBG. The sensitivity reached for the continuum observations is given in the Tab. 1 for the LAEs and a continuum map for the three LAEs is shown in Fig. 3. The results for the MACS0647-JD are given in Tab. 2 and the continuum map is shown in Fig. 4. In Sect. 4.2 we discuss how the CMB affects our continuum observations and in Sect. 4.3 we use our continuum measurements to constrain the nature of our targets.
4. Discussion
4.1. Width of the [CII] emission line.
Previous studies have presented the non-detection of [C II] (Walter et al., 2012b; Ouchi et al., 2013) with a channel resolution of 200 km s-1 , a choice motivated by the width of the Ly emission line. We argue that recent observations and models of [C II] in LAEs suggest that the [C II] line could be narrower that the previously assumed value.
4.1.1 [C II] detection on a LAE z=4.7.
In support of a the narrow emission line is the detection of [C II] in a LAE at (Ly -1) with ALMA (Carilli et al., 2013). The FWHM of the emission line is 56 km s-1 , which is one order of magnitude narrower than the width of the Ly emission line of km s-1 of the same source (Petitjean et al., 1996; Ohyama et al., 2004). Despite of the LAE being at a separation of 2.3′′ ( kpc) to the quasar BRI 1202-0725, there is no evidence for a significant influence of the quasar on the properties of the LAE from the observations. Carilli et al. (2013) tried to model the emission of the LAE taking into account the radiation coming from the luminous nearby quasar. All the models that reproduce the [C II] and Ly luminosities predict higher luminosities for other UV lines that are not detected (Ohyama et al., 2004). Given this results, they conclude that the quasar is unlikely the source of heating and ionization in the LAE.
Based on deep, spatially resolved optical spectroscopy of the LAE, Ohyama et al. (2004) argue that the LAE is likely the composition of a normal star-forming galaxy and an extended nebula with violent kinematic status. This nebula emission would produce a broadening of the Ly emission. This nebula can be explained, at least in a qualitative way, as a superwind caused by the supernovae explosion of OB stars in the late phase of the evolution of a starburst.
In conclusion, this LAE is not intrinsically different from the general population of LAE. The [C II] detection in this LAE can thus be used as a reference for [C II] searches in other LAEs at high redshift.
4.1.2 Himiko simulations.
Simulations also suggest narrow [C II] emission lines at high redshift for LAEs. Vallini et al. (2013) combine a high resolution cosmological simulation with a sub-grid multi-phase model of the interstellar medium to simulate the [C II] emission in a halo similar to the LAE Himiko at . They find that 95% of the [C II] emission is generated in the Cold Neutral Medium (CNM), mainly in clumps of individual size kpc. They present a spectrum for the simulated [C II] emission, where the FWHM of the main peak is km s-1 , very similar to the 56 km s-1 of the LAE at z=4.7. This suggests that the width of the [C II] line is to first order determined by the gravitational potential of the clumps. The [C II] emission produced in the CNM follows the gravitational potential of the clumps, resulting in narrow emission lines associated with each clumps. An ensemble of emitting clumps moving through the galaxy following the potential of the galaxy could combine and produce a broader line. Such behavior is not observed in the simulations, where just a small number of clumps dominate the [C II] emission.
We conclude that the adopted width of km s-1 for the [C II] line in LAEs agrees with recent observations and simulations. Nevertheless, we do not discard the possibility of [C II] lines being broader than our assumption, but that the occurrence of unusually narrow lines in this population appears plausible.
4.2. CMB effects.
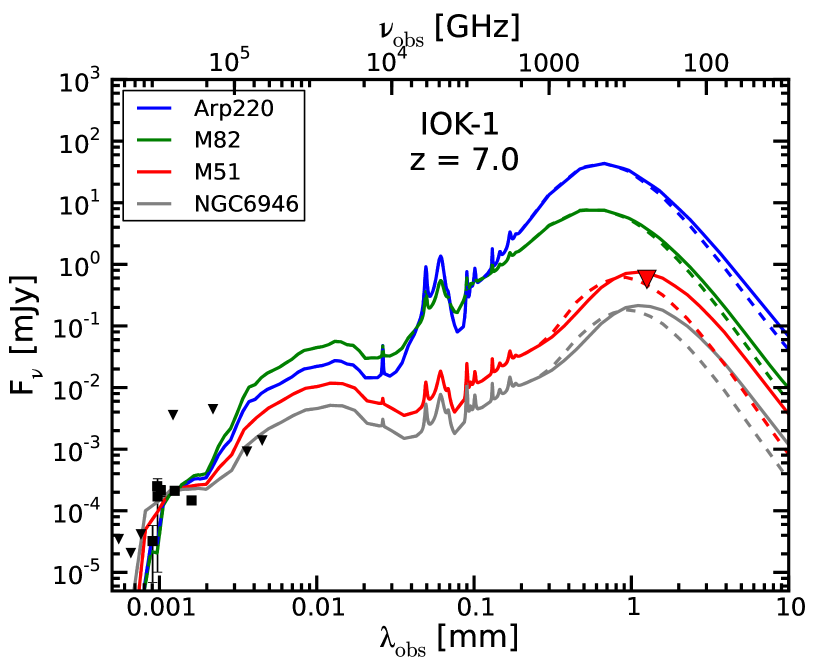
The Cosmic Microwave Background Radiation (CMB) emits as a black body with a temperature of K. The temperature of the CMB increases linearly with (), becoming an important factor to take into account for observations of objects at high redshift. da Cunha et al. (2013) showed the effect of the CMB on observations of high-redshift galaxies. Here we will follow the prescription formulated by da Cunha et al. (2013) to take into account the effects of the CMB in the continuum observations of galaxies at high redshift in the mm and sub-mm. We will apply this prescription to the SED of the local galaxies, as if they would be observed at a given redshift z.
The templates that we use are those presented by Silva et al. (1998) for the galaxies Arp 220, M82, M51 and NGC 6946. For the galaxies assume cold dust with temperature and an emissivity index . For Arp 220 we used K and (Rangwala et al., 2011), for M82 K and (Colbert et al., 1999), for M51 K and (Mentuch Cooper et al., 2012) and for NGC 6946 we used K and (Skibba et al., 2011). At a given redshift the CMB contributes to the dust heating such that the equilibrium temperature is:
| (1) |
is a measurement of the mean dust temperature as determined by a modified blackbody fit to an observed galaxy IR SED at , representing the total IR luminosity of the galaxy. As a representative fit, this is equally applicable to both optically thin galaxies and optically thick as in Arp 220. So long as the galaxy is transparent to the CMB radiation (true for even Arp 220), Eq. 1 holds. The additional heating by the CMB affects the SEDs such that the peak of the emission is shifted to a shorter wavelength and the total luminosity associated to the cold dust is higher by . We need to modify the intrinsic SED of the galaxies to include this new . The flux density depends on the black body radiation for the given temperature,
| (2) |
To include we have to apply the following factor to convert the intrinsic SED flux density to the emission associated with the new temperature .
| (3) |
This factor will only apply to the part of the SED that correspond to the emission of the cold dust. To accomplish this, we scale a modified black body (MBB) to the peak of the FIR emission of the SED at , and then use this MBB emission to estimate the ratio () of emission associated with the cold dust at a given frequency,
| (4) |
where is just the scaling factor. The flux density associated to the new temperature of the cold dust will be:
| (5) |
with
| (6) |
Finally, following da Cunha et al. (2013), we have to take into account the effect of the CMB as an observing background. For this we have to multiply the flux associated with by ,
| (7) |
resulting in the flux observed of the galaxies as:
| (8) |
with representing the effect of the CMB in the observations at a given frequency. The same corrections are derived when an optically thick emission is assumed, as in the case of Arp 220.
As we can see in Fig. 5, the effect of the CMB decreases the observable flux density at 2 mm by up to a factor of (in the case of M51) for the galaxy at , when the temperature of the CMB is higher, as expected. Also, the effect is higher for galaxies with a lower temperature of the cold dust. Galaxies with temperature of order of 25-30 K are more affected than those with temperature of 40-50 K. The CMB effects will be important for estimations of the flux densities of these type of galaxies in the continuum and for the correct interpretation of the observations.
The CMB effects on the [C II] line observations are similar to those on the continuum. The flux of an emission line observed against the CMB is:
| (9) |
with being the excitation temperature of the transition. For the case of local thermal equilibrium (LTE), when collisions dominate the excitation of the [C II] line, the excitation temperature of the transition is equal to the kinetic temperature of the gas (). The kinetic temperature varies for the different [C II] emission regions. Gas temperatures within PDRs are typically K (Stacey et al., 2010), for the CNM K, for the WNM K and for the ionized medium K(Vallini et al., 2013). Since the CMB temperature at is much lower than the gas temperature of the [C II] emitting region, it will not contribute significantly to the [C II] excitation, but must be taken into account as the background against which the line flux is measured. In most of the [C II] emission regions, the temperatures are so high that the observed flux of the line against the CMB is similar to the intrinsic flux (). For the extreme case where all the [C II] emission is being produced in PDRs with temperature of 100 K in a galaxy at , the observed flux (using Eq. 9) would be 90% of the intrinsic flux. We found this case very unlikely, since in low redshift galaxies the [C II] emission produced in PDRs is 50-70% of the total [C II] luminosity and the gas temperatures associated to the PDRs are higher (Crawford et al., 1985; Carral et al., 1994; Lord et al., 1996; Colbert et al., 1999). We conclude that the CMB effects on the [C II] line observations are negligible for our observations.
4.3. Spectral energy distribution of the galaxies.
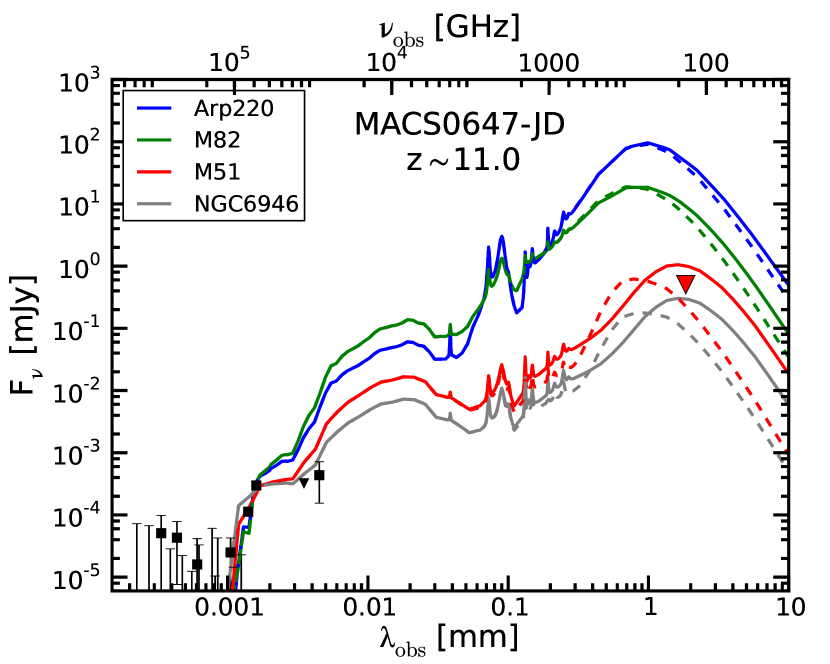
Using the upper limits on the continuum, we compare the targets with the spectral energy distribution templates of local galaxies (SEDs). For the LAEs, the SEDs of the local galaxies are scaled to the flux of a near-IR filter that is not contaminated by the Ly emission line. For MACS0647-JD , the filter used for the scaling is the one next to the Lyman Break. The photometry of IOK-1 and MACS0647-JD together with the SED of local galaxies are shown in Fig. 5. For SDF J132415.7+273058 and SDF J132408.3+271543 (not shown) the situation is very similar: the sources have a similar redshift, the continuum upper limits are comparable and the CMB effects are of the same order. Our upper limit for IOK-1 is comparable to the upper limit found by Walter et al. (2012b) using PdBI observations.
Using the SED of NGC 6946 as a template, we estimate the IR luminosity given the upper limit flux densities, similar to the approach shown by Walter et al. (2012b). We scale the SED of NGC 6946 to the 3 sigma upper limits of the mm observations and integrate from 8 to 1 mm (rest frame) to compute the IR luminosity.
The IR luminosity corresponding to this intrinsic SED and the SFR associated (Kennicutt, 1998) are given in Tab. 1 for the LAEs and in Table 2 for MACS0647-JD . We note that estimating the IR luminosity using NGC 6946 without taking into account the CMB result in a significant underestimation of the luminosity upper limits. The IR luminosity limit corrected by the CMB of the LAEs at is 35% higher than without correcting by the CMB. For IOK-1 at , the IR luminosity limit is a 50% higher than the estimation without correcting by the CMB. For MACS0647-JD at , the IR luminosity limit corrected for the CMB is times the IR luminosity limit not corrected by the CMB. For galaxies with cold dust temperature of K, the effect of the CMB on the observations is very important at high redshift, and it will significantly limit the feasibility of detecting not extremely starbursting galaxies in the IR continuum, it will not greatly affect the detectability of [C II] emission.
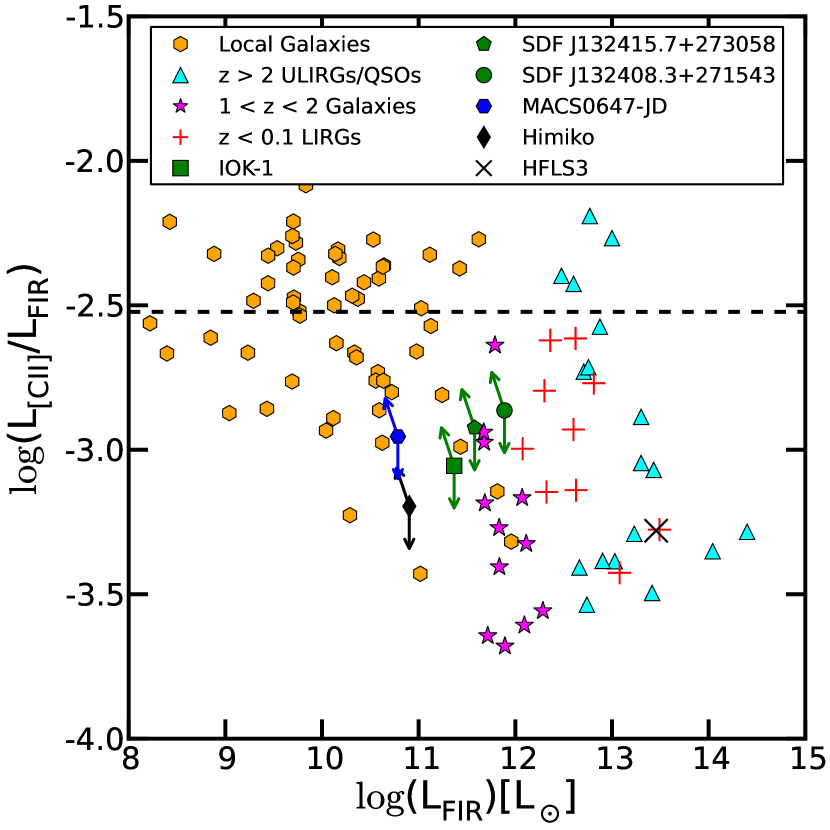
4.4. Ratio
Figure 6 presents our upper limits to and together with detections of [C II] in other galaxies. The arrows represent the region of possible values for and (integrated from to rest frame). If we used UV-based SFR estimates to infer , our data points would move across the diagonal arrows towards the region where local galaxies are, putting our upper limits close to the average value found for the local galaxies. The ratio is a measure of how efficient the [C II] emission is in cooling the gas. The values presented for our targets, , do not necessarily imply that [C II] is not efficient in cooling the gas in these galaxies, it is most likely a consequence of the galaxies having much lower FIR luminosities than our conservative upper limits. Different processes can affect the ratio . In galaxies with low extinction and low metallicity, like in Haro 11, about 50% of the [C II] emission arises from the diffuse ionized medium (Cormier et al., 2012). Variations on the fraction of [C II] emission associated with the ionized medium will also affect the ratio . In some galaxies, the internal dust extinction can affect the ratio . In Arp 220, the dust is optically thick at 158 m and can absorb part of the [C II] emission, decreasing the ratio (Rangwala et al., 2011).
Diaz-Santos et al. (2013) present the results of a survey of [C II] in luminous infrared galaxies (LIRGs) observed with the PACS instrument on board the Herschel Space Observatory. They found a tight correlation between the ratio and the far-IR continuum color, independently of their . They found that the ratio decreases as the average temperature of dust increases, suggesting that the main observable linked to the variation of is the average dust temperature. For the galaxies with dust temperatures the average ratio is , suggesting that for galaxies like NGC 6946 with a dust temperature of K, the ratio should be on the same order of magnitude. Diaz-Santos et al. (2013) also found a correlation between and luminosity surface density of the mid-IR emitting region (). LIRGs with lower ratios are warmer and more compact. We can use this relation to find a rough estimation for of our targets. As we use the size found in the UV observations of the targets. The half-light radius of IOK-1 is kpc (Cai et al., 2011). The full width at half maximum size of SDF J132415.7+273058 and SDF J132408.3+271543 are and 3.2 kpc respectively (Taniguchi et al., 2005). For MACS0647-JD the delensed half-light radius is kpc (Coe et al., 2013). Using our upper limits as an approach to we can estimate . For IOK-1 the estimated ratio is , for SDF J132415.7+273058 is and for SDF J132408.3+271543 is . For the LAEs the average of is similar to the average value for the local galaxies (Fig. 6). For MACS0647-JD the estimated ratio is .
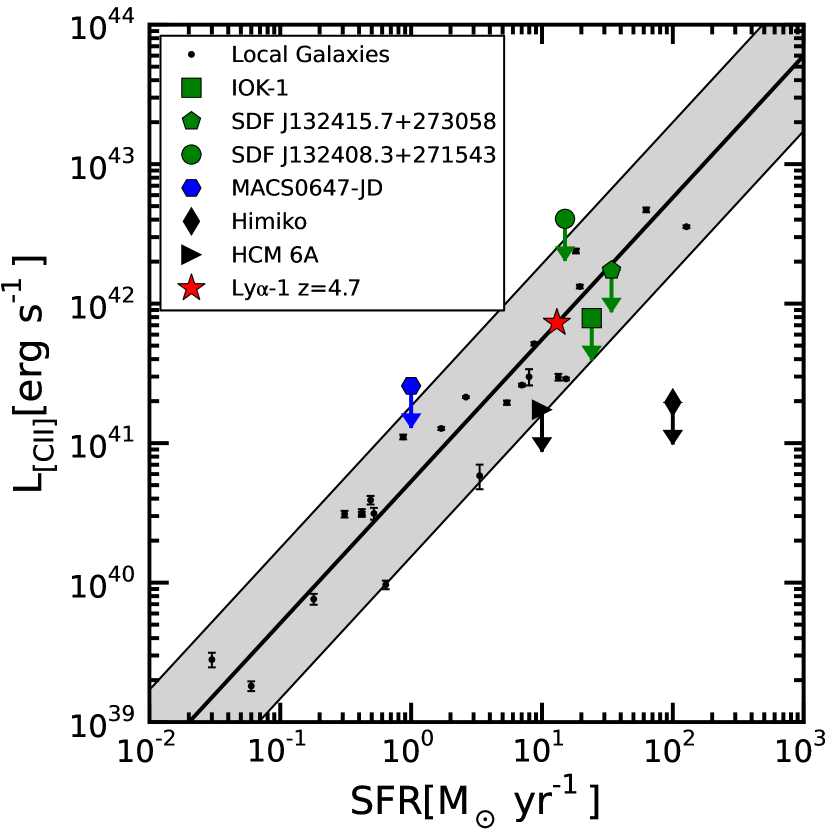
4.5. SFR- Relation
In Fig. 7 we present our upper limits with the UV-SFR estimated for the targets together with upper limits detections for published LAEs (Carilli et al., 2013; Kanekar et al., 2013; Ouchi et al., 2013). The black solid lines corresponds to the relation found by de Looze et al. (2011), with the gray area corresponding to scatter in the relation. Our upper limits for the [C II] luminosity fall within the scatter of the SFR-, with the exception of SDF J132408.3+271543 , where the upper limit falls above the relation due to the moderate depth of its observations. The detection of the LAE at z=4.7 (Ly -1) agree very well with the relation found by de Looze et al. (2011) using the UV-SFR estimated by Ohyama et al. (2004). The upper limits for the lensed LAE at HCM 6A and Himiko suggest that LAEs at could fall below the relation found at low redshift. More observations are needed to clarify if there is an intrinsic difference between the LAEs at with the higher redshift population. The high magnification of MACS0647-JD allows us to explore an UV-SFR one order of magnitude lower than the ones of the LAEs, showing the advantage of observing lensed galaxies to cover the intrinsically faint population at high redshift.
4.6. IOK-1 Models
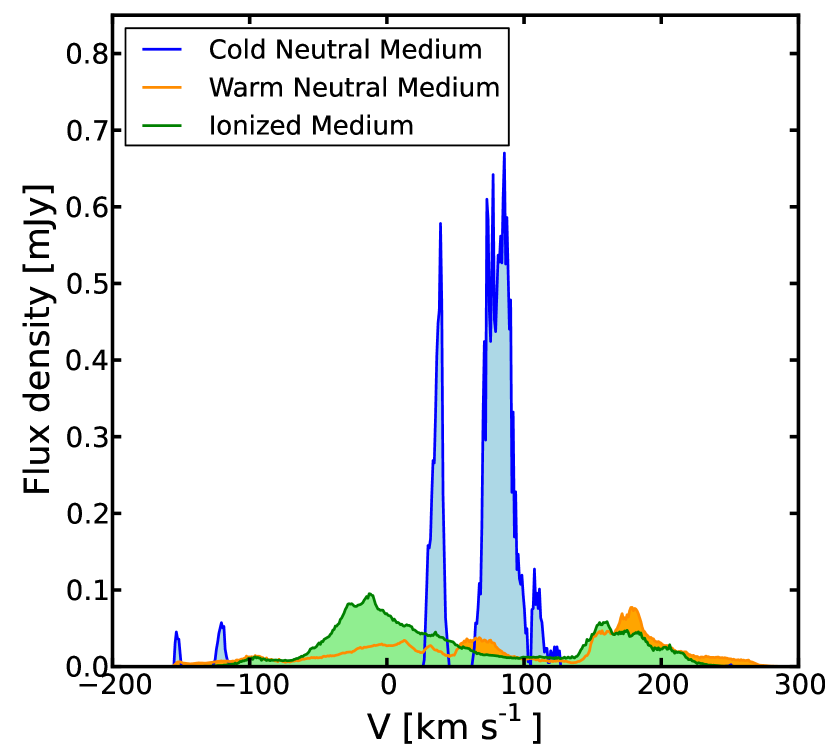
Using the same procedure presented in Vallini et al. (2013) for the [C II] emission of Himiko, we estimate the emission of [C II] for IOK-1 at . For this simulation, the star formation rate was set to 20 and a stellar population age of 10 Myr. The metallicity was set to solar to have a conservative estimation of the [C II] emission. The simulation does not include the emission from PDRs and should be seen as a lower limit. In Fig. 8, we show the [C II] emission produced by the three modeled phases, cold neutral medium (CNM), warm neutral medium (WNM) and the ionized medium. Most of the [C II] emission comes from the CNM (), the rest is coming from the WNM () and from the ionized medium (). For comparison, in Himiko, 95% of the emission is produced in the CNM and the rest in the WNM. No emission from the ionized medium was modeled in the simulation of Himiko (Vallini et al., 2013). We can also see in the emission that the FWHM of the main peak is km s-1, just as expected.
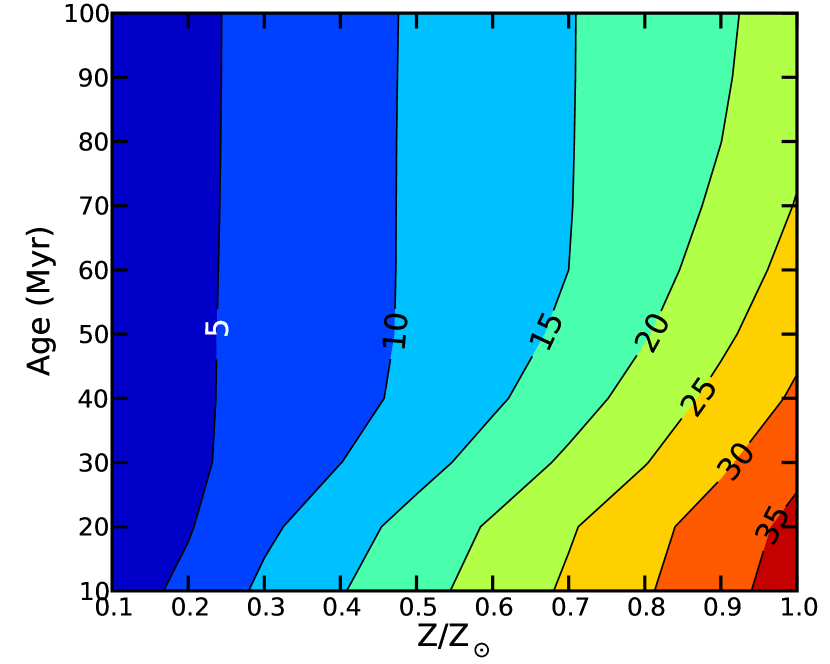
In Fig. 9, we present the integrated flux of [C II] for a different combination of metallicities and stellar population ages. This shows a strong dependency on the metallicity, which is expected, since it is treated linearly with the abundance of [C II] in the gas. The second main feature of this results is the dependency with the stellar population age. Here we assumed a continuum star formation rate of 20 , for the older stellar populations there is a higher amount of heating photons coming from the UV part of the spectrum. This is a result of using a continuum star formation mode, for a given SFR, older populations have more time generating young UV emitting stars. These extra heating photons avoid the cooling of the gas, which decrease the amount of gas in the cold neutral medium, where most of the [C II] emission is produced.
4.7. Spectral Resolution
For a Gaussian emission line, with a FWHM of 50 km s-1 observed at a channel resolution of 200 km s-1, emission lines will be significantly diluted. In the best case scenario of the line falling completely in one channel, we will recover 38% of the peak flux density of the line. This suggests to carry out observations a sufficiently high spectral resolution. E.g. with a line of FWHM of 50 km s-1 and a channel resolution of 10 km s-1, we expect to recover 97% of the peak flux density of the line.
4.8. Atomic Mass Estimation
We use Equation 1 from (Hailey-Dunsheath et al., 2010) to give rough upper limits to the atomic mass associated with PDRs in our targets (Assuming all [C II] would arise from PDRs). As approach to the PDRs conditions we use the result of Vallini et al. (2013) for the temperature and density in the CNM of Himiko, cm-3 and T=250 K. Using our upper limits for [C II] we obtain the following upper limits to the atomic mass: For IOK-1 , for SDF J132415.7+273058 , for SDF J132408.3+271543 and for MACS0647-JD . Assuming that the mass of atomic gas is similar to the mass of molecular gas, we can compare our upper limits with the measurements of similar galaxies at lower redshift.
The only molecular gas masses measured in high redshift UV-selected star-forming galaxies come from the detection of CO transition lines in lensed LBGs. The measured values are, , and for MS 1512–cB58 (), the cosmic eye () and MS1358–arc () respectively (Coppin et al., 2007; Riechers et al., 2010; Livermore et al., 2012). Our upper limits for the LAEs are similar to the values estimated for the observed LBGs. For MACS0647-JD our upper limit for the molecular mass is at least lower than in the observed LBGs.
Using the UV-SFR relation we can estimate the gas depletion timescales for our targets, assuming . We estimate upper limits for the depletion time of , and for IOK-1, SDF J132415.7+273058 and SDF J132408.3+271543 respectively. For MACS0647-JD the depletion time is . The estimated depletion times for the observed lower redshift lensed LBGs are within the range of Myr, similar to our upper limits. The depletion times for the LAEs are consistent with the ages estimated for the young population of LAEs at of Myr found by Finkelstein et al. (2009) and to the simulated LAEs at with ages Myr (Shimizu et al., 2011). The depletion times of the LBGs are consistent with the LBG-phase predicted duration of Myr (González et al., 2012).
Saintonge et al. (2013) presented molecular gas masses and depletion timescales for a sample of lensed star forming galaxies at . The range of measured molecular gas masses is and of depletion timescales is Myr. The longer depletion timescales measured for the lower-z sources could indicate that they experience less ‘extreme’ bursts of star formation in comparison to our sample. Although, assuming a higher molecular-to-atomic gas ratio (of at least 5) would put our upper limits within the values measured by Saintonge et al. (2013).
5. Summary and Outlook.
We have presented a search for [C II] emission in three LAEs at and in a LBG at using CARMA and the PdBI. We summarize our results and conclusions as follows:
-
1.
We have not detected [C II] emission line any of our targets. Given the recent observational results and simulations of the [C II] emission in high redshift LAE, we adopt a line width of 50 km s-1 for the [C II] emission. We put constrains on the luminosity of the line for the targets. For the LAEs the L[CII] upper limit are , and for IOK-1, SDF J132415.7+273058 and SDF J132408.3+271543 respectively. Our [C II] upper limits are consistent with the relation of SFR-L[CII] found by de Looze et al. (2011). The upper limit in the [C II] luminosity of MACS0647-JD is (Assuming that the redshift of the galaxy is within the most sensitive setup).
-
2.
No detection of the FIR continuum is found at a wavelength of 158 rest frame for any of the 4 targets. Assuming a spectral energy distribution template for the local galaxy NGC 6946 as a template for the high redshift galaxies observed here, we present conservatives upper limits for the FIR luminosity. We find , and as upper limits for IOK-1, SDF J132415.7+273058 and SDF J132408.3+271543 respectively, these values account for the effect of the CMB on the observations. For MACS0647-JD, the upper limit in the FIR luminosity is , after correcting for the CMB and the lensing magnification.
-
3.
We present the results of simulations supporting the brightest component of the [C II] line having a width of the order of km s-1 . Here we want to emphasize the necessity of resolving such emission lines in future ALMA observations, to not loose signal-to-noise ratio, by selecting a channel resolution that is too low.
-
4.
The effect of the CMB must to be taken into account in attempts to detect the FIR continuum in galaxies at high redshift. The heating of cold dust by CMB photons can shift the peak of the FIR continuum to values up to a microns for galaxies with temperature of K and redshift of . We emphasize that not including the effects of the CMB on the observations results in an underestimation of the FIR luminosities for the targets. The CMB corrected FIR luminosity limits are 35% higher than those without CMB correction at , 50% higher at , and 350% higher at for a T K.
-
5.
Simulations are already showing us that the task of detecting [C II] in high redshift galaxies is going to be difficult even with ALMA, as confirmed by the recent sensitive non-detection of Himiko by Ouchi et al. (2013). Accordingly to our IOK-1 simulations, a key parameter for the [C II] emission in LAEs is the metallicity, as we discussed in Sect. 4.6. If these simulations were applicable to all high redshift LAEs, we should first try to detect [C II] in the LAEs with the highest metallicity. Estimating the metallicity of LAEs at high redshift is not an easy task, however, Cowie et al. (2011) found that for the sample of LAEs discovered by the Galaxy Evolution Explorer (GALEX) grism in the redshift range of , there is an anti-correlation of the equivalent width of the H emission line with metallicity. Higher EW(H) sources all have lower metallicities, bluer colors, smaller sizes, and less extinction. Cowie et al. (2011) also found a broad general trend that for higher EW(H), the EW() is also higher. If we assume that these relations are valid for the LAEs at high redshift, and that the goal is to observe the LAE with the highest metallicity possible, it may be best to target the brightest LAE in the UV but with the lowest Ly equivalent width. Lyman-break galaxies with Ly detection may thus be ideal targets for [C II] searches at high redshift.
We thank the referee for his/her useful comments and suggestions which significantly improved the quality of this paper. We thank Brent Groves for the discussion on the effects of the CMB. Support for CARMA construction was derived from the states of California, Illinois, and Maryland, the James S. McDonnell Foundation, the Gordon and Betty Moore Foundation, the Kenneth T. and Eileen L. Norris Foundation, the University of Chicago, the Associates of the California Institute of Technology, and the National Science Foundation. Ongoing CARMA development and operations are supported by the National Science Foundation under a cooperative agreement, and by the CARMA partner universities. Based on observations with the IRAM Plateau de Bure Interferometer. IRAM is supported by INSU/CNRS (France), MPG (Germany) and IGN (Spain). LI and JG obtained partial support from CATA, Conicyt Basal program. LI and JG acknowledge support from FONDAP “Centro de Astrofísica” 15010003. LI thanks the collaboration of the CLASH team.
References
- Brammer et al. (2013) Brammer, G. B., van Dokkum, P. G., Illingworth, G. D., et al. 2013, ApJ, 765, L2
- Bouwens et al. (2011) Bouwens, R. J., Illingworth, G. D., Labbe, I., et al. 2011, Nature, 469, 504
- Cai et al. (2011) Cai, Z., Fan, X., Jiang, L., et al. 2011, ApJ, 736, L28
- Capak et al. (2013) Capak, P. L., Faisst, A., Vieira, J. D., et al. 2013, arXiv:1307.4089
- Carilli et al. (2013) Carilli, C. L., Riechers, D., Walter, F., et al. 2013, ApJ, 763, 120
- Carilli & Walter (2013) Carilli, C. L., & Walter, F. 2013, ARA&A, 51, 105
- Carral et al. (1994) Carral, P., Hollenbach, D. J., Lord, S. D., et al. 1994, ApJ, 423, 223
- Coe et al. (2013) Coe, D., Zitrin, A., Carrasco, M., et al. 2013, ApJ, 762, 32
- Colbert et al. (1999) Colbert, J. W., Malkan, M. A., Clegg, P. E., et al. 1999, ApJ, 511, 721
- Coppin et al. (2007) Coppin, K. E. K., Swinbank, A. M., Neri, R., et al. 2007, ApJ, 665, 936
- Cormier et al. (2012) Cormier, D., Lebouteiller, V., Madden, S. C., et al. 2012, A&A, 548, A20
- Cowie et al. (2011) Cowie, L. L., Barger, A. J., & Hu, E. M. 2011, ApJ, 738, 136
- Cox et al. (2011) Cox, P., Krips, M., Neri, R., et al. 2011, ApJ, 740, 63
- Crawford et al. (1985) Crawford, M. K., Genzel, R., Townes, C. H., & Watson, D. M. 1985, ApJ, 291, 755
- da Cunha et al. (2013) da Cunha, E., Groves, B., Walter, F., et al. 2013, ApJ, 766, 13
- Dayal & Ferrara (2012) Dayal, P., & Ferrara, A. 2012, MNRAS, 421, 2568
- De Breuck et al. (2011) De Breuck, C., Maiolino, R., Caselli, P., et al. 2011, A&A, 530, L8
- de Looze et al. (2011) de Looze, I., Baes, M., Bendo, G. J., Cortese, L., & Fritz, J. 2011, MNRAS, 416, 2712
- Diaz-Santos et al. (2013) Diaz-Santos, T., Armus, L., Charmandaris, V., et al. 2013, arXiv:1307.2635
- Ellis et al. (2013) Ellis, R. S., McLure, R. J., Dunlop, J. S., et al. 2013, ApJ, 763, L7
- Finkelstein et al. (2007) Finkelstein, S. L., Rhoads, J. E., Malhotra, S., Pirzkal, N., & Wang, J. 2007, ApJ, 660, 1023
- Finkelstein et al. (2009) Finkelstein, S. L., Rhoads, J. E., Malhotra, S., & Grogin, N. 2009, ApJ, 691, 465
- Fontana et al. (2010) Fontana, A., Vanzella, E., Pentericci, L., et al. 2010, ApJ, 725, L205
- Gallerani et al. (2012) Gallerani, S., Neri, R., Maiolino, R., et al. 2012, A&A, 543, A114
- Gawiser et al. (2006) Gawiser, E., van Dokkum, P. G., Gronwall, C., et al. 2006, ApJ, 642, L13
- González et al. (2012) González, J. E., Lacey, C. G., Baugh, C. M., Frenk, C. S., & Benson, A. J. 2012, MNRAS, 423, 3709
- Hailey-Dunsheath et al. (2010) Hailey-Dunsheath, S., Nikola, T., Stacey, G. J., et al. 2010, ApJ, 714, L162
- Hashimoto et al. (2013) Hashimoto, T., Ouchi, M., Shimasaku, K., et al. 2013, ApJ, 765, 70
- Iono et al. (2006) Iono, D., Yun, M. S., Elvis, M., et al. 2006, ApJ, 645, L97
- Israel et al. (1996) Israel, F. P., Maloney, P. R., Geis, N., et al. 1996, ApJ, 465, 738
- Ivison et al. (2010) Ivison, R. J., Swinbank, A. M., Swinyard, B., et al. 2010, A&A, 518, L35
- Iye et al. (2006) Iye, M., Ota, K., Kashikawa, N., et al. 2006, Nature, 443, 186
- Jiang et al. (2013a) Jiang, L., Egami, E., Mechtley, M., et al. 2013a, arXiv:1303.0024
- Jensen et al. (2013) Jensen, H., Laursen, P., Mellema, G., et al. 2013, MNRAS, 428, 1366
- Kanekar et al. (2013) Kanekar, N., Wagg, J., Ram Chary, R., & Carilli, C. L. 2013, ApJ, 771, L20
- Kennicutt (1998) Kennicutt, R. C., Jr. 1998, ARA&A, 36, 189
- Lai et al. (2008) Lai, K., Huang, J.-S., Fazio, G., et al. 2008, ApJ, 674, 70
- Livermore et al. (2012) Livermore, R. C., Swinbank, A. M., Smail, I., et al. 2012, ApJ, 758, L35
- Lord et al. (1996) Lord, S. D., Hollenbach, D. J., Haas, M. R., et al. 1996, ApJ, 465, 703
- Luhman et al. (2003) Luhman, M. L., Satyapal, S., Fischer, J., et al. 2003, ApJ, 594, 758
- Madden et al. (1997) Madden, S. C., Poglitsch, A., Geis, N., Stacey, G. J., & Townes, C. H. 1997, ApJ, 483, 200
- Maiolino et al. (2005) Maiolino, R., Cox, P., Caselli, P., et al. 2005, A&A, 440, L51
- Maiolino et al. (2009) Maiolino, R., Caselli, P., Nagao, T., et al. 2009, A&A, 500, L1
- Malhotra et al. (2001) Malhotra, S., Kaufman, M. J., Hollenbach, D., et al. 2001, ApJ, 561, 766
- Mentuch Cooper et al. (2012) Mentuch Cooper, E., Wilson, C. D., Foyle, K., et al. 2012, ApJ, 755, 165
- Negishi et al. (2001) Negishi, T., Onaka, T., Chan, K.-W., & Roellig, T. L. 2001, A&A, 375, 566
- Ohyama et al. (2004) Ohyama, Y., Taniguchi, Y., & Shioya, Y. 2004, AJ, 128, 2704
- Ono et al. (2012) Ono, Y., Ouchi, M., Mobasher, B., et al. 2012, ApJ, 744, 83
- Ota et al. (2008) Ota, K., Iye, M., Kashikawa, N., et al. 2008, ApJ, 677, 12
- Ota et al. (2010) Ota, K., Ly, C., Malkan, M. A., et al. 2010, PASJ, 62, 1167
- Oteo et al. (2012a) Oteo, I., Bongiovanni, A., Pérez García, A. M., et al. 2012a, A&A, 541, A65
- Oteo et al. (2012b) Oteo, I., Bongiovanni, A., Pérez García, A. M., et al. 2012b, ApJ, 751, 139
- Ouchi et al. (2013) Ouchi, M., Ellis, R., Ono, Y., et al. 2013, arXiv:1306.3572
- Pentericci et al. (2011) Pentericci, L., Fontana, A., Vanzella, E., et al. 2011, ApJ, 743, 132
- Petitjean et al. (1996) Petitjean, P., Pécontal, E., Valls-Gabaud, D., & Chariot, S. 1996, Nature, 380, 411
- Postman et al. (2012) Postman, M., Coe, D., Benítez, N., et al. 2012, ApJS, 199, 25
- Rangwala et al. (2011) Rangwala, N., Maloney, P. R., Glenn, J., et al. 2011, ApJ, 743, 94
- Rhoads et al. (2012) Rhoads, J. E., Hibon, P., Malhotra, S., Cooper, M., & Weiner, B. 2012, ApJ, 752, L28
- Riechers et al. (2010) Riechers, D. A., Carilli, C. L., Walter, F., & Momjian, E. 2010, ApJ, 724, L153
- Riechers et al. (2013) Riechers, D. A., Bradford, C. M., Clements, D. L., et al. 2013, Nature, 496, 329
- Saintonge et al. (2013) Saintonge, A., Lutz, D., Genzel, R., et al. 2013, ApJ, 778, 2
- Sault et al. (1995) Sault, R. J., Teuben, P. J., & Wright, M. C. H. 1995, Astronomical Data Analysis Software and Systems IV, 77, 433
- Schenker et al. (2012) Schenker, M. A., Stark, D. P., Ellis, R. S., et al. 2012, ApJ, 744, 179
- Shibuya et al. (2012) Shibuya, T., Kashikawa, N., Ota, K., et al. 2012, ApJ, 752, 114
- Shimizu et al. (2011) Shimizu, I., Yoshida, N., & Okamoto, T. 2011, MNRAS, 418, 2273
- Silva et al. (1998) Silva, L., Granato, G. L., Bressan, A., & Danese, L. 1998, ApJ, 509, 103
- Skibba et al. (2011) Skibba, R. A., Engelbracht, C. W., Dale, D., et al. 2011, ApJ, 738, 89
- Solomon et al. (1992) Solomon, P. M., Downes, D., & Radford, S. J. E. 1992, ApJ, 387, L55
- Stacey et al. (1991) Stacey, G. J., Geis, N., Genzel, R., et al. 1991, ApJ, 373, 423
- Stacey et al. (2010) Stacey, G. J., Hailey-Dunsheath, S., Ferkinhoff, C., et al. 2010, ApJ, 724, 957
- Stark et al. (2010) Stark, D. P., Ellis, R. S., Chiu, K., Ouchi, M., & Bunker, A. 2010, MNRAS, 408, 1628
- Swinbank et al. (2012) Swinbank, A. M., Karim, A., Smail, I., et al. 2012, MNRAS, 427, 1066
- Taniguchi et al. (2005) Taniguchi, Y., Ajiki, M., Nagao, T., et al. 2005, PASJ, 57, 165
- Vallini et al. (2013) Vallini, L., Gallerani, S., Ferrara, A., & Baek, S. 2013, MNRAS, 433, 1567
- Valtchanov et al. (2011) Valtchanov, I., Virdee, J., Ivison, R. J., et al. 2011, MNRAS, 415, 3473
- Vanzella et al. (2011) Vanzella, E., Pentericci, L., Fontana, A., et al. 2011, ApJ, 730, L35
- Venemans et al. (2012) Venemans, B. P., McMahon, R. G., Walter, F., et al. 2012, ApJ, 751, L25
- Wagg et al. (2010) Wagg, J., Carilli, C. L., Wilner, D. J., et al. 2010, A&A, 519, L1
- Wagg et al. (2012) Wagg, J., Wiklind, T., Carilli, C. L., et al. 2012, ApJ, 752, L30
- Walter et al. (2009) Walter, F., Riechers, D., Cox, P., et al. 2009, Nature, 457, 699
- Walter et al. (2012a) Walter, F., Decarli, R., Carilli, C., et al. 2012a, Nature, 486, 233
- Walter et al. (2012b) Walter, F., Decarli, R., Carilli, C., et al. 2012b, ApJ, 752, 93
- Wang et al. (2013) Wang, R., Wagg, J., Carilli, C. L., et al. 2013, arXiv:1302.4154
- Willott et al. (2013) Willott, C. J., Omont, A., & Bergeron, J. 2013, ApJ, 770, 13
- Zheng et al. (2012) Zheng, W., Postman, M., Zitrin, A., et al. 2012, Nature, 489, 406