From amorphous aggregates to polymer bundles:
The role of stiffness on structural phases in polymer aggregation
Abstract
We study the aggregation transition of a finite theta-polymer system in dependence on the bending stiffness with the help of parallel multicanonical simulations. In order to distinguish amorphous aggregates from polymer bundles we introduce an order parameter, measuring the correlation of the end-to-end vectors. With the help of this order parameter, we construct generic - phase diagrams for systems with and polymers and discuss the occurring phases from amorphous aggregates to bundle structures. For an intermediate stiffness range we find multiple aggregated phases which change with increasing number of polymers and discuss their nature with the help of microcanonical analyses. We show that the stiffness of semiflexible theta polymers is the distinguishing parameter for the emergent structural motifs.
pacs:
36.20.Fz 82.35.Lr 87.15.nr 87.15.-vUnderstanding the mechanism of polymer aggregation is of relevance for a wide range of research, from biophysical actin networks to the design of materials with certain mechanical properties. Another important subject is protein aggregation which is associated with several human diseases like Alzheimer’s disease, Parkinson’s disease and diabetes II Chiti2006 . In this context, the distinction between amorphous aggregates and amyloid fibrils was argued to depend on the free-energy barriers Yoshimura2012 . The concern of bundle formation has also been addressed recently in the limit of rather stiff polymers for actin networks. This includes the study of unbinding transitions for two and more parallel filaments (modeling the polymers as wormlike chains) KierfeldBundles , the twisting of filaments in a (wormlike) bundle model FreyWLCBundles ; GrasonBunldes ; Turner2003 , and a theoretical discussion of the influence of kinetics leading to the proposition of an experiment to study this explicitly Kraikivski2008 . Since biopolymers are rather stiff, the question arises as to which properties can be associated to stiffness alone.
More generally, it is of great interest to unravel which properties can be reproduced already with a simple, generic model of theta polymers relying merely on excluded volume, short-range attraction and stiffness. Coarse-grained models for short peptides were used to show that the aggregation of peptides is a phase-separation process JunghansPeptide . Similarly for exemplary semiflexible polymers, it was shown that the aggregation transition may be accompanied by an additional freezing transition depending on the stiffness JunghansPolymer . A single semiflexible polymer has been studied using mean-field calculations Orland1996 and PERM chain-growth simulations of lattice models Grassberger1997 ; Prellberg2010 finding essentially an extended, a collapsed and a solid phase. Using a comparably short off-lattice bead-spring polymer, it has only recently been shown that already for a mer the effect of stiffness leads to a phase diagram with a multitude of conformational phases, ranging from globular to toroidal structures Seaton2013 . Another generic model, the tubelike polymer, shows a similar broad spectrum of complex conformations MaritanTubeLike ; VogelTubeLike ; MaritanTubeLikeSpecific ; BanavarTubeLikeMany , depending on its radius of curvature controlling the stiffness. With additional specific interactions MaritanTubeLikeSpecific , the model has been recently applied to protein aggregation AuerAggregation .
In this study, we consider a semiflexible theta-polymer model which leads to a complex interplay of collapse and aggregation with stiffness. We investigate the full semiflexible range of polymer aggregation, from flexible to stiff. Addressing the necessity to distinguish amorphous aggregates from polymer bundles, we introduce an order parameter measuring the correlation between the polymer end-to-end vectors. Our results suggest that the polymer stiffness plays a key role in whether the system forms an amorphous aggregate or a correlated polymer bundle.
The coarse graining of semiflexible polymers leads to a variety of models ranging from lattice to continuum formulations. We employed a common bead-spring model with additional bending stiffness. Here, the elastic bonds are described by the finitely extensible nonlinear elastic (FENE) potential , where we set , and following Binder2001 ; Schnabel2009 . All other nonbonded monomer-monomer interactions are modeled by the Lennard-Jones potential with , and cutoff at . In order to avoid a jump in the energy, the Lennard-Jones potential is shifted by . In accordance with Ref. JunghansPolymer , there is no distinction between intra-chain contacts and inter-chain contacts. The Lennard-Jones interaction accounts for self- and mutual-avoidance and sets the scale of short-range attraction. The bending stiffness is modeled by an energy contribution from the discretized curvature of the polymers , where is the angle between neighboring bonds. We measure and other energies in units of and lengths in units of the bond length . For typical interaction energies ( Martini2007 ) room temperature corresponds to in our dimensionless units (where ). The polymer system was simulated in a cubic box of extension with periodic boundary conditions at fixed density , where is the number of polymers of length . In this study we considered and .
Despite the simplicity of this model, the extended parameter space requires the use of state of the art simulation methods such as Wang-Landau sampling WangLandau or the multicanonical method MUCA ; Janke1998 . We applied a novel parallelization of the multicanonical method ZierenbergPMUCA with up to cores, sampling a broad temperature range for many values in the desired region from flexible to stiff polymers. This will be achieved by introducing a weight function that is iteratively adapted so that updates () which are accepted with probability lead to a flat energy distribution. We considered a combined set of updates including simple single-monomer shifts, bond rotations and polymer translation but also the more sophisticated double bridging move, which proved to be important especially in the amorphous region. In addition, we applied adapted variable update ranges with bias correction Schnabel2011Adv to optimize the acceptance rates in every part of the energy landscape. The canonical and microcanonical averages are obtained afterwards by standard reweighting techniques.
In order to distinguish the occurring phases, we considered the heat capacity , a “phase” separation parameter and our new order parameter. The heat capacity is defined as the temperature derivative of the energy and can be obtained from its thermal fluctuations , with the inverse temperature . The “phase” separation parameter is defined as radius of gyration of the center of masses of individual polymers JunghansPeptide ; JunghansPolymer , namely . This parameter will be small if all polymers are close together in an aggregate; and large if separated in the soluble phase. In addition, amorphous aggregates should be distinguished from correlated structures such as bundles or ordered sheets. It can be observed that in the case of stiff polymer bundles, the end-to-end vectors (normalized to unit length) of the individual polymers are highly correlated, since the polymers align parallel. On the other hand, when the polymers are separated or in the amorphous phase, the end-to-end vectors are uncorrelated and their relative orientation is random. This is why we introduce an end-to-end correlation parameter normalized in such a way that for uncorrelated vectors the parameter assumes the value while it tends to in the correlated case:
| (1) |
Alternatively, one may consider the nematic order parameter Allen1993 at the additional cost of computing a full bond-bond interaction tensor.
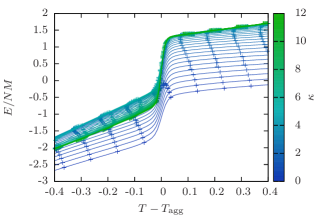
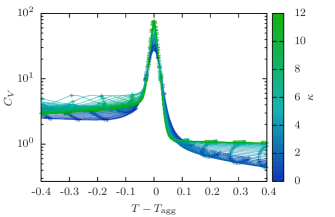
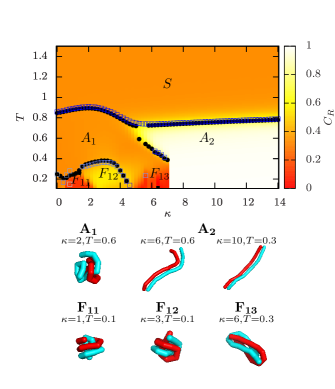
Figure 1 shows the average energy and the heat capacity for a system of 8 polymers in the canonical ensemble at various stiffnesses (encoded in the line color). For clarity, we shifted the temperature axis to center around , defined as the temperature of the largest peak in . We obtained the error bars from time-series reweighting and the lines with higher resolution from histogram reweighting. The sharp drop in energy and the peak in the heat capacity show that the aggregation transition of 8 short semiflexible polymers is a discontinuous transition between an entropy dominated, soluble regime at high and an energy dominated, aggregated regime at low . On closer inspection, we observe that the size of the energy jump increases with stiffness as does the peak of the heat capacity. Below the aggregation transition, we observe less pronounced peaks indicating continuous phase transformations which will be discussed below.
A possible way to investigate the thermodynamics of large-scale systems is to study the limit of an increasing number of polymer chains, considering the polymer length as a fixed chemical property Zierenberg2014JCP . For a detailed range, this is clearly unfeasible with the current computational resources. A finite-size scaling study would have to focus on a few values that may be chosen from the following diagrams.
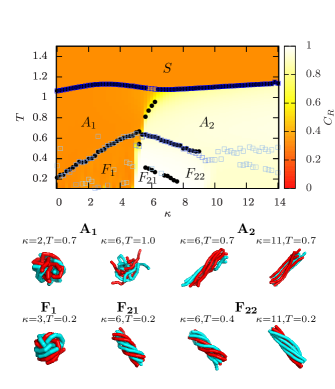
Our main results are presented as “phase”-diagrams in Fig. 2 (mers) and Fig. 3 (mers). Since the systems are finite, the (pseudo) transitions between structural phases should not be confused with thermodynamic phase transitions (which would require taking the thermodynamic limit). Instead, both structural phase diagrams give an overview of what happens in the aggregation process of an entire class of semiflexible polymers over a wide temperature and stiffness range. We obtained the diagrams from extensive parallel multicanonical simulations at fixed values in the interval with . This clearly covers the range from flexible () to rather stiff () polymers. The obtained picture is supported by exemplary simulations for longer and more chains. Even with our advanced techniques, the computational effort is still demanding and cannot easily be increased. The phase diagrams show the landscape of the end-to-end correlation parameter , combined with transition points determined from the peak locations of the heat capacity (black dots) and the temperature derivative of the phase separation parameter (blue squares). In the latter case, the squares are color coded from dark blue (rather strong signals) to light blue (rather weak signals, which in some cases may be merely small fluctuations without physical significance). In addition, we present typical conformations from different regions for selected and .
We distinguish between the fragmented or soluble phase (), in which all polymers are independent of each other; the aggregated phases (), where all polymers are located close to each other; and the “frozen” phases (), which occur when lowering the temperature even further. The term “frozen” refers to rather well-ordered structures compared to fluctuating conformations in the phases. At the aggregation transition, we observe the peaks in the heat capacity and the temperature derivative of the phase separation parameter close to each other, this being typical for first-order like transitions. In both phase diagrams we can clearly see that rather flexible polymers (low ) aggregate into a phase where is roughly , while for stiff polymers the aggregated phase is described by . Looking at typical conformations we observe amorphous structures for aggregates of rather flexible polymers () and stretched bundles for stiffer polymers (). Going to even lower temperatures, stiff polymers rearrange within the bundle phase whereas more flexible polymers show an additional “freezing” transition similar to the single polymer case MaritanTubeLike ; VogelTubeLike ; Schnabel2009 ; Seaton2013 but with the additional possibility to wrap around each other.
Following the characterization of the aggregated phases via the end-to-end correlation, the “frozen” phases are labeled for different subphases showing uncorrelated conformations and for distinguishable subphases that show bundle like characteristics. In the latter case, typical conformations of this correlated aggregate may be described as twisted rods, recapturing the qualitative behavior of the wormlike bundle model FreyWLCBundles for sufficiently large stiffness at fixed . Using a twisted-bundle parameterization, we verified that at zero temperature the energy minimum is lower than that for parallel rods. This can be explained by the large energetic gain from maximizing Lennard-Jones contacts when parallel bundles are twisted compared to the energetic loss from bending. This is in agreement with analytic considerations of twisted fibers Turner2003 and numeric studies on several tubelike polymers BanavarTubeLikeMany . In this regime of rather stiff theta polymers, the (discrete) wormlike chain is a good approximation and we may express the persistence length to leading-order as .111 Note that for rather flexible theta polymers, there has been a recent debate on the definition of the persistence length BinderLp . Hence, within the bundle phase of our diagrams the length ratio is of order unity. This matches typical scales of amyloid fibrils, where the pitch length is of the order of the protofibril length (which, however, are both much larger) Serpell2000 . Additional specific interactions such as hydrogen bonds and hydrophobic effects may stabilize or destabilize structural motifs. This has been shown for single proteins within the tubelike model MaritanTubeLikeSpecific ; and applied to peptide aggregation it was possible to reproduce stable fibrillar structures AuerAggregation .
There is an intermediate regime for the two system sizes, where an additional transition below the aggregation temperature differs noticeably from to polymers. By lowering the temperature, polymers in this region show an initial correlation followed by a decorrelation of the end-to-end vectors. While typical conformations in the initial correlated phase (Fig. 2, ) could be described as elongated aggregates, the conformations in the uncorrelated phase (Fig. 2, ) show a different structure that reminds of entangled hairpins. These structures occasionally occur in the initial aggregated phase but become more probable at lower temperatures. The entangled hairpins may have a slight twist and in some cases the U-like polymer structures entangle perpendicularly (). For polymers in this regime (not shown here) we observe a similar behavior aggregating first into a correlated phase followed by a decorrelated phase, while polymers demonstrate the reverse situation. For example along , with decreasing temperature the aggregation transition first results in an uncorrelated, or amorphous-like, aggregate (Fig. 3, ). Lowering the temperature further, the end-to-end vectors start to correlate and the polymers form bundles (Fig. 3, ). At even lower temperatures, the polymer bundles undergo an additional structural transition into the frozen phases and . Notice that varying at fixed low leads to a narrow crossover from amorphous aggregates to polymer bundles at about for and for .
In order to investigate the difference between and interacting polymers in more detail, we employed a microcanonical analysis Microcanonical ; MicroJanke , which was proven to be particularly suitable for the study of structural phases in finite systems JunghansPeptide ; JunghansPolymer ; Schnabel2011 . In order to achieve this, we took advantage of the employed generalized ensemble simulations which enable us to calculate the microcanonical entropy , up to an additive constant, together with its first and second derivatives. The first derivative yields the microcanonical caloric inverse temperature which encodes first- and second-order transitions in its inflection points. These points are seen in the second derivative as maxima with for first-order transitions and for second-order transitions Schnabel2011 . Note that this is just the inverse microcanonical specific heat, . Since the canonical energy is increasing with temperature, transitions at lower energies may be associated with transitions at lower temperatures.
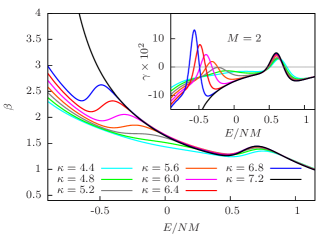
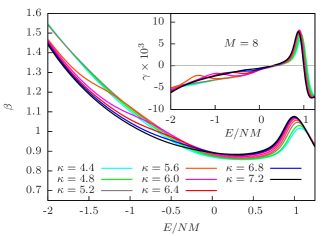
Figure 4 shows and for several values in the intermediate regime for and polymers. In both cases, we can see a first-order signature ( peak) for the aggregation transition at larger energies. Also, an additional peak appears at lower energies for the intermediate regime from to consistent with the observation from the canonical picture, which vanishes for smaller or larger . This transition shows a clear difference between the case of and polymers. For 2 polymers and low the peak at smaller energies is weak and below zero, suggesting a second-order transition, while for larger the peak becomes pronounced and larger than zero indicating a first-order transition from correlated polymers directly into the “frozen“ entangled-hairpin phase (). In the case of 8 polymers the (less pronounced) peak at lower energies is below zero indicating that the corresponding transition from amorphous aggregates to polymer bundles () is of second order.
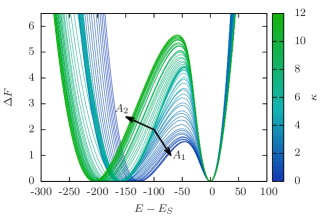
Finally, having settled the first-order nature of the aggregation transition, we address the question of the free-energy barrier accompanying such a transition. Figure 5 shows an example of the 8 polymer system. The free energy is obtained from the energy probability distribution at equal-height temperature , namely and . The minima of this free energy correspond to the equilibrium phases at coexistence, the soluble () phase at and the aggregated () phase at . Already for this finite system size, the existence of a local maximum, or barrier, between these two phases reconfirms the first-order nature. The barrier in the free energy clearly depends monotonically on the stiffness. This supports the claim that the free-energy barrier for amorphous aggregation is lower than for aggregation into bundles Yoshimura2012 . In addition, one may qualitatively distinguish the amorphous regime (blue) from the bundle regime (green), indicated by the two arrows in Fig. 5.
In summary, employing sophisticated simulation and analysis methods rooted in a generalized ensemble approach, we have been able to map out the generic - “phase” diagram, from flexible to stiff polymer systems with 2 and 8 short polymer chains. The thus obtained systematic overview emphasises the key role of stiffness in polymer aggregation, leading from amorphous aggregates to correlated structures such as polymer bundles. In the intermediate stiffness regime, we identified two aggregated phases at constant stiffness, separated (for larger systems) by a second-order like transition as indicated by the microcanonical analysis. For the first-order aggregation transition of the 8 polymer system, we provided strong evidence that the free-energy barrier for the transition to polymer bundles is indeed higher than for the transition into amorphous aggregates, as discussed recently in a slightly different context. Our systematic study supports the claim that the combination of excluded volume and short-range attraction with stiffness is the basic mechanism for the formation of this variety of structural motifs. Similar motifs occur, e.g., after bundling into mature amyloid fibrils Talaga2008 and within viruses Noda2006 . In the context of material design, it has been observed for patchy particles Glotzer2004 and upon adsorption to nano-wires Vogel2004 . In general, such a behavior is quite generic for biopolymers, which typically show rather stiff characteristics.
Acknowledgements.
We would like to thank Thierry Platini for helpful discussions on the introduced order parameter and Martin Marenz for the joint development of a Monte Carlo Simulation Framework. The computing time provided by the John von Neumann Institute for Computing (NIC) under grant No. HLZ21 on the supercomputer JUROPA at Jülich Supercomputing Centre (JSC) is gratefully acknowledged. This work has been partially supported by the Leipzig Graduate School of Excellence GSC185 “BuildMoNa”, the Collaborative Research Center SFB/TRR 102 (project B04) and the Deutsch-Französische Hochschule (DFH-UFA) under grant No. CDFA-02-07. The project was funded by the European Union and the Free State of Saxony.References
- (1) F. Chiti and C. M. Dobson, Annu. Rev. Biochem. 75, 333 (2006).
- (2) Y. Yoshimura, Y. Lin, H. Yagi, Y. H. Lee, H. Kitayama, K. Sakurai, M. So, H. Ogi, H. Naiki, and Y. Goto, Proc. Natl. Acad. Sci. U. S. A. 109, 14446 (2012).
- (3) J. Kierfeld and R. Lipowsky, Europhys. Lett. 62, 285 (2003); J. Kierfeld, T. Kühne, and R. Lipowsky, Phys. Rev. Lett. 95, 038102 (2005); J. Kierfeld, Phys. Rev. Lett. 97, 058302 (2006).
- (4) C. Heussinger, F. Schüller, and E. Frey, Phys. Rev. E 81, 021904 (2010).
- (5) G. M. Grason and R. F. Bruinsma, Phys. Rev. Lett. 99, 098101 (2007).
- (6) M. S. Turner, R. W. Briehl, F. A. Ferrone, and R. Josephs, Phys. Rev. Lett. 90, 128103 (2003).
- (7) P. Kraikivski, B. M. Slepchenko, and I. L. Novak, Phys. Rev. Lett. 101, 128102 (2008).
- (8) C. Junghans, M. Bachmann, and W. Janke, Phys. Rev. Lett. 97, 218103 (2006); J. Chem. Phys. 128, 085103 (2008).
- (9) C. Junghans, M. Bachmann, and W. Janke, Europhys. Lett. 87, 40002 (2009).
- (10) S. Doniach, T. Garel, and H. Orland, J. Chem. Phys. 105, 1601 (1996).
- (11) U. Bastolla and P. Grassberger, J. Stat. Phys. 89, 1061 (1997).
- (12) J. Krawczyk, A. L. Owczarek, and T. Prellberg, Physica A 389, 1619 (2010).
- (13) D. T. Seaton, S. Schnabel, D. P. Landau, and M. Bachmann, Phys. Rev. Lett. 110, 028103 (2013).
- (14) A. Maritan, C. Micheletti, A. Trovato, and J. R. Banavar, Nature 406, 287 (2000); J. R. Banavar and A. Maritan, Rev. Mod. Phys. 75, 23 (2003).
- (15) T. Vogel, T. Neuhaus, M. Bachmann, and W. Janke, Europhys. Lett. 85, 10003 (2009); Phys. Rev. E 80, 011802 (2009); Eur. Phys. J. E 30, 7 (2009).
- (16) T. X. Hoang, A. Trovato, F. Seno, J. R. Banavar, and A. Maritan, Proc. Natl. Acad. Sci. U.S.A. 101, 7960 (2004); T. X. Hoang, L. Marsella, A. Trovato, F. Seno, J. R. Banavar, and A. Maritan, Proc. Natl. Acad. Sci. U.S.A. 103, 6883 (2006).
- (17) J. R. Banavar, T. X. Hoang, J. H. Maddocks, A. Maritan, C. Poletto, A. Stasiak, and A. Trovato, Proc. Natl. Acad. Sci. U.S.A. 104, 17283 (2007).
- (18) S. Auer, C. M. Dobson, M. Vendruscolo, and A. Maritan, Phys. Rev. Lett. 101, 258101 (2008); S. Auer and D. Kashchiev, Phys. Rev. Lett. 104, 168105 (2010).
- (19) A. Milchev, A. Bhattacharaya, and K. Binder, Macromolecules 34, 1881 (2001).
- (20) S. Schnabel, M. Bachmann, and W. Janke, J. Chem. Phys. 131, 124904 (2009).
- (21) S. J. Marrink, H. J. Risselada, S. Yefimov, D. P. Tieleman, and A. H. de Vries, J. Phys. Chem. B 111, 7812 (2007).
- (22) F. Wang and D. P. Landau, Phys. Rev. Lett. 86, 2050 (2001); Phys. Rev. E 64, 056101 (2001).
- (23) B. A. Berg and T. Neuhaus, Phys. Lett. B 267, 249 (1991); Phys. Rev. Lett. 68, 9 (1992).
- (24) W. Janke, Int. J. Mod. Phys. C 03, 1137 (1992); Physica A 254, 164 (1998).
- (25) J. Zierenberg, M. Marenz, and W. Janke, Comput. Phys. Comm. 184, 1155 (2013).
- (26) S. Schnabel, W. Janke, and M. Bachmann, J. Comput. Phys. 230, 4454 (2011).
- (27) M. P. Allen, G. T. Evans, D. Frenkel, and B. M. Mulder, Adv. Chem. Phys. 86, 1 (1993).
- (28) J. Zierenberg, M. Mueller, P. Schierz, M. Marenz, and W. Janke, J. Chem. Phys. 141, 114908 (2014).
- (29) H.-P. Hsu, W. Paul, and K. Binder, Macromolecules 43, 3094 (2010).
- (30) L. C. Serpell, Biochimica et Biophysica Acta 1502, 16 (2000).
- (31) D. H. E. Gross, Microcanonical Thermodynamics (World Scientific, Singapore, 2001).
- (32) W. Janke, Nucl. Phys. B (Proc. Suppl.) 63 A-C, 631 (1998).
- (33) S. Schnabel, D. T. Seaton, D. P. Landau, and M. Bachmann, Phys. Rev. E 84, 011127 (2011).
- (34) J. T. Giurleo, X. He, and D. S. Talaga, J. Mol. Biol. 381, 1332 (2008); http://talaga.rutgers.edu/research/ images/Amyloid%20Mechanisms-2.jpg.
- (35) T. Noda, H. Sagara, A. Yen, A. Takada, H. Kida, R. H. Cheng, and Y. Kawaoka, Nature 439, 490 (2006).
- (36) Z. Zhang and S. C. Glotzer, Nano Lett. 4, 1407 (2004).
- (37) T. Vogel and M. Bachmann, Phys. Rev. Lett. 104, 198302 (2010).