Observations of environmental quenching in groups in the 11 Gyr since : different quenching for central and satellite galaxies
Abstract
We present direct observational evidence for star formation quenching in galaxy groups in the redshift range . We utilize a large sample of nearly 6000 groups, selected by fixed cumulative number density from three photometric catalogs, to follow the evolving quiescent fractions of central and satellite galaxies over roughly 11 Gyr. At , central galaxies in our sample range in stellar mass from Milky Way/M31 analogs () to nearby massive ellipticals (). Satellite galaxies in the same groups reach masses as low as twice that of the Large Magellanic Cloud (). Using statistical background subtraction, we measure the average rest-frame colors of galaxies in our groups and calculate the evolving quiescent fractions of centrals and satellites over seven redshift bins. Our analysis shows clear evidence for star formation quenching in group halos, with a different quenching onset for centrals and their satellite galaxies. Using halo mass estimates for our central galaxies, we find that star formation shuts off in centrals when typical halo masses reach between and , consistent with predictions from the halo quenching model. In contrast, satellite galaxies in the same groups most likely undergo quenching by environmental processes, whose onset is delayed with respect to their central galaxy. Although star formation is suppressed in all galaxies over time, the processes that govern quenching are different for centrals and satellites. While mass plays an important role in determining the star formation activity of central galaxies, quenching in satellite galaxies is dominated by the environment in which they reside.
Subject headings:
galaxies: evolution - galaxies: groups: general - galaxies: star formation1. Introduction
††13 NSF Astronomy and Astrophysics Postdoctoral Fellow ††margin:
Star formation activity in galaxies at low redshift varies strongly with local environment. Correlations between local galaxy density and star formation tracers (e.g., star formation rates, stellar colors, morphology) have long been observed in the nearby universe (e.g., Oemler 1974; Dressler 1980; Kauffmann et al. 2004; Hogg et al. 2004; Blanton et al. 2005a; Thomas et al. 2005). Many physical mechanisms have been shown to be relevant for regulating star formation in dense environments by driving cold gas away from galaxies and by heating it up. The high fraction of non star forming galaxies in clusters and massive groups implies that such mechanisms have already acted to quench star formation in low redshift halos.
Tremendous effort has been devoted in recent years to analyses of galaxy groups and lower mass environments. While such studies find that the properties of galaxies in groups are indeed different than those of field galaxies (e.g., Zabludoff & Mulchaey 1998; Balogh et al. 2004, 2009; Wilman et al. 2005; Weinmann et al. 2006; Cooper et al. 2007; Tran et al. 2009; Patel et al. 2009, 2011; Bolzonella et al. 2010; Peng et al. 2010; Kovač et al. 2010; McGee et al. 2011; Quadri et al. 2012; Muzzin et al. 2012; Geha et al. 2012; Rasmussen et al. 2012; Hou et al. 2013), it appears that environmental processes do not influence all galaxies equally (e.g., Yang et al. 2005; van den Bosch et al. 2008; Font et al. 2008; Skibba & Sheth 2009; Skibba 2009; Guo et al. 2009; Peng et al. 2012; Wetzel et al. 2012, 2013; Knobel et al. 2013; Woo et al. 2013; Carollo et al. 2013).
Central galaxies, defined as the most massive galaxies in their group or cluster, are affected by processes whose star formation quenching efficiency is proportional to the mass of the surrounding host halo. Such processes can act on the central galaxy itself (e.g., active galactic nuclei: Kauffmann et al. 2000; Springel et al. 2005; Hopkins et al. 2006; Fabian et al. 2012) or they can influence galaxies on halo scales (e.g., halo-quenching: Birnboim & Dekel 2003; Dekel & Birnboim 2006). In addition to being affected by the same processes, satellite galaxies in groups and clusters are also subject to gas and stellar stripping, strangulation and harassment, all of which contribute to a gradual shut off of star formation (e.g., Gunn & Gott 1972; Larson et al. 1980; Farouki & Shapiro 1981; Byrd & Valtonen 1990; Moore et al. 1996; Balogh et al. 2000). Such interactions take place between satellite galaxies or between satellites and the host halo itself, and are sensitive to the varying local gas and galaxy density in the halo.
Internal processes are likely also important drivers of star formation quenching in all galaxies. Recent studies find that structural properties of galaxies, such as central mass density and bulge-to-total mass ratio, are correlated with star formation activity at low and high redshift (e.g., Cheung et al. 2012; Fang et al. 2013; Barro et al. 2013). In addition, stellar velocity dispersion was found to be a good proxy for galaxy color and star formation activity, essentially linking the inner stellar body with the host dark matter halo (e.g., Franx et al. 2008; Wake et al. 2012; Bezanson et al. 2012; Weinmann et al. 2013). Such correlations indicate that the local properties of galaxies pose essential conditions for star formation suppression.
Here we perform a statistical analysis of galaxies in groups at . Since groups assemble and evolve later than massive clusters, quenching processes are still important even at relatively late times. We are able to explore the average properties of central and satellite galaxies over a large redshift range using only photometric catalogs and statistical background subtraction. This approach is useful for deriving the evolution of galaxy properties without the need of spectra (e.g., Masjedi et al. 2006, 2008; Watson et al. 2012; Tal et al. 2012, 2013; Wang & White 2012; Mármol-Queraltó et al. 2012, 2013). This may currently be the most efficient way to study galaxy group halos even at moderate redshift.
Throughout the paper we adopt the following cosmological parameters: , and km s-1 Mpc-1.
2. Photometric catalogs and Sample Selection
Galaxies for this study were selected at from three datasets, utilizing data from four surveys: UltraVISTA (McCracken et al. 2012), 3D-HST (Brammer et al. 2012), Cosmic Assembly Near-infrared Deep Extragalactic Legacy Survey (CANDELS; Grogin et al. 2011), and Sloan Digital Sky Survey (SDSS; York et al. 2000).
Low redshift galaxies were selected at from the NYU Value-Added Galaxy Catalog (NYU-VAG; Blanton et al. 2005b), which was derived using imaging and spectroscopic data from the seventh data release of SDSS (Abazajian et al. 2009) and imaging data from the Two Micron All Sky Survey (Skrutskie et al. 2006). Redshifts were determined spectroscopically as part of SDSS for roughly 94% of the galaxies in that catalog while the rest of the galaxies were assigned the same redshift measurement as their nearest spectroscopic neighbor. All galaxies in our low redshift sample are more massive than , the stellar mass completeness limit at (e.g., Wake et al. 2012).
Galaxies in the redshift range were identified from a public -selected catalog (Muzzin et al. 2013b) based on the first data release of UltraVISTA, an ongoing ultra deep near-infrared survey with the European Southern Observatory VISTA survey telescope. The catalog covers a total area of 1.62 deg2 in the COSMOS field. It includes photometry in 30 bands and provides excellent photometric redshifts (). Stellar mass completeness analysis was performed for this data set by Muzzin et al. (2013a), who found a 95% completeness limit of at .
Galaxies at were observed as part of the complimentary 3D-HST and CANDELS surveys. These are near-infrared spectroscopic and imaging surveys with the Wide Field Camera 3 on board the Hubble Space Telescope. Images and grism spectra are available from the surveys in five fields (AEGIS, COSMOS, GOODS-S, GOODS-N and UDS), covering a total area of roughly 0.2 deg2. Photometric catalogs, including excellent photometric redshifts () and stellar population synthesis model fits were derived by the 3D-HST team using images from both surveys in addition to a large set of ancillary data (R. Skelton 2014, in preparation). We determine the stellar mass completeness limits of the 3D-HST/CANDELS data set in the following section.
2.1. Completeness in 3D-HST/CANDELS
We estimate the completeness in stellar mass of the 3D-HST/CANDELS v3.0 catalog by comparing source detection in the wide and deep components of the CANDELS survey. We do so by creating a detection image over the CANDELS/deep area with the same exposure time and depth as the shallower CANDELS/wide survey. Although CANDELS/deep covers only about 17% of the total survey area, it reaches roughly twice the depth of CANDELS/wide (with approximately four times the exposure time), thus making it suitable for calculating the fraction of missed objects as a function of stellar mass.
Following the same methodology that was used to create the science grade images, we reduced only 25% of the data that is available in the GOODS-S/deep field to match the depth of the wide component. From CANDELS/deep we selected observations from visits 1 and 2 (as defined in Grogin et al. 2011) and combined them to create 2-orbit depth images in F125W and F160W. From 3D-HST we combined all F140W direct images in GOODS-S into a single orbit depth image. Finally, we created a noise equalized detection image following the same procedure that was used to produce the 3D-HST/CANDELS catalog. We multiplied each of the three science grade images (scii) by the square-root of their corresponding exposure-time weight-mask () and averaged them according to the following equation:
| (1) |
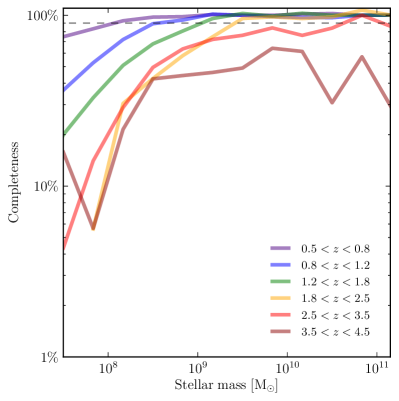
Source identification and matching was then performed on both depth level images. We ran SExtractor (Bertin & Arnouts 1996) on the newly combined “shallow” image as well as on the deep GOODS-S image using the same parameters that were utilized to create the photometric catalog. Figure 1 shows the fraction of detected objects in the shallow image compared to the deep image as a function of mass and redshift. Input redshift and stellar mass estimates were taken from the 3D-HST/CANDELS catalog, for which detected galaxies from both images were matched to within 3 pixels, the typical size of the WFC3 point spread function. On that basis we estimate that the catalogs are 90% complete in stellar mass down to at and they reach at . At the catalogs are 75% complete down to .
2.2. Cumulative Number Density Matching
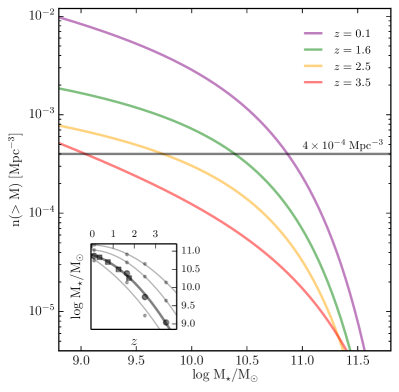
Several recent studies have demonstrated that selecting galaxy samples at a fixed cumulative number density effectively allows tracing the evolution of a given population of galaxies over different epochs (e.g., Gao et al. 2004; van Dokkum et al. 2010; Papovich et al. 2011; Leja et al. 2013; Behroozi et al. 2013a). In this study we followed the same technique to match galaxy populations over the redshift range . We calculated the cumulative number density curves of the redshift samples from Marchesini et al. (2009) and measured the implied stellar mass evolution at four number density values: Mpc-3 (Figure 2). For example, the resulting mass-redshift relation at Mpc-3 is:
| (2) |
Similar relations for the other number density samples are given in Appendix A. Toy model based estimates of the mass evolution at imply a similar slope at high redshift (Dekel et al. 2013).
| Data set | Redshift | Mmed/M⊙ | Rv [kpc] | Ncen |
|---|---|---|---|---|
| SDSS | 7.9 | 250 | 251 | |
| UltraVISTA | 6.9 | 220 | 261 | |
| 6.1 | 200 | 460 | ||
| 5.2 | 180 | 1080 | ||
| 4.1 | 150 | 2281 | ||
| 3D-HST | 2.5 | 110 | 707 | |
| 1.2 | 75 | 915 | ||
| 2.8 | 40 | 3054 |
We note that while the cumulative number density matching technique provides an estimate for the mass evolution of a given galaxy population over time, it relies on the assumption that the rank order of galaxies does not change dramatically over the studied redshift range. The presence of a significant major merger rate may change the mass ranking of galaxies and therefore render this assumption inadequate. In addition, a high major merging rate would affect this measurement by directly changing the number of galaxies at a given mass.
2.3. Central Galaxy Identification
We divided all galaxies from the UltraVISTA and 3D-HST/CANDELS catalogs into six redshift bins such that each bin spans roughly 1.5 to 2 Gyr. The time span of the SDSS redshift bin is shorter, as it was limited by the catalog mass completeness limit. At each redshift we selected central galaxy candidates in bins of width 0.3 dex with an evolving median mass according to the above calculated mass-redshift relation (e.g., Equation 2). We considered a galaxy to be central if no other, more massive, galaxy was found within two projected virial radii of the host halo of the central candidate. Virial radius estimates for host halos around centrals at a given median mass and a given redshift were measured from catalogs extracted from the semi-analytic model of Guo et al. (2011). Median stellar mass, redshift limits and virial radius estimates for central galaxies in each of the bins at Mpc-3 are given in Table LABEL:tab:selection. At , central galaxies in our sample reach , roughly the mass of the Milky Way and M31. Detailed selection criteria for all samples are presented in Appendix A.
2.4. Rest frame Colors
Global star formation rates have been measured in distant galaxies using numerous techniques, often relying on photometric estimates of rest frame colors. Williams et al. (2009) showed that galaxies out to can be reliably separated into either “star forming” or “quiescent” based on a rest frame vs. () color selection. Recently, Muzzin et al. (2013b) extended this measurement to using redshift and rest frame color estimates from the UltraVISTA survey catalog.
Following the same approach, we identified each galaxy in our sample as either star forming or quiescent based on the derived rest frame colors in the catalogs. We adopted the threshold values from Muzzin et al. (2013b) to separate galaxies at in the UltraVISTA and 3D-HST/CANDELS catalogs. At lower redshift we found equivalent thresholds in the vs. color plane that we used for selecting galaxies from the NYU-VAG catalog. We note that the relatively poor band photometry in SDSS implies that rest frame color estimates at low redshift are significantly more scattered than estimates in UltraVISTA and 3D-HST (see Appendix B for details).
3. Halo quenching of central galaxies
Star formation suppression in central galaxies is often linked to the mass of their surrounding host halos. In this “halo quenching” model, strong shocks in halos above a critical mass heat up any infalling cold gas and thus prevent further star formation in the central galaxy itself (e.g., Birnboim & Dekel 2003; Dekel & Birnboim 2006). This model predicts that the value of is mostly constant at low redshift and that at high redshift significant cold gas inflows allow star formation even in halos more massive than . Recently, Behroozi et al. (2013b) matched observed galaxies to simulated dark matter halos to show that star formation efficiency peaks in halos with a typical mass around and that it drops quickly in more massive halos. Here we follow an alternative approach and estimate the halo mass at which quenching becomes important by analyzing the fraction of quiescent central galaxies as a function of redshift and mass.
3.1. Early quenching of central galaxies
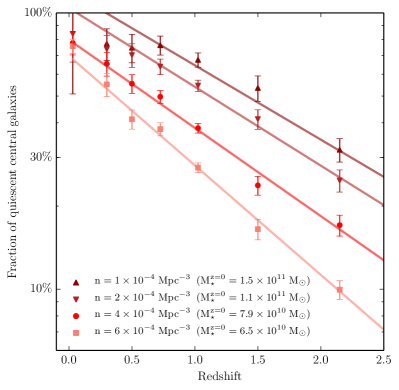
We use rest frame color estimates to identify quenched central galaxies in each redshift sample. Figure 3 shows the redshift dependence of the fraction of quiescent central galaxies in each of the four number density selected samples. The red circles and line represent the Mpc-3 sample while lighter and darker points and lines show the same measurement at higher and lower fixed number density values. Also noted in the figure are stellar mass estimates of galaxies in each sample. The fraction of quiescent central galaxies at all number densities seem to be increasing at nearly the same rate at . The evolving quiescent fractions that are presented in Figure 3 are consistent with results from recent similar analyses at fixed cumulative number density (Patel et al. 2013; Lundgren et al. 2013).
Figure 3 shows that central galaxy quenching occurs early. The quiescent fraction of the lowest number density sample ( at ) reaches 30% already at . Lower mass central galaxies, drawn from the higher number density samples, also begin quenching at relatively early times and are more than 10% quenched by .
This result agrees qualitatively with the halo quenching model which predicts that centrals cease forming stars promptly after their host halo reaches the threshold mass . In the following Section, we estimate the evolution of this threshold mass from observations.
3.2. Halo Mass and Quenching
We examine the influence of halo mass on star formation suppression in central galaxies by estimating the typical host halo mass at four fixed values of quenched fractions ( = 10%, 20%, 30% and 50%). We start by using the line fits from Figure 3 to extract the redshift at which each sample of central galaxies crosses the selected value of . We then estimate the total stellar mass of central galaxies at this redshift using the derived relation of each number density sample (e.g., Equation 2). Finally, we estimate a proxy for the group host halo mass using the total stellar mass and number density under Press-Schechter formalism (Press & Schechter 1974).
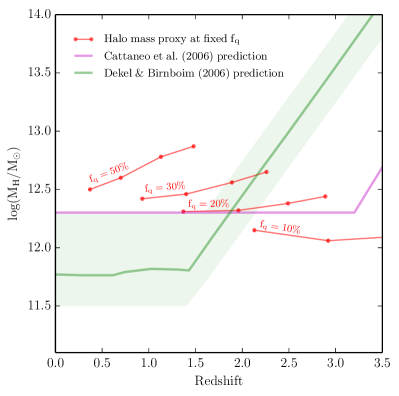
Figure 4 shows the halo mass estimate of each number density sample at each value of as a function of redshift (red points and lines). Also shown are predictions from two theoretical investigations of the halo quenching model. The green line represents the estimates from Dekel & Birnboim (2006), who follow an analytic approach to study the formation of strong shocks in spherically symmetric halos. In this analysis, the critical mass value was estimated at with significant uncertainty of roughly half a dex. The magenta line is based on estimates from Cattaneo et al. (2006), who fine-tune the value of in their semi-analytic simulations to best fit the color-magnitude distribution of galaxies and the Lyman-break galaxy luminosity function at . These analyses use different tools to study the same model, according to which galaxies that reside inside a host halo more massive than some critical mass are efficiently quenched at low redshift (horizontal green and purple lines in Figure 4). At high redshift, high infall rates of cold narrow streams allow star formation in higher mass halos (diagonal lines). The upturn redshift in Dekel & Birnboim (2006) is allowed in the range .
Theoretical investigations of the halo quenching model agree with the observed result in that there seems to exist a threshold host halo mass above which star formation in central galaxies is suppressed efficiently. The implied typical range of the threshold halo masses is consistent with the values favored by Cattaneo et al. (2006) and by Dekel & Birnboim (2006). We note that in addition to halo mass, local properties of the stellar component of galaxies (as traced by, e.g., central mass density and velocity dispersion) likely help determine star formation activity in these galaxies.
4. Environmental quenching of satellite galaxies
Measurements of the properties of individual satellites require that galaxies are uniquely associated to their parent halo, often relying on extensive spectroscopic data sets. Here we follow an alternative approach and perform a statistical analysis of the fraction of quiescent satellites around identified central galaxies. Using photometric redshift measurements we quantify and subtract the contribution of foreground and background sources and derive the evolving quiescent satellite fraction in halos binned by mass and redshift. For the bulk of this analysis we utilize the Mpc-3 sample in order to maximize completeness, redshift and source density. At this value of , galaxies are at least 10 times more massive than the 90% completeness limit at , allowing us to study the satellites of a mass evolving sample of central galaxies with a satellite-central mass ratio 1:10. At higher values of completeness reaches 90% at lower redshift while at lower the density of satellite galaxies is insufficiently high for background subtraction.
4.1. Average Quiescent Fractions
We select all satellite galaxy candidates from the UltraVISTA and 3D-HST/CANDELS catalogs within the virial radius of each central galaxy and within and . Galaxies in SDSS were selected from the NYU-VAG catalog within of their central galaxies. Virial radius estimates at all redshifts were acquired from the Guo et al. (2011) semi-analytic model. Redshift thresholds were defined based on the redshift accuracy of the catalogs and mass limits were determined to maximize the number of detected satellites according to the calculated completeness value in stellar mass.
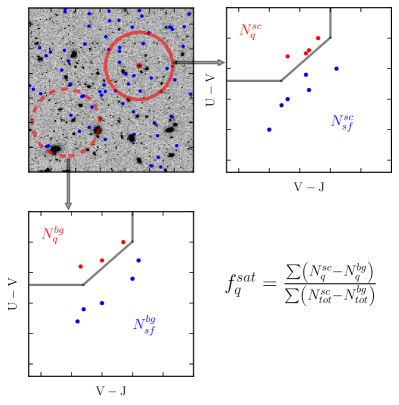
We measure the rest frame color ( in SDSS) of each candidate satellite and count the number of quiescent and star forming galaxies. We then perform an identical measurement in ten randomly positioned apertures per galaxy to get an estimate of background and foreground source contamination. Finally, we subtract the average number of contaminating sources in each selection category (quiescent or star forming) from the number of candidate satellites in the same category. From the resulting distribution of and values we calculate the average fraction of quiescent satellite galaxies at each redshift. Figure 5 shows a demonstration of this procedure. We also measured the fraction of quiescent background and foreground galaxies and the standard deviation of values in the ten stacks of randomly positioned apertures.
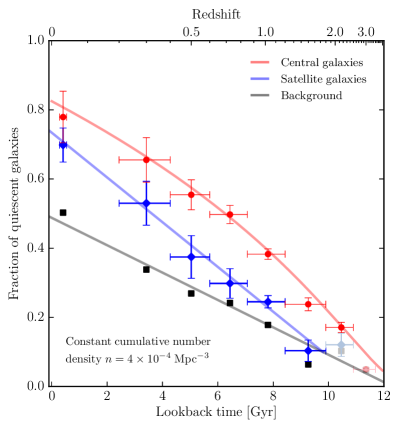
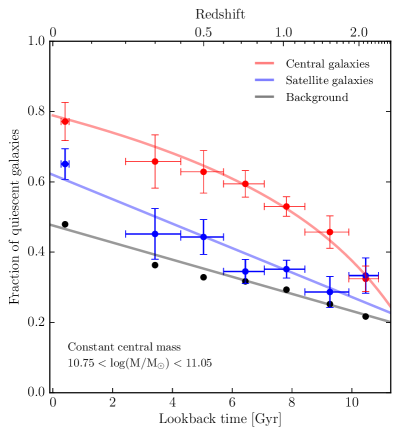
Figure 6 shows the fraction of quiescent galaxies as a function of lookback time and redshift at Mpc-3. Red data points represent central galaxies, black points show galaxies in randomly positioned apertures and blue points show the fraction of quiescent satellite galaxies. The pale pink data point at and the gray and light blue data points at reflect the same measurement where the 3D-HST/CANDELS catalog is less than 90% complete in stellar mass. The plotted blue error bars represent the statistical measurement error and are equal to the standard deviation of measured values from the 10 random apertures in each redshift bin. The red error bars are the propagated noise estimates of the central quiescent fraction measurement. The black and blue solid lines show a linear fit to the data at and the red line shows the line fit to the central galaxy points in redshift-log() space from Figure 3.
4.2. Star Formation Quenching in Satellite Galaxies
The most striking result that is evident from Figure 6 is the increase in the fraction of quiescent satellite galaxies compared to the overall background population. While on average all galaxies become more quiescent with time, they do so at different epochs. Central galaxies, which are selected to be more massive than their satellites, increase their quiescent fraction at early times. Satellites and background galaxies exhibit a mostly constant rate of increase in their quiescent fraction since . At that redshift, it is not possible to separate satellites from the general population of similar mass galaxies solely from their star formation activity. As time progresses, the quiescent fraction of satellite galaxies increases compared to background galaxies and by , the fraction of non star forming satellite galaxies is nearly as high as that of their centrals.
Satellite and background galaxies in our sample were selected to be identical in stellar mass and redshift, implying that the different quiescent fractions at are likely attributable to the environment in which these galaxies reside. In addition to halo quenching, which is expected to influence all galaxies, satellite galaxies in groups are subject to processes such as gas and stellar stripping, harassment and strangulation, all of which may assist in suppressing star formation. Moreover, satellite orbits in the host halo are typically eccentric (e.g., van den Bosch 1999) and as a consequence they spend a large fraction of the time outside of the virial radius. This implies that the quenching time scale of each satellite galaxy depends on its orbit, as well as on any interactions that the galaxy experiences. Therefore, environmental processes may act rapidly to suppress star formation in some satellite galaxies or may take a long time to quench other galaxies. Nevertheless, the average quiescent fraction of the ensemble of satellite galaxies increases over time compared to that of background galaxies at the same mass.
4.3. Delayed Onset of Satellite Quenching
Quenching of satellite galaxies in groups does not seem to begin immediately upon their infall into the group halo. Wetzel et al. (2012) utilized galaxy group catalogs based on SDSS data in addition to a high resolution -body simulation in order to estimate the time delay between satellite galaxy infall and quenching. They find that star formation in satellites continues unaffected for 2-4 Gyr after first infall. When quenching begins, it takes place on a rapid time scale that depends on the stellar mass of the satellites. Wetzel et al. (2012) conclude that satellite galaxy quenching is similar to that of central galaxies for 2-4 Gyr after being accreted into a group halo, and is significantly more rapid thereafter.
Our results indeed show that satellite quenching is delayed in respect to their centrals, although we cannot measure the delay time scale as the current data hold no information regarding satellite accretion times. Instead, we estimate the initial quenching time delay by comparing the time difference between the onset of central and satellite galaxy quenching. To do so we measured the time difference between the central and satellite galaxy curves at (horizontal distance between the red and blue curves in Figure 6), when the effects of environmental processes first separate the quiescent fraction of satellites from that of background galaxies. We repeated the measurement for an additional number density selection, Mpc-3, by finding the best fit curves to the data in the same way as discussed in Section 4.1 and presented in Figure 6. We note that selected satellites at this value of reach at , roughly twice the stellar mass of the Large Magellanic Cloud.
The derived initial time delay is 1.50.3 Gyr and 2.20.5 Gyr for the Mpc-3 and Mpc-3 samples, respectively. Both values are slightly shorter than the estimate of 2-4 Gyr that was calculated for similarly massive galaxies at from Wetzel et al. (2012).
4.4. Sources of Uncertainty
The results that are presented in this study are subject to potential biases which may have been introduced by our galaxy selection approach. For example, we select satellite galaxies within a fixed mass threshold from their group centrals. Since we do not directly measure how the mass of satellite galaxies evolves over the studied redshift range, we cannot predict the corresponding actual evolution in the mass ratio value. An alternative selection which includes all satellite galaxies above a fixed threshold mass, would imply an increasing mass ratio with time and a large number of low mass satellites at low redshift. Consequently, the contribution of lower mass satellites may affect the measured quiescent fractions of satellite and background galaxies alike and may change the rate of their evolution over time. We discuss this selection bias further in Appendix C.
An additional assumption that may affect our measurements if sufficiently inaccurate is that of a constant population of satellite galaxies in the studied halos. If a large fraction of satellites at any given redshift are subject to accretion and merging, our measurement of satellite quenching may not be dominated by environmental processes as satellites do not spend enough time in the vicinity of the group for such processes to take effect. However, we note that recent studies find that most satellite galaxies orbit the halo on eccentric orbits and that they spend a large fraction of their time outside of the group halo virial radius (but are still affected by the group; e.g., Tal et al. 2013; Wetzel et al. 2013). This implies that even in the presence of accretion and merging, the overall population of satellite galaxies may be mostly stable over time.
Finally, the selection of constant number density of central galaxies may have affected the measured quiescent galaxy fractions. Even under the assumption that overall, a fixed cumulative number density selection truly follows a given population of galaxies over time, this technique may inadequately follow populations of only quiescent or star forming galaxies. If instead we effectively follow vastly different selections of galaxy populations, our interpretation may suffer from significant biases. Nevertheless, since cumulative number density is probably our current best approach for tracing galaxies over different epochs, we utilize it throughout this study.
5. Summary
Galaxy environments have long been postulated to play a crucial role in regulating the star formation rates of their resident galaxies. Here we studied the link between environment and star formation in groups by analyzing the fraction of quiescent central and satellite galaxies in the redshift range . We followed central galaxy populations at fixed values of cumulative number density and traced group satellites with mass ratios as low as 1:10. In addition, we analyzed background galaxies (which act as centrals in their own host halos) at the same mass and redshift as the satellites. Central galaxies in our sample span a wide range of stellar masses () over seven redshift bins and four number density selection values. We found clear evidence for star formation suppression in group halos and measured different quenching times for satellite and central galaxies.
| Selection | Data set | Redshift | Central mass range | Rvir | Ncen | |
|---|---|---|---|---|---|---|
| (kpc) | ||||||
| SDSS | log | 6.2 | 220 | 667 | ||
| Mpc-3 | UltraVISTA | log | 4.9 | 200 | 301 | |
| log | 4.0 | 180 | 531 | |||
| log | 3.1 | 150 | 1251 | |||
| log | 2.2 | 110 | 2858 | |||
| 3D-HST | log | 1.2 | 85 | 970 | ||
| log | 5.0 | 60 | 1827 | |||
| log | 1.0 | 30 | 3530 | |||
| SDSS | log | 7.9 | 250 | 251 | ||
| Mpc-3 | UltraVISTA | log | 6.9 | 220 | 261 | |
| log | 6.1 | 200 | 460 | |||
| log | 5.2 | 180 | 1080 | |||
| log | 4.1 | 150 | 2281 | |||
| 3D-HST | log | 2.5 | 110 | 707 | ||
| log | 1.2 | 75 | 915 | |||
| log | 2.8 | 40 | 3054 | |||
| SDSS | log | 1.1 | 350 | 50 | ||
| Mpc-3 | UltraVISTA | log | 1.0 | 300 | 165 | |
| log | 9.8 | 270 | 250 | |||
| log | 9.0 | 240 | 610 | |||
| log | 7.7 | 200 | 1294 | |||
| 3D-HST | log | 5.6 | 150 | 526 | ||
| log | 3.2 | 100 | 595 | |||
| log | 9.9 | 60 | 1601 | |||
| SDSS | log | 1.5 | 380 | 21 | ||
| Mpc-3 | UltraVISTA | log | 1.4 | 350 | 133 | |
| log | 1.4 | 330 | 167 | |||
| log | 1.3 | 310 | 369 | |||
| log | 1.2 | 250 | 714 | |||
| 3D-HST | log | 9.2 | 190 | 256 | ||
| log | 6.1 | 140 | 437 | |||
| log | 2.6 | 70 | 759 |
Initial star formation suppression in central galaxies takes place early. Figure 3 shows that at , at least 30% of the centrals in each of the two most massive samples are already quenched. Even the lowest mass centrals in our sample had already started quenching by . We utilized these measurements to calculate a threshold halo mass for star formation suppression and found it to be in the range (Figure 6). This value is relatively constant at and it is consistent with theoretical predictions from the halo quenching model. Local processes, which were not considered in this analysis, likely contribute to quenching as well.
Satellite galaxies begin quenching a few Gyr after the onset of star formation cessation in the centrals. Figure 6 shows that at the average fraction of quiescent satellite and background galaxies is similar to one another but significantly lower than that of centrals. At that redshift, centrals had already been quenching for 1-3 Gyr. At , the fraction of quiescent satellites approaches and nearly reaches the fraction of quiescent centrals. This delayed quenching was also reported by Wetzel et al. (2012) in low redshift groups.
Additional evidence for the difference between central and satellite galaxy quenching comes from the different quiescent fractions of satellite and background galaxies at . Since sources that were selected as background galaxies act as centrals in their respective halos, the black and blue lines in Figure 6 represent the difference between central and satellite quenching at the same mass and redshift. This is in agreement with studies who find that satellite galaxies are on average more quenched than same-mass centrals (e.g., Wetzel et al. 2012). Overall, the observed quenching in satellites is consistent with environmental processes (mainly gas heating and stripping) which act to suppress star formation in galaxy group halos.
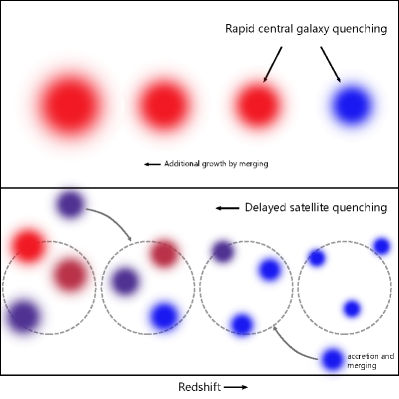
In summary, we find that while star formation gets suppressed in all galaxies in groups, the processes that govern this suppression are not universal (Figure 7). Our analysis shows that central galaxies in groups undergo quenching which is consistent with the halo quenching model while their satellites experience additional quenching by environmental processes. The onset of star formation suppression also varies between centrals and satellites with early central quenching and delayed quenching of satellites.
Appendix A
cumulative fixed number density selection parameters
Central galaxy selection criteria are presented in Table LABEL:tab:selection2. The selection column shows the fixed cumulative number density value of each sample, as well as its derived mass-redshift relation (Section 2.2). Stellar mass ranges were calculated such that each log() bin of size 0.3 dex had a median central galaxy mass according to its respective mass-redshift relation. Virial radius estimates were calculated using catalogs based on the semi-analytic models of Guo et al. 2011 for galaxies at the same redshift and mass. The number of central galaxies in each bin are given in the final column of Table LABEL:tab:selection2.
Appendix B
and ugJ selection
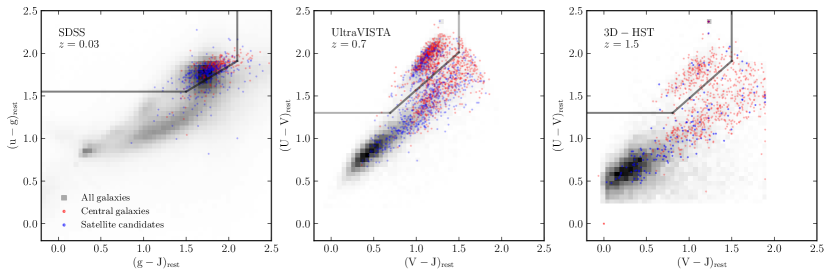
Quiescent galaxies at were selected from the UltraVISTA and 3D-HST/CANDELS catalogs based on their location on a rest frame diagram. The ancillary data sets and SED modeling techniques that were used to derive these colors for both catalogs are similar and therefore so are the galaxy selection limits that were utilized in this study. The middle and right-hand panels of Figure 8 show the distribution of galaxy colors in the catalogs, as well as the selection thresholds (black lines) which were adopted from Muzzin et al. (2013a).
At , rest frame color estimates require very small corrections from observed colors. More specifically, color values in the NYU-VAG catalog were derived relying heavily on band photometry from SDSS. The response function of the SDSS photometric system in this filter band is notoriously poor and as a consequence flux estimates suffer from large errors (Fukugita et al. 1996). While the and colors that were used in this study are very similar in wavelength coverage, the enhanced scatter in band photometry implies that the measurement is more uncertain. The left panel of Figure 8 shows the distribution of galaxy colors in SDSS. It is evident from the figure that the division between star forming and quiescent galaxies is far from perfect as the two populations are somewhat mixed.
In order to match the selection in to that of we followed Williams et al. (2009) and Muzzin et al. (2013a) and tried to contain as much of the quiescent galaxy peak while minimizing contamination from star forming galaxies. The lines in the left hand panel of Figure 8 show these selection thresholds. Despite significant scatter, the majority of all quiescent central and satellite galaxies are likely included in our selection.
Appendix C
Constant mass selection of central and satellite galaxies
One potential bias that could affect our analysis of the evolving quenched fractions of satellite galaxies (Section 4) stems from the number density selection approach that we utilized in this study. Since we do not directly follow the mass growth of satellite galaxies but rather require a fixed ratio between central and satellite masses, some of the implied evolution of the quiescent fractions may be the result of mass growth over the same redshift range. Here we test the robustness of our results by repeating the analysis for a constant mass selected sample of central and satellite galaxies. Central galaxies at all redshifts are in the mass range while all satellite and background galaxies are more massive than . Figure 9 demonstrates that even in the absence of any mass evolution, satellite galaxies experience delayed quenching after their centrals, at a more rapid rate than background galaxies at the same mass and redshift. We conclude that the observed trends that are presented in this study do not entirely result from the mass evolution of satellite galaxies.
References
- Abazajian et al. (2009) Abazajian, K. N., Adelman-McCarthy, J. K., Agüeros, M. A., et al. 2009, ApJS, 182, 543
- Balogh et al. (2000) Balogh, M. L., Navarro, J. F., & Morris, S. L. 2000, ApJ, 540, 113
- Balogh et al. (2009) Balogh, M. L., McGee, S. L., Wilman, D., et al. 2009, MNRAS, 398, 754
- Balogh et al. (2004) Balogh, M., Eke, V., Miller, C., et al. 2004, MNRAS, 348, 1355
- Barro et al. (2013) Barro, G., Faber, S. M., Pérez-González, P. G., et al. 2013, ApJ, 765, 104
- Behroozi et al. (2013a) Behroozi, P. S., Marchesini, D., Wechsler, R. H., et al. 2013a, ApJL, 777, L10
- Behroozi et al. (2013b) Behroozi, P. S., Wechsler, R. H., & Conroy, C. 2013b, ApJ, 770, 57
- Bertin & Arnouts (1996) Bertin, E., & Arnouts, S. 1996, A&AS, 117, 393
- Bezanson et al. (2012) Bezanson, R., van Dokkum, P., & Franx, M. 2012, ApJ, 760, 62
- Birnboim & Dekel (2003) Birnboim, Y., & Dekel, A. 2003, MNRAS, 345, 349
- Blanton et al. (2005a) Blanton, M. R., Eisenstein, D., Hogg, D. W., Schlegel, D. J., & Brinkmann, J. 2005a, ApJ, 629, 143
- Blanton et al. (2005b) Blanton, M. R., Schlegel, D. J., Strauss, M. A., et al. 2005b, AJ, 129, 2562
- Bolzonella et al. (2010) Bolzonella, M., Kovač, K., Pozzetti, L., et al. 2010, A&A, 524, 76
- Brammer et al. (2012) Brammer, G. B., van Dokkum, P. G., Franx, M., et al. 2012, ApJS, 200, 13
- Byrd & Valtonen (1990) Byrd, G., & Valtonen, M. 1990, ApJ, 350, 89
- Capak et al. (2007) Capak, P., Aussel, H., Ajiki, M., et al. 2007, ApJS, 172, 99
- Carollo et al. (2013) Carollo, C. M., Cibinel, A., Lilly, S. J., et al. 2013, ApJ, 776, 71
- Cattaneo et al. (2006) Cattaneo, A., Dekel, A., Devriendt, J., Guiderdoni, B., & Blaizot, J. 2006, MNRAS, 370, 1651
- Cheung et al. (2012) Cheung, E., Faber, S. M., Koo, D. C., et al. 2012, ApJ, 760, 131
- Cooper et al. (2007) Cooper, M. C., Newman, J. A., Coil, A. L., et al. 2007, MNRAS, 376, 1445
- Dekel & Birnboim (2006) Dekel, A., & Birnboim, Y. 2006, MNRAS, 368, 2
- Dekel et al. (2013) Dekel, A., Zolotov, A., Tweed, D., et al. 2013, MNRAS, 435, 999
- Dressler (1980) Dressler, A. 1980, ApJ, 236, 351
- Fabian (2012) Fabian, A. C. 2012, ARA&A, 50, 455
- Fang et al. (2013) Fang, J. J., Faber, S. M., Koo, D. C., & Dekel, A. 2013, ApJ, 776, 63
- Farouki & Shapiro (1981) Farouki, R., & Shapiro, S. L. 1981, ApJ, 243, 32
- Font et al. (2008) Font, A. S., Bower, R. G., McCarthy, I. G., et al. 2008, MNRAS, 389, 1619
- Franx et al. (2008) Franx, M., van Dokkum, P. G., Schreiber, N. M. F., et al. 2008, ApJ, 688, 770
- Fukugita et al. (1996) Fukugita, M., Ichikawa, T., Gunn, J. E., et al. 1996, AJ, 111, 1748
- Gao et al. (2004) Gao, L., Loeb, A., Peebles, P. J. E., White, S. D. M., & Jenkins, A. 2004, ApJ, 614, 17
- Geha et al. (2012) Geha, M., Blanton, M. R., Yan, R., & Tinker, J. L. 2012, ApJ, 757, 85
- Grogin et al. (2011) Grogin, N. A., Kocevski, D. D., Faber, S. M., et al. 2011, ApJS, 197, 35
- Gunn & Gott (1972) Gunn, J. E., & Gott, J. R. 1972, ApJ, 176, 1
- Guo et al. (2011) Guo, Q., White, S., Boylan-Kolchin, M., et al. 2011, MNRAS, 413, 101
- Guo et al. (2009) Guo, Y., McIntosh, D. H., Mo, H. J., et al. 2009, MNRAS, 398, 1129
- Hogg et al. (2004) Hogg, D. W., Blanton, M. R., Brinchmann, J., et al. 2004, ApJ, 601, L29
- Hopkins et al. (2006) Hopkins, P. F., Hernquist, L., Cox, T. J., et al. 2006, ApJS, 163, 1
- Hou et al. (2013) Hou, A., Parker, L. C., Balogh, M. L., et al. 2013, MNRAS, 435, 1715
- Kauffmann & Haehnelt (2000) Kauffmann, G., & Haehnelt, M. 2000, MNRAS, 311, 576
- Kauffmann et al. (2004) Kauffmann, G., White, S. D. M., Heckman, T. M., et al. 2004, MNRAS, 353, 713
- Knobel et al. (2013) Knobel, C., Lilly, S. J., Kovač, K., et al. 2013, ApJ, 769, 24
- Kovač et al. (2010) Kovač, K., Lilly, S. J., Knobel, C., et al. 2010, ApJ, 718, 86
- Larson et al. (1980) Larson, R. B., Tinsley, B. M., & Caldwell, C. N. 1980, ApJ, 237, 692
- Leja et al. (2013) Leja, J., van Dokkum, P., & Franx, M. 2013, ArXiv e-prints, 1302, 1195
- Lilly et al. (2009) Lilly, S. J., Le Brun, V., Maier, C., et al. 2009, ApJS, 184, 218
- Lundgren et al. (2013) Lundgren, B. F., van Dokkum, P., Franx, M., et al. 2013, ArXiv e-prints, 1310, 7582
- Marchesini et al. (2009) Marchesini, D., van Dokkum, P. G., Förster Schreiber, N. M., et al. 2009, ApJ, 701, 1765
- Mármol-Queraltó et al. (2012) Mármol-Queraltó, E., Trujillo, I., Pérez-González, P. G., Varela, J., & Barro, G. 2012, MNRAS, 422, 2187
- Mármol-Queraltó et al. (2013) Mármol-Queraltó, E., Trujillo, I., Villar, V., Barro, G., & Pérez-González, P. G. 2013, MNRAS, 429, 792
- Martin et al. (2005) Martin, D. C., Fanson, J., Schiminovich, D., et al. 2005, ApJL, 619, L1
- Masjedi et al. (2008) Masjedi, M., Hogg, D. W., & Blanton, M. R. 2008, ApJ, 679, 260
- Masjedi et al. (2006) Masjedi, M., Hogg, D. W., Cool, R. J., et al. 2006, ApJ, 644, 54
- McCracken et al. (2012) McCracken, H. J., Milvang-Jensen, B., Dunlop, J., et al. 2012, A&A, 544, 156
- McGee et al. (2011) McGee, S. L., Balogh, M. L., Wilman, D. J., et al. 2011, MNRAS, 413, 996
- Moore et al. (1996) Moore, B., Katz, N., Lake, G., Dressler, A., & Oemler, A. 1996, Nature, 379, 613
- Muzzin et al. (2012) Muzzin, A., Wilson, G., Yee, H. K. C., et al. 2012, ApJ, 746, 188
- Muzzin et al. (2013a) Muzzin, A., Marchesini, D., Stefanon, M., et al. 2013a, ArXiv e-prints, 1303, 4409
- Muzzin et al. (2013b) —. 2013b, ApJS, 206, 8
- Oemler (1974) Oemler, A. 1974, ApJ, 194, 1
- Papovich et al. (2011) Papovich, C., Finkelstein, S. L., Ferguson, H. C., Lotz, J. M., & Giavalisco, M. 2011, MNRAS, 412, 1123
- Patel et al. (2009) Patel, S. G., Holden, B. P., Kelson, D. D., Illingworth, G. D., & Franx, M. 2009, ApJL, 705, L67
- Patel et al. (2011) Patel, S. G., Kelson, D. D., Holden, B. P., Franx, M., & Illingworth, G. D. 2011, ApJ, 735, 53
- Patel et al. (2013) Patel, S. G., van Dokkum, P. G., Franx, M., et al. 2013, ApJ, 766, 15
- Peng et al. (2012) Peng, Y.-j., Lilly, S. J., Renzini, A., & Carollo, M. 2012, ApJ, 757, 4
- Peng et al. (2010) Peng, Y.-j., Lilly, S. J., Kovač, K., et al. 2010, ApJ, 721, 193
- Press & Schechter (1974) Press, W. H., & Schechter, P. 1974, ApJ, 187, 425
- Quadri et al. (2012) Quadri, R. F., Williams, R. J., Franx, M., & Hildebrandt, H. 2012, ApJ, 744, 88
- Rasmussen et al. (2012) Rasmussen, J., Mulchaey, J. S., Bai, L., et al. 2012, ApJ, 757, 122
- Sanders et al. (2007) Sanders, D. B., Salvato, M., Aussel, H., et al. 2007, ApJS, 172, 86
- Skibba (2009) Skibba, R. A. 2009, MNRAS, 392, 1467
- Skibba & Sheth (2009) Skibba, R. A., & Sheth, R. K. 2009, MNRAS, 392, 1080
- Skrutskie et al. (2006) Skrutskie, M. F., Cutri, R. M., Stiening, R., et al. 2006, AJ, 131, 1163
- Springel et al. (2005) Springel, V., Di Matteo, T., & Hernquist, L. 2005, ApJL, 620, L79
- Tal et al. (2013) Tal, T., van Dokkum, P. G., Franx, M., et al. 2013, ApJ, 769, 31
- Tal et al. (2012) Tal, T., Wake, D. A., van Dokkum, P. G., et al. 2012, ApJ, 746, 138
- Thomas et al. (2005) Thomas, D., Maraston, C., Bender, R., & Mendes de Oliveira, C. 2005, ApJ, 621, 673
- Tran et al. (2009) Tran, K.-V. H., Saintonge, A., Moustakas, J., et al. 2009, ApJ, 705, 809
- van den Bosch et al. (2008) van den Bosch, F. C., Aquino, D., Yang, X., et al. 2008, MNRAS, 387, 79
- van den Bosch et al. (1999) van den Bosch, F. C., Lewis, G. F., Lake, G., & Stadel, J. 1999, ApJ, 515, 50
- van Dokkum et al. (2010) van Dokkum, P. G., Whitaker, K. E., Brammer, G., et al. 2010, ApJ, 709, 1018
- Wake et al. (2012) Wake, D. A., van Dokkum, P. G., & Franx, M. 2012, ApJL, 751, L44
- Wang & White (2012) Wang, W., & White, S. D. M. 2012, MNRAS, 424, 2574
- Watson et al. (2012) Watson, D. F., Berlind, A. A., McBride, C. K., Hogg, D. W., & Jiang, T. 2012, ApJ, 749, 83
- Weinmann et al. (2013) Weinmann, S. M., Franx, M., van Dokkum, P., & Bezanson, R. 2013, ApJL, 767, L21
- Weinmann et al. (2006) Weinmann, S. M., van den Bosch, F. C., Yang, X., & Mo, H. J. 2006, MNRAS, 366, 2
- Wetzel et al. (2012) Wetzel, A. R., Tinker, J. L., & Conroy, C. 2012, MNRAS, 424, 232
- Wetzel et al. (2013) Wetzel, A. R., Tinker, J. L., Conroy, C., & van den Bosch, F. C. 2013, ArXiv e-prints, 1303, 7231
- Williams et al. (2009) Williams, R. J., Quadri, R. F., Franx, M., van Dokkum, P., & Labbé, I. 2009, ApJ, 691, 1879
- Wilman et al. (2005) Wilman, D. J., Balogh, M. L., Bower, R. G., et al. 2005, MNRAS, 358, 88
- Woo et al. (2013) Woo, J., Dekel, A., Faber, S. M., et al. 2013, MNRAS, 428, 3306
- Yang et al. (2005) Yang, X., Mo, H. J., Jing, Y. P., & van den Bosch, F. C. 2005, MNRAS, 358, 217
- York et al. (2000) York, D. G., Adelman, J., Anderson, J. E., et al. 2000, AJ, 120, 1579
- Zabludoff & Mulchaey (1998) Zabludoff, A. I., & Mulchaey, J. S. 1998, ApJ, 496, 39