Information theoretic approach for accounting classification
Abstract
In this paper we consider an information theoretic approach for the accounting classification process. We propose a matrix formalism and an algorithm for calculations of information theoretic measures associated to accounting classification. The formalism may be useful for further generalizations and computer-based implementation. Information theoretic measures, mutual information and symmetric uncertainty, were evaluated for daily transactions recorded in the chart of accounts of a small company during two years. Variation in the information measures due the aggregation of data in the process of accounting classification is observed. In particular, the symmetric uncertainty seems to be a useful parameter for comparing companies over time or in different sectors or different accounting choices and standards.
keywords:
Information theory , Accounting , Accounting classification , Mutual information1 Introduction
Information Theory [1] provides useful and unifying concepts that have been applied in many fields, including Physics, Engineering, Computer science, Statistics and Data Analysis, Linguistics, Marketing, Economics, and Complex Systems research in general [2, 3, 4, 5, 6, 7, 8, 9, 10, 11, 12, 13, 14, 15, 16, 17, 18, 19]. Here, we are including Accounting as a potential field for interdisciplinary research where concepts and methods from information theory may have interesting applications. In fact, Accounting is considered an information science used to collect, classify, and manipulate financial data for organizations and individuals [20]. Nevertheless, an approach based on information theory was reported only in some academic research studies from 1960’s [21, 22, 23, 24, 25]. Specifically, in ref [21] the authors proposed the viewing of Accounting as a communication process; Lee and Bedford [23] proposed a communication channel model to describe accounting classification. However, as far as we know, neither applications using real data nor further research in the field was performed.
Accounting classification is a relevant subject for international accounting harmonization studies [26, 27, 28]. In [26], the author observed a high level of complexity of an accounting system due to the conceptual and methodological pluralism found in accounting classification attempts. By considering fifteen national systems a cluster analysis was performed and a nonmetric multidimensional scaling technique was applied, obtaining a two-dimensional map revealing similarities (dissimilarities) between the systems. In [27] and [28] the author investigated international differences in the way that countries and companies have responded to the International Financial Reporting Standards (IFRS). They conclude that some countries have entirely abandoned national accounting rules in favor of IFRS. It is also observed that different national systems of IFRS practices are emerging, and will only be classified further.. Thus, a quantitative measure of information may provide a more objective way to compare different accounting systems.
As pointed out by Demski [20], there is absence of modern information science in the Accounting curriculum. In the research domain, there are several examples involving Accounting that can be related to probability and allowing for an information theoretic perspective [29, 30]. Actually, the value of information [31] and the information content of inside traders before and after the Sarbanes-Oxley Act of 2002 (SOX) [32] have been previously considered. However, no investigation on information based on information theory was done. Hence, if compared with applications in other areas, information theory was not enough explored in Accounting. Besides, the technological developments including the storage and access of data, computer time processing, and the evolutions of information systems may allow the implementation and inclusion of results that previously were not possible. Therefore, attempting to develop new tools to support further research, it seems appropriate to review and further explore earlier studies.
The aim of this work is to further explore the information theoretic approach for accounting classification. A matrix formalism and an algorithm for calculations of information theoretic measures are introduced. Although the objects were correctly defined in Ref. [23], a matrix formalism was avoided. Our formalism may be useful for further generalizations and computer-based implementations. The formalism is applied to evaluate the information theoretic measures in classifying the transactions of a small company. The mutual information and the symmetric uncertainty are obtained for each level of classification in the chart of accounts, allowing us to observe their variation due to aggregation of data in the process of accounting classification. To the best of our knowledge, this is the first calculation of information theoretic measures for an accounting classification process using an empirical data set. Moreover, we indicate that the symmetric uncertainty may be a useful parameter for comparing companies over time or in different sectors or different accounting choices and standards.
The article is organized as follows: in section 2 some basic concepts of information theory are presented. In section 3 the work of Lee and Bedford connecting the processes of accounting classification and the theory of information is revisited. The matrix formalism and an algorithm for calculations are described in section 4. In section 5, information theoretic measures are evaluated considering the events registered in a five level chart of accounts of a small company. In section 6 some concluding remarks are presented. Finally, the source code for the R software environment [33] is included as an Appendix.
2 Shannon entropy and the measure of information
In this section some basic definitions of information theory are presented. A complete and more detailed treatment may be found elsewhere [9, 8].
Given an event occurring with probability , it is possible to associate a number, , to quantify the information associated with the occurrence of . This definition agrees with the intuitive idea that the information content of independent events is the sum of the information of each event. In order to quantify the information content of a set of events, Shannon introduced the concept of average amount of information or entropy [1].
Definition 2.1
Given the set of events with probabilities , the entropy associated to is defined as the mean information of :
| (1) |
Entropy may be interpreted as a measure of the uncertainty associated to a set of random events. The unit of information using the logarithm function to base two is called bit. Since may be zero, could be indeterminate in the above definition so, when , the value zero is assigned to . For two or more sets of events described by a joint probability distribution, the joint entropy may be defined as follows.
Definition 2.2
Given two sets of random events, with the joint probability distribution , the joint entropy between and is defined as
| (2) |
where and are the total number of distinct events in the and sets, respectively.
For independent events the joint probability distribution factorizes and the joint entropy becomes the sum of the entropy of each set of events, i.e., . Moreover, for joint distributions, if the information about one variable is conditioned to the information about another variable, it is useful to define the conditional entropy.
Definition 2.3
Given two sets of random events, the conditional entropy is defined as
| (3) |
where is the conditional probability of a random variable which assumes the value , given that another random variable has taken a value .
The conditioned entropy will be useful in the accounting classification process since it involves the registration of an economic event in one account given that it comes from another account [23], i.e., a double entry system. The joint entropy may be expressed in terms of the conditional entropy as , and since , it follows that .
We conclude this section with the concept of mutual information , which is the amount of information that one random variable contains about another random variable.
Definition 2.4
Given two sets of random events, the mutual information between and is defined as
| (4) |
Mutual information is the reduction in the uncertainty of one random variable due to the knowledge of the other [9]. By considering the joint probability distribution the mutual information may be written as
| (5) |
For independent events, the joint probability distribution factorizes as , and . Thus, mutual information may be used as a measure of the degree of association between random events. It is also useful to consider a normalized form of Mutual Information [34], the symmetric uncertainty, which is basically a measure of correlation defined as
| (6) |
Symmetric uncertainty lies between 0 and 1, and it is the information shared between and relatively at all information contained in both and .
3 Accounting classification and information theory
The mathematical model for the accounting classification process and its connection with information theory were first introduced by Lee and Bedford [23]. The overall process can be formalized by means of matrix algebra as will be shown in this paper. The first step of an accounting process in a firm is the registration of economic events.
Definition 3.1
An elementary economic event is defined as any activity that an accountant records. The economic events of a firm are represented by the set of elementary economic events.
The accounting classification involves the registration of economic events as a debit or a credit. Then, the events may have several possibilities of classification.
Definition 3.2
The set represents the possibilities of classification as a debit in one account and a credit in another account . The maximum number of classifications in accounts is given by , which is the number of permutations of accounts taken two at a time.
The function of accountant is to designate, among accounts, which one represents the structure of the financial state, with at least two accounts involved in each transaction [23]. With the definitions of the economic events set of a firm and the classification set it is now possible to define the accounting classification process.
Definition 3.3
The accounting classification process is a map relating each economic event to an element .
Theory of information is based on the concept of information content of a set of events described by a probability distribution. In order to quantify the information content of an account transaction one needs to introduce the probability associated to the classification process. In Ref.[23] the probabilities were introduced as subjective numbers depending on the accountant decision. We remove the subjectivity by looking directly to the transaction frequencies registered by the company. These distributions of frequencies should reflect the effects of accounting standards (or even the accountant subjectivity). Then, the probability of an economic event is identified with its relative frequency, i. e.,
Definition 3.4
The probability associate to an account transaction of an event is given by , where is number of occurrences of the event in the total number of events .
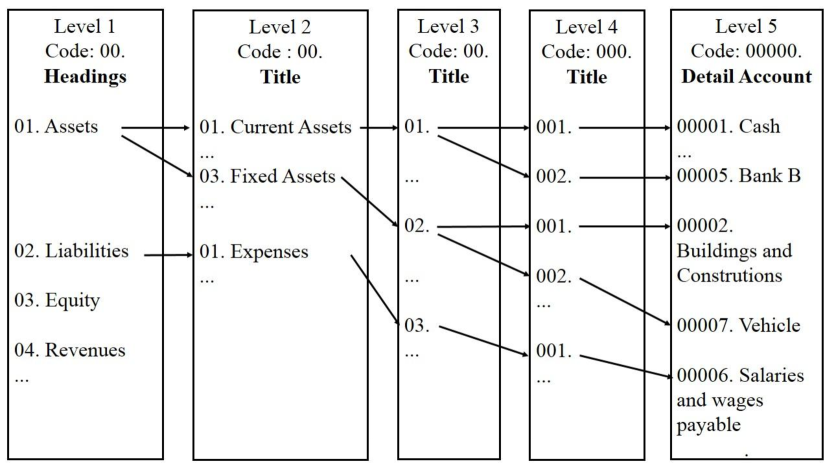
Indeed, such probabilities can be obtained from some information system. The set of economic events is organized in the so-called chart of accounts [35], a listing of the account names that a company has identified and made available for recording transactions in its general ledger. A company has the flexibility to tailor its chart of accounts to best suit its needs. A specific economic event in the chart of accounts is coded as a sequence of numbers. Figure 1 illustrates a typical structure of a chart of accounts with five levels encoded in a string of numbers with five pieces separated by dots. At the last level (Level 5) each economic event receives a specific code. For example, from Figure 1 the event “Salaries and Wages Payable” is encoded as 02.01.03.001.00006. At the intermediate levels the aggregation increases until reaching the first level (Level 1), which is the most aggregated one containing the events grouped in the main accounts. The classification process can be analyzed at each level, by introducing the conditional probability that a given economic event is classified as , namely .
The attribution of probabilities to the classification event of an account transaction permits us to associate quantities such as entropy and mutual information to characterize the process of accounting classification at different levels. Then, at least formally, the accounting classification process can be analyzed as a process of gain and loss of information.
A communication channel is a system in which the output depends probabilistically on its input. It is characterized by the probability transitions that determines the conditional distribution of the output given the input. To summarize, the following association of accounting classification and information theory is possible: is the entropy associated to the set of economic events , is the entropy associated to the classification of the economic events in the set of classifications , is the mutual entropy between the economic events and its classification as a debit or credit in the set , and is the entropy associated to the economic events given their classification . Finally, is the average information about conveyed through the channel of classification .
4 Algorithm for information analysis
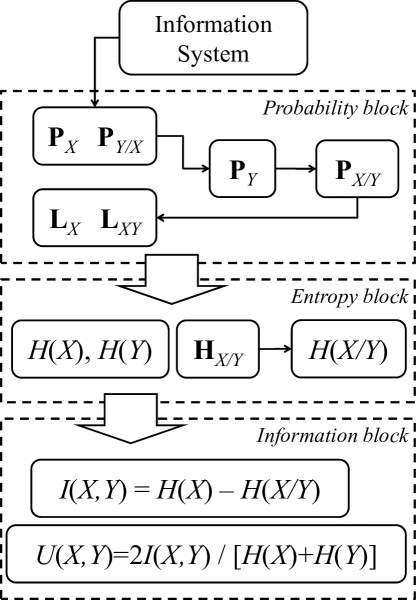
The accounting process of classification is, in this way, an information system in which the data from economic events are aggregated into specific accounts. During the accounting classification, the transmission of information is realized through a communication channel [21]. In order to obtain the information measures associated to the process of accounting classification we propose a matrix formalism and an algorithm for calculations. The steps to obtain the amount of information transmitted in this channel can be structured in the flowchart of Figure 2. The goal in applying this algorithm is to obtain the average information about conveyed through the channel by , namely . We have assumed that , the probabilities for the occurrence of economic events , as well as , the probability that the events are classified as , is obtained from their frequencies of occurrence and supplied by some information system. All others quantities are obtained from these inputs. In the following the mathematical expressions and the matrix algebra to obtain the quantities are presented.
4.1 The probability block
This first algorithm block consists of, from the input probability matrices, determining additional probability matrices, suitable to be used in the determination of entropy functions (see Fig. 2). The first input is the matrix, whose entries are given by the probability of occurrence of each distinct economic event , namely . In this way, considering the maximum number of economic events - , can be written as an matrix
| (7) |
Another input in this algorithm is , a matrix, with the maximum number of classifications, and entries given by the probability that an event is classified as , i.e.,
| (8) |
These two probabilities matrices, and , can be obtained from the information system, but more generally their elements can be viewed as parameters for theoretical studies on classification. In fact, the elements are related to the economic event frequencies, and the adopted accounting classification procedure.
Following the flowchart in Fig. 2, the probability matrix, can be calculated from the input by a matrix multiplication defined by
| (9) |
The last probability matrix to be determined in this block is the conditional probability matrix , a matrix defined by the product
| (10) |
In Eq. (10), and are and diagonal matrices with entries , () and , (), respectively, and where is the usual Kronecker function, which is unless , when it is .
4.2 The entropy block
By considering the matrices defined in the previous section, in this block the goal is to obtain the entropies and .
The a priori entropy of the source is a number (in bits units) calculated by the matrix multiplication,
| (13) |
The a posteriori entropy is an matrix with entries given by
| (14) |
and the superscript stands for transpose. Since the output symbols occur with probabilities , an average a-posteriori-entropy can be obtained by the following matrix multiplication
| (15) |
This conditional entropy measures the average final uncertainty of after an observation of the output produced by the input. It is straightforward, by applying the proposed algorithm, to verify that these matrix multiplications presented here are equivalent to the mathematical expressions in [23].
4.3 The information block
Following the flowchart in Fig. 2 the next step is to obtain the average information about conveyed through the channel by , namely , which is given by , and the normalized symmetric uncertainty . These quantitative parameters may be useful to compare accounting classifications in situations, such as, different accounting standards, periods, chart of account levels, and so on.
5 Application
| Classification - | |||
| Debit | Credit | ||
| 1- Unemployment Compensation | 0.0014 | 01.01.01.001.00001 | 01.01.01.002.00005 |
| 2- Sales in the State | 0.0167 | 01.01.01.001.00001 | 03.01.01.001.00001 |
| 3- Sales to other States | 0.0153 | 01.01.01.001.00001 | 03.01.01.001.00002 |
| 4- Resale of goods | 0.0264 | 01.01.01.001.00001 | 03.01.01.001.00004 |
| 5- Sales return | 0.0014 | 01.01.01.001.00001 | 03.01.01.002.00007 |
| 6- General Services sales | 0.0125 | 01.01.01.001.00001 | 03.01.01.004.00001 |
| 7- Loan Agreement | 0.0014 | 01.01.01.002.00005 | 02.01.02.003.00001 |
| 8- Buildings and Constructions | 0.0014 | 01.03.02.001.00002 | 01.01.01.001.00001 |
| 9- Equipment and machinery | 0.0042 | 01.03.02.002.00005 | 01.01.01.001.00001 |
| 10- Vehicles | 0.0014 | 01.03.02.002.00007 | 01.01.01.001.00001 |
| 11- Computing devices | 0.0042 | 01.03.02.002.00008 | 01.01.01.001.00001 |
| 78- 13th month´s salary | 0.0014 | 04.01.03.004.00001 | 01.01.01.001.00001 |
| 79- 13th month´s salary fees | 0.0014 | 04.01.03.004.00001 | 02.01.03.002.00002 |
| 80- 13th month´s salary taxes receivable | 0.0014 | 04.01.03.004.00001 | 02.01.03.002.00004 |
| 81- Water Costs | 0.0042 | 04.01.03.004.00002 | 01.01.01.001.00001 |
| 82- Accountant´s fee | 0.0153 | 04.01.03.004.00005 | 02.01.03.001.00006 |
| 83- Energy Costs | 0.0056 | 04.01.03.004.00020 | 01.01.01.001.00001 |
| 84- Office Supply | 0.0042 | 04.01.03.004.00033 | 01.01.01.001.00001 |
| 85- Telephony Costs | 0.0097 | 04.01.03.004.00043 | 01.01.01.001.00001 |
In order to apply the theory to a realistic situation, we have investigated all economic events registered during the period of two consecutive years in a Brazilian small company located at São Paulo State. The data set contains 2075 daily transactions, with 1356 registered in the first year and 719 in the second year. The transactions and their accounting entries were coded according to a Brazilian specific chart of accounts with five levels.
We obtain measures of information inherent to the structure of the company chart of accounts. The company we are considering has a code with five pieces to discriminate uniquely their transactions. Thus, the classification process can be analyzed according to five different levels of aggregation. Table 1 shows some economic events , their relative frequencies , and their classification () according to the chart of accounts at Level 5. In the table, a typical classification is given by a pair of accounts, specified by the debt and credit columns.
The probability of economic events that are classified as is a matrix characterized by all entries being either one or zero, and having one, and only one, non-zero element in each row. At level 5 in the chart of accounts code each classification is associated to a single event. When the accounts are aggregated, a single classification may be used to classify more than one event. However, a specific event remains classified in only one , and in this situation we have a deterministic accounting channel.
| CA | First year, bits | Second year, bits | ||||
|---|---|---|---|---|---|---|
| levels | ||||||
| 5 | 0.000 | 4.005 | 1.000 | 0.000 | 5.519 | 1.000 |
| 4 | 0.930 | 3.075 | 0.869 | 1.663 | 3.855 | 0.823 |
| 3 | 1.460 | 2.545 | 0.777 | 2.406 | 3.112 | 0.721 |
| 2 | 1.776 | 2.229 | 0.715 | 2.985 | 2.534 | 0.629 |
| 1 | 1.827 | 2.178 | 0.705 | 3.066 | 2.453 | 0.611 |

To evaluate the information measures at each level of classification we use the algorithm developed in section 4 carried out using the R-Software (R-code is presented in the Appendix A). Table 2 shows the values of , , , and at each level of classification for each year. The company has less variety of economic events in the first year () compared to the second one (), resulting in a lower entropy for the first year. An increase of from Level 5 to Level 1 is observed since uncertainty about the economic events increases as the classifications are performed at more aggregated levels. The loss of information relative to the economic events is given by and , and whose decreasing values from Level 5 to Level 1 indicate a reduction of association between economic events and their classifications at more aggregated levels. For a specific year, the value of provides an information criterion to compare accounting classifications at different levels in the chart of accounts. To compare different time periods it is better to consider the normalized metric , which can be used as an index indicating the strength of dependence between the economic events and their classifications. The Level 5 has since each classification corresponds to a specific economic event. Then, decreases relatively to Level 5, attaining its minimum value at Level 1, which has the smaller number of classification states. Compared at Level 1, the symmetric uncertainty for the first and the second years is and , respectively. Therefore, for this company, the first year has a higher degree of dependence between economic events and its classifications. In Figure 3a and 3b, values of and were plotted for each level of classification, respectively. Differences over the years are expected once the company changes its set of activities. The more aggregated the classification, the closer the values of mutual information. However, the study of more aggregate levels is useful for improving financial statement analysis. From Fig. 3b we see that differences over periods at more aggregated levels are evidenced by the values of . In particular, the first level of classification in the chart of accounts should contain only the main accounts, such as assets, liability, equity, and so on, which is common to all accounting standards. Then the symmetric uncertainty at the first level of classification can be used as an index in a financial statement analysis to distinguish between classifications over the years. We also suggest as an index to compare the information in the accounting classification for different sectors, or different accounting choices and standards.
6 Concluding remarks
In this work a matrix formalism for the information theory formulation of the accounting classification process was presented. An algorithm generalizing the procedure of Lee and Bedford [23] for the calculation of information theoretic measures in the accounting classification process was proposed. The algorithm provided a matrix procedure suitable for software implementation integrated to information systems. The algorithm was applied to evaluate information theoretic measures, mutual information and symmetric uncertainty, for daily transactions recorded by a small company during two years. We have verified an information loss inherent to aggregation of levels in the chart of accounts. To the best of our knowledge, this is the first calculation of information theoretic measures for the accounting classification process of a company. In particular, the symmetric uncertainty at the first level of classification in a chart of accounts seems to be a useful parameter for comparing companies over time or in different sectors or different accounting choices and standards. Furthermore, the accounts at the chart of accounts first level are commonly used to form financial and economic indexes to characterize the firm. Since the symmetric uncertainty contains the proportion of information shared between the main accounts and all the economic events, it can be used itself as a global index associated to the company. The relation between symmetric uncertainty and the financial and economic indexes deserves a further study and will be addressed in a future work.
It is worthwhile to mention that the probabilities used by the proposed procedure were entirely based on observed frequencies. On the other hand, the probabilities can be considered as parameters in a theoretical analysis of different classification standards and may be a useful quantitative tool in the searching for the a priori most adequate level of classification.
We hope that this work may contribute to highlight Accounting as an interesting field for interdisciplinary research, and also to renew and stimulate the application of information theoretic tools in the accountancy practice.
Appendix A. Algorithm in R language
In the following we transcribe the code implemented to obtain the mutual information. Input files can be obtained by e-mail to the authors.
# Algorithm for mutual information calculation
#
# The inputs are in the csv file -----
freqs <- read.table("inputs.csv",header=TRUE,sep=";")
attach(freqs)
Tot <- length(freqs)
Tot
# Tot are the number of columns in the dataframe "freqs"
#
# The Probability Block --------------
#
# Px: the probability of economic events,
# the first dataframe column:
R <- length(Freqx)
R
Px <- matrix(Freqx,nrow=1,ncol=R,byrow=TRUE)
#
# PyGx Probability of y given x,
# The last S dataframe columns:
S = Tot - 1
S
PyGx <- data.matrix(freqs[,2:Tot])
#
# Py: probability of classification y
Py <- Px %*% PyGx
#
# Additional Matrices: Pxd e Pydm1
Pxd <- diag(Freqx)
Freqy <- colSums(Py)
Freqy2 <- 1/Freqy
Pydm1 <- diag(Freqy2)
#
# PxGy: probability of x, given y
Mult1 <- PyGx %*% Pydm1
PxGy <- Pxd %*% Mult1
#
# Additional matrix: Lx
FreqxLog2m <- -log2(Freqx)
Lx <- matrix(FreqxLog2m,nrow=R,ncol=1)
#
# Additional matrix: Ly
FreqyLog2m <- -log2(Freqy)
Ly <- matrix(FreqyLog2m,nrow=S,ncol=1)
#
# Transpost of PxGy
PxGyT <- t(PxGy)
#
# Additional matrix: Lxy
Lxy <- PxGy
for (i in 1:R){
for (j in 1:S){
if (Lxy[i,j] != 0){Lxy[i,j] <- -log2(Lxy[i,j]) }
}
}
#
# The Entropy Block ------------------
# H(x): Entropy for the economic events
Hx <- Px %*% Lx
print(Hx,digits=12)
#
# H(y): Entropy for classifications (not used)
Hy <- Py %*% Ly
print(Hy,digits=12)
#
# Conditional entropy (vector), HxGy
HxGy <- diag(PxGyT %*% Lxy)
#
# Conditional entropy (average), H(X/Y):
HxBy <- Py %*% HxGy
print(HxBy,digits=12)
#
# The Information Block --------------
# Ixy: the mutual information
Ixy <- Hx - HxBy
print(Ixy,digits=12)
#
# Uxy: Symmetric uncertainty
Uxy = 2.0*Ixy/(Hx+Hy)
print(Uxy,digits=12)
#
detach(freqs)
rm(freqs,i,j,R,S,Tot,Hx,Hy,HxGy,HxBy,Ixy,Uxy,Mult1)
rm(Px,Pxd,PxGy,Lxy,PxGyT,Lx,Ly,Py,Pydm1,PyGx)
rm(FreqxLog2m,Freqy,Freqy2,FreqyLog2m)
ls()
References
References
- [1] C. E. Shannon, A mathematical theory of communication, Bell System Technical Journal 27 (1948) 370–423.
- [2] E. T. Jaynes, Information theory and statistical mechanics, Physical Review 106 (1957) 620–630.
- [3] C. H. Bennett, P. W. Shor, Quantum information theory, IEEE Transactions on Information Theory 44 (6) (1998) 2724–2742.
- [4] E. M. F. Curado, A. Plastino, Information theory link between maxent and a key thermodynamic relation, Physica A 386 (1) (2007) 155–166.
- [5] F. S. Navarra, O. V. Utyuzh, G. Wilk, Z. Wlodarczyk, Information theory approach (extensive and nonextensive) to high-energy multiparticle production processes, Physica A 340 (1–3) (2004) 467–476.
- [6] A. M. Kowalski, A. Plastino, A. N. Proto, Information theory and chaotic motion, Physica A 327 (1–2) (2003) 135–139.
- [7] H. Touchette, S. Lloyd, Information-theoretic approach to the study of control systems, Physica A 331 (1–2) (2004) 140–172.
- [8] D. J. C. MacKay, Information Theory, Inference, and Learning Algorithms, Cambridge University Press, United Kingdon, 2003.
- [9] T. M. Cover, J. A. Thomas, Elements of information theory, Wiley-Interscience, 2006.
- [10] S. Kulback, Information Theory and Statistics, Wiley, 1951.
- [11] A. S. Ribeiro, R. Riera, An information-based tool for inferring the nature of deterministic sources in real data, Physica A 392 (20) (2013) 5053–5064.
- [12] A. Dionisio, R. Menezes, D. A. Mendes, Mutual information: a measure of dependency for nonlinear time series, Physica A 344 (1–2) (2004) 326–329.
- [13] O. A. Rosso, H. Craig, P. Moscato, Shakespeare and other english renaissance authors as characterized by information theory complexity quantifiers, Physica A 388 (6) (2009) 916–926.
- [14] P. L. Brockett, Information theoretic approach to actuarial science, Transactions of the society of actuaries 43 (1991) 73–114.
- [15] P. L. Brockett, A. Charnes, W. W. Cooper, D. Learner, F. Y. Phillips, Information theory as a unifying statistical approach in marketing research, European Journal of Operational Research 84 (1995) 310–329.
- [16] A. Golan, Information and entropy econometrics a review and synthesis, Foundations and Trends in Econometrics 2 (2006) 1–146.
- [17] M. E. de Oliveira, L. L. Menegaldo, P. Lucarelli, B. L. B. Andrade, P. B chler, On the use of information theory for detecting upper limb motor dysfunction: An application to parkinson s disease, Physica A 390 (23–24) (2011) 4451–4458.
- [18] T. Wilhelm, J. Hollunder, Information theoretic description of networks, Physica A 385 (1) (2007) 385–396.
- [19] H. Haken, Information and Self-Organization: A Macroscopic Approach to Complex Systems, Springer, Berlin, 2006.
- [20] J. S. Demski, Is accounting an accademic discipline?, Accounting Horizons 21 (2007) 153–157.
- [21] N. M. Bedford, V. Baladouni, A communication theory approach to accountancy, Accounting Review 37 (1962) 650–659.
- [22] C. L. Bostwick, The use of information theory in accounting, Management Accounting 49 (1968) 11–17.
- [23] L. C. Lee, N. M. Bedford, An information theory analysis of the accounting process, Accounting Review 44 (2) (1969) 256–275.
- [24] B. Lev, Information theory analysis of budget variances, Accounting Review 44 (4) (1969) 704–710.
- [25] H. Theil, On the use of information theory concepts in the analysis of financial statements, Management science 15 (1969) 459–480.
- [26] A. d’Arcy, Accounting classification and the international harmonization debate an empirical investigation, Accounting Organizations and Society 26 (2001) 327–349.
- [27] C. Nobes, Accounting classification and the international harmonisation debate, Accounting, Organizations and Society 29 (2004) 189–200.
- [28] C. Nobes, Accounting classification in the ifrs era, Australian Accounting Review 46 (2008) 191–198.
- [29] J. A. Christensen, J. S. Demski, Accounting Theory: An information content perspective, McGraw-Hill, 2003.
- [30] R. J. Willet, An axiomatic theory of accounting measurement structures, IMA Journal of Management Mathematics 3 (1) (1991) 45–59.
- [31] B. J. Epstein, W. R. King, An experimental study of the value of information, Omega-The International Journal of Management Science 10 (3) (1982) 249–258.
- [32] F. Brochet, Information content of insider trades before and after the sarbanes-oxley act, Accounting Review 85 (2) (2010) 419–446.
-
[33]
R Development Core Team, R: A Language and
Environment for Statistical Computing, R Foundation for Statistical
Computing, Vienna, Austria, ISBN 3-900051-07-0 (2008).
URL http://www.R-project.org - [34] I. H. Witten, E. Frank, M. A. Hall, Data mining : practical machine learning tools and techniques, 3rd Edition, Morgan Kaufmann, Burlington, MA 01803, USA, 2011.
-
[35]
H. Averkamp, AccountingCoach.
URL www.accountingcoach.com