High-resolution C+ imaging of HDF 850.1 reveals a merging galaxy at z=5.185
New high-resolution maps with the IRAM Interferometer of the redshifted C+ 158 m line and the 0.98 mm dust continuum of HDF 850.1 at = 5.185 show the source to have a blueshifted northern component and a redshifted southern component, with a projected separation of 0.3′′, or 2 kpc. We interpret these components as primordial galaxies that are merging to form a larger galaxy. We think it is the resulting merger-driven starburst that makes HDF 850.1 an ultraluminous infrared galaxy, with L⊙. The observed line and continuum brightness temperatures and the constant line-to-continuum ratio across the source imply (1) high C+ line optical depth, (2) a C+ excitation temperature of the same order as the dust temperature, and (3) dust continuum emission that is nearly optically thick at 158 m. These conclusions for HDF 850.1 probably also apply to other high-redshift submillimeter galaxies and quasar hosts in which the C+ 158 m line has been detected, as indicated by their roughly constant C+-to-158 m continuum ratios, in sharp constrast to the large dispersion in their C+-to-FIR luminosity ratios. In brightness temperature units, the C+ line luminosity is about the same as the predicted CO(1–0) luminosity, implying that the C+ line can also be used to estimate the molecular gas mass, with the same assumptions as for CO.
Key Words.:
galaxies: high-redshift – galaxies: kinematics and dynamics – galaxies: ISM – galaxies: individual (HDF 850.1)1 Introduction
HDF 850.1, the brightest submillimeter galaxy (SMG) in the Hubble Deep Field, has been shown by Walter et al. (2012) to have redshift of = 5.2, and to lie in a group of at least 12 galaxies in a redshift bin from =5.18 to 5.21, in the GOODS-N field containing the Hubble Deep Field. We now continue the observations of Walter et al. (2012; see that paper for references to earlier multi-wavelength data on HDF 850.1), and report follow-up, higher-resolution maps in the redshifted C+ 158m line and the 0.98 mm dust continuum. Walter et al. presented a rotating disk interpretation of the C+ data. We now present an alternative interpretation, regarding the new observations as evidence for a galaxy merger. We also use the new data to update our previous model (Walter et al. 2012) for the gravitational lensing by the = 1.2 elliptical galaxy 3-586.0.
The higher resolution enables us, for the first time for HDF 850.1, to measure the dust brightness temperature, and hence to estimate the dust optical depth at rest-frame 158m. These new observations also allow us to better resolve the C+ line, and hence to map for the first time the C+-to-dust flux density ratio across the source, which turns out to be nearly constant. We compare this result with the C+-to-dust ratio in other high-redshift galaxies, and discuss the interpretation, on kpc scales, of C+ at high-, and the possible use of the C+ line to estimate the gas mass.
In the light of these new observations, we discuss why there is as yet no rest-frame optical or UV counterpart to HDF 850.1, and we summarize the evidence for our merger interpretation.
2 New long-baseline observations and results
To further investigate HDF 850.1’s morphology, we re-observed its C+ line and adjacent millimeter continuum with the IRAM Plateau de Bure interferometer in the A configuration, with long baselines to 760 m, in February 2012, and in the B configuration in March 2012. We combined the new data with the earlier observations (Walter et al. 2012) from November 2011, in the shorter-baseline C-configuration. All data were taken in excellent radio “seeing” (phase errors corresponding to 0.10.3′′) and low zenith opacity (0.130.35 at 0.98 mm wavelength). The observations were made at 307.267 GHz (0.98 mm), the frequency of the redshifted 2PP1/2 fine-structure line of C+ at a redshift of . Receiver temperatures were 45 to 65 K. The wideband correlator covered the 305.6309.2 GHz frequency band in both polarizations. We calibrated the bandpass on 3C84 and 0851202. Time-dependent gains were calibrated in amplitude and phase by interleaving observations of HDF 850.1 with 1150+497 and 1300+580. The flux density scale is relative to an assumed flux density of 2.35 Jy of MWC349 at 307 GHz. The uncertainties in the flux calibration are less than 10%. For maximum sensitivity in line and continuum, we used natural weighting for the visibilities. The projected baselines, ranging from 23 to 780 k, gave a synthesized beam of 0.380.29′′ at PA +59∘. For the nominal phase center, we used the HDF 850.1 position measured by Downes et al. (1999; 12:36:51.980, 62:12:25.70, J2000). For our new measurements, the positional uncertainty of this nominal phase center was verified on 1150+497 and 1300+580, and estimated to be smaller than 0.03′′, or one-tenth of the synthesized beam.
For the continuum, we used two line-free regions adjacent to the C+ line, covering a total of 2 GHz. For the C+ line, we subtracted the continuum in the (u,v) plane, and binned the data into 40 MHz (39 km s-1) channels. The r.m.s. noise in the maps is 0.21 mJy beam-1 in the continuum, and 1.42 mJy beam-1 per 40 MHz channel in the line.
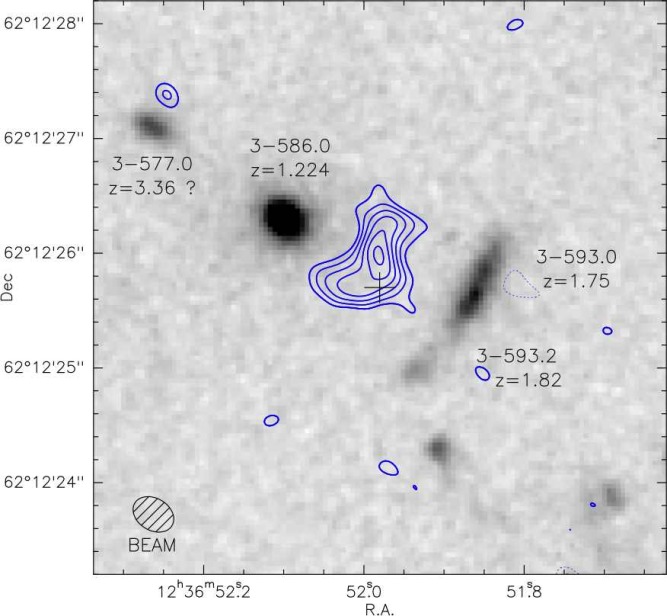
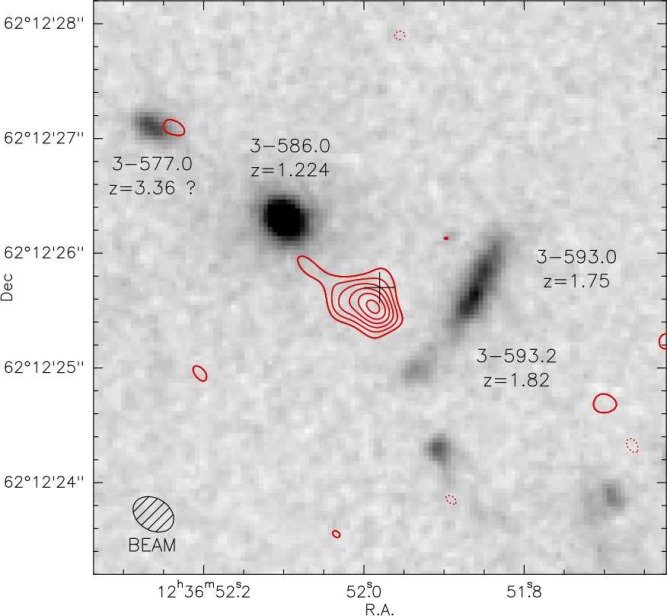
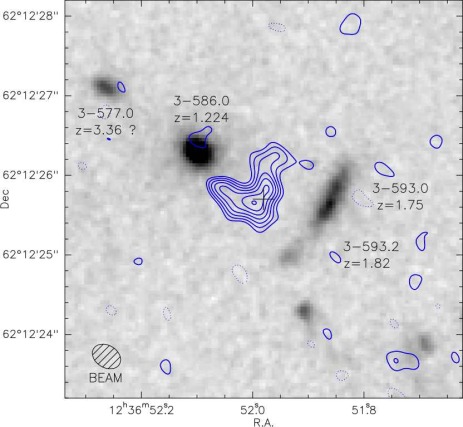
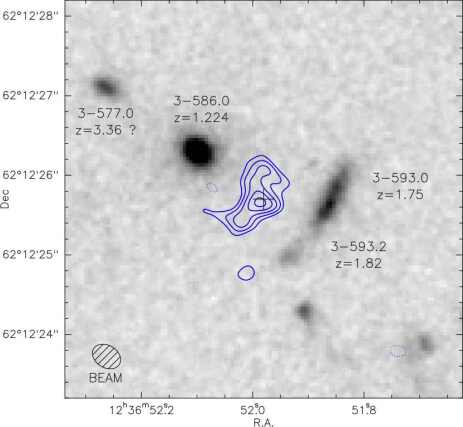
Figure 1 shows two velocity-integrated maps of the C+ line, with the continuum subtracted. They clearly show two distinct peaks, with a separation of 0.3′′, or a projected distance of 2 kpc,111We assume =71 km s-1 Mpc-1, =0.27, and =0.73, which gives an angular scale of 6.295 kpc (arcsec)-1 at = 5.185. which we interpret as evidence for a merger of two galaxies, with the blueshifted galaxy to the north, and the redshifted galaxy to the south. The lower-intensity emission around the two peaks covers an overall extent, down to the contours, of 1.1′′ (projected size 7 kpc), in the southeast-to-northwest direction. Table 1 lists the source positions, fluxes, and apparent sizes derived from (u,v) fits to these maps. We see no ordered pattern of velocities suggesting rotation, neither in channel maps, nor in second-moment velocity contour maps (not shown here). This absence of an ordered, monotonically progressing velocity pattern is similar to that observed in the sample of submillimeter galaxy (SMG) mergers studied by Menéndez-Delmestre et al. (2013).
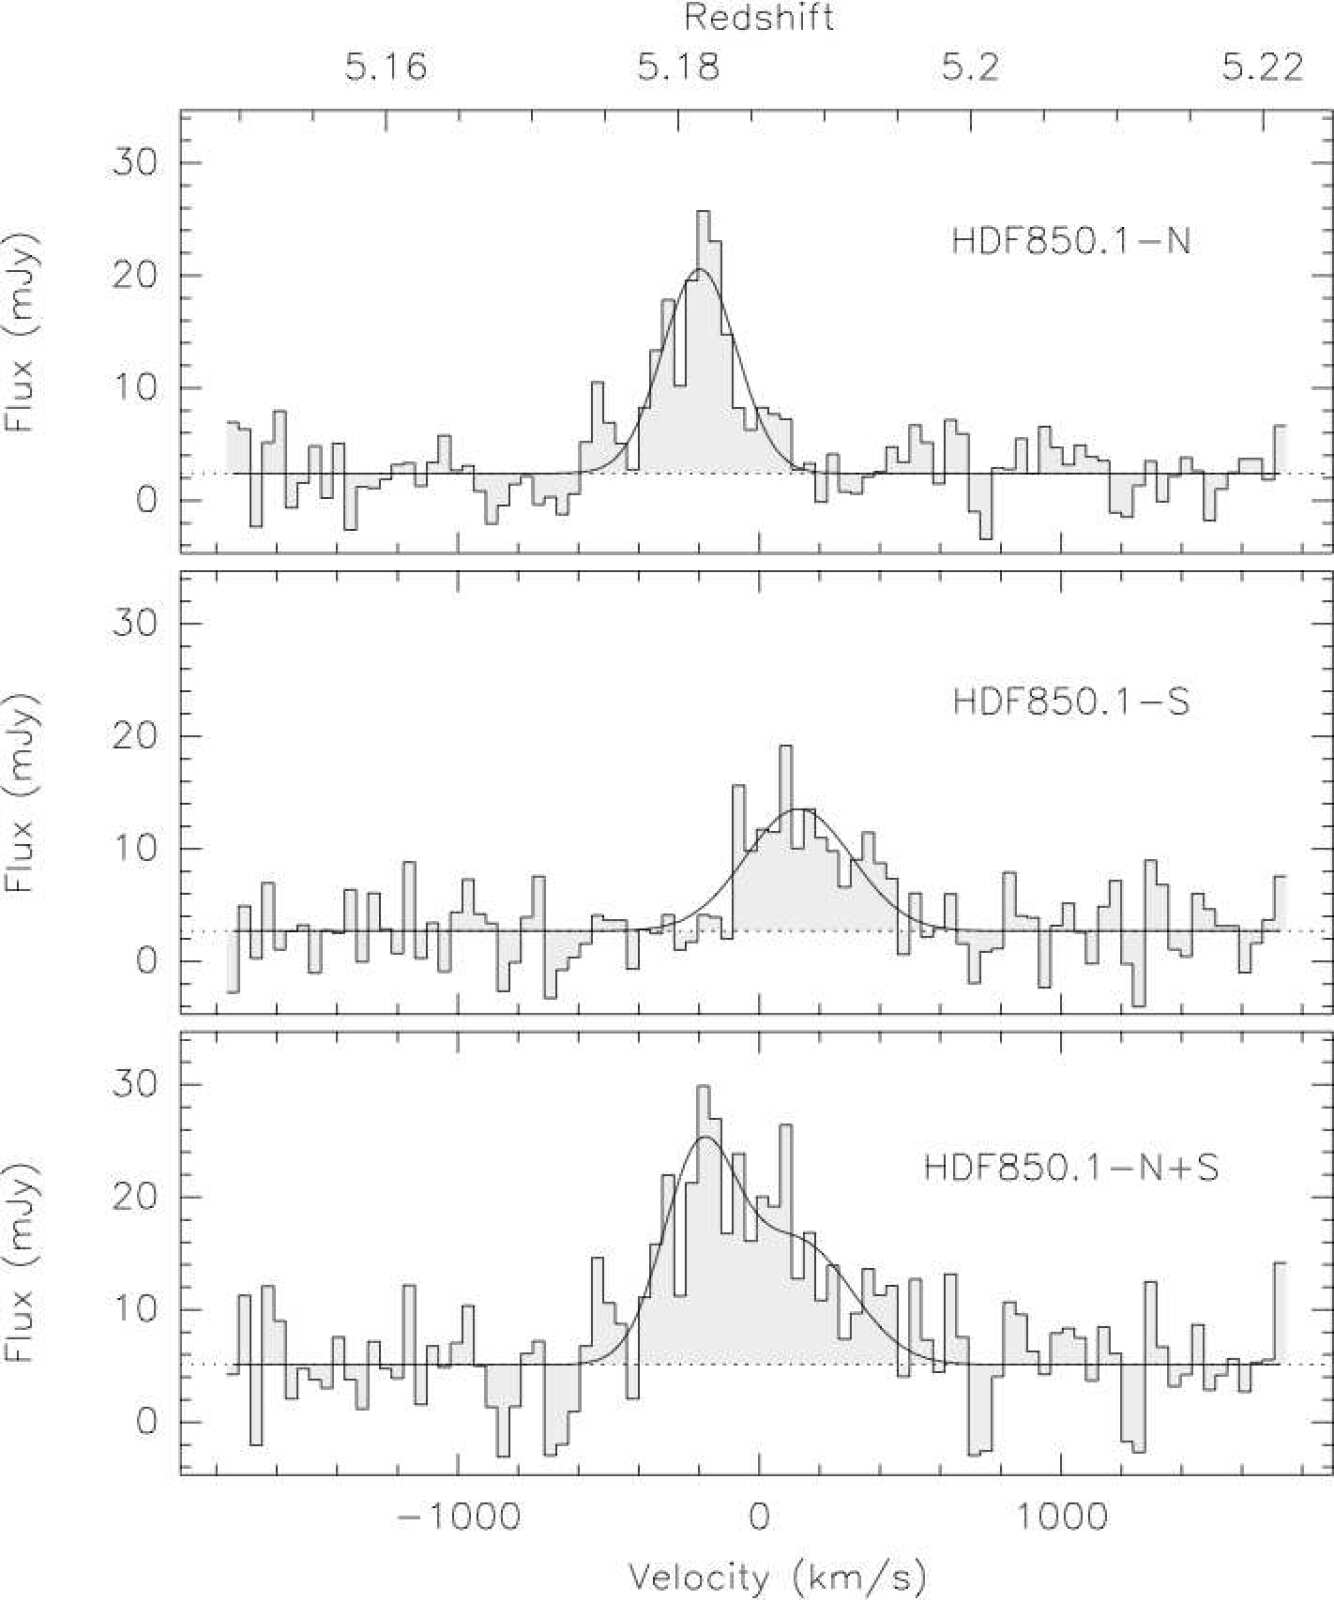
Further evidence for a merger comes from the spectral profiles of the two components. Figure 2 shows the C+ spectra, spatially integrated over the blueshifted North galaxy, the redshifted South galaxy, and the total spectrum, spatially integrated over both North+South galaxies together. Both the North and South C+ line profiles appear roughly Gaussian, with large linewidths, and km s-1, respectively. These are linewidths typical of individual galaxies, or individual, rapidly rotating, compact circumnuclear disks, rather than linewidths expected at opposite ends of a large ( kpc), quiescent, rotating disk.
Furthermore, the blueshifted, North galaxy (Fig. 1, left) is spatially extended, while its line profile (Fig. 2, upper) has a somewhat smaller width ( km s-1). In contrast, the redshifted, South galaxy is compact (Fig. 1, right), less intense, and wider in velocity ( km s-1).
From these spatial and spectral differences, and the large total width of the line (940 km s-1), we speculate that the two components may not be in the same plane (so not in a disk), and that we are looking at the merging of two galaxies with different inclinations, with the North galaxy possibly more face-on than the South galaxy.
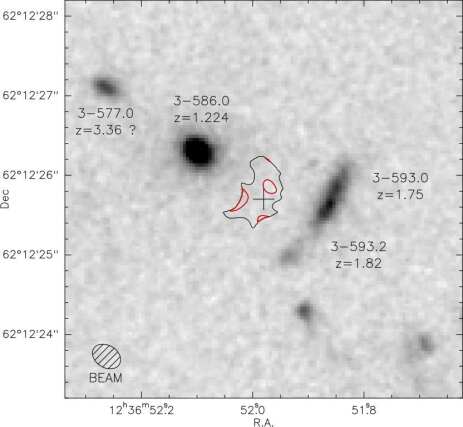
Figure 3 (left) is a map of the C+ line flux density, in mJy beam-1, averaged over the line full width of 940 km s-1. The contours have an irregular V-like shape, similar to those of interacting systems, rather than a single, undisturbed disk galaxy. Figure 3 (middle) shows a map of the redshifted 158 m dust continuum emission, and Fig. 3 (right) shows the ratio of the velocity-integrated C+ emission to the redshifted 158 m continuum over the source. The continuum map looks slightly different from the line maps in Fig. 1, probably because of the difference in signal-to-noise ratios between the line and continuum maps. Furthermore, the broad-band continuum is a blend of dust emission from both the North and South galaxies, in the region where these two components overlap. The line-to-158 m continuum ratio (Fig. 3, right) is nearly constant across the source, with a value of about 1.5.
| R.A. | Dec. | Major | Minor | P.A. | C+ | Velocity | C+ | Dust | |
| 12h36m | 62 | axis | axis | Peak | at peak | flux | flux | ||
| Data | J2000 | J2000 | arcsec | arcsec | deg. | mJy | km s-1 | Jy km s-1 | mJy |
| HDF 850.1 C+ line: | |||||||||
| North galaxy | |||||||||
| 440 to 30 km s-1: | 51.989s | 18.8 | 200 | 6.9 | 2.2 | ||||
| South galaxy | |||||||||
| +30 to +500 km s-1: | 51.993s | — | 11 | +130 | 3.0 | 2.4 | |||
| HDF 850.1 dust continuum at 0.98 mm: | |||||||||
| North+South galaxies | |||||||||
| together: | 51.993s | — | — | 9.9 | 4.6 | ||||
| Lensing elliptical galaxy: | |||||||||
| 3-586.0 at = 1.224: | 52.090s | 26.30′′ | — | — | — | — | — | — | |
| Notes: C+ and dust positions, sizes, and fluxes are from the maps and from Gaussian fits in the (u,v) plane. | |||||||||
| C+ peak fluxes and velocity peaks are from Gaussian fits to the spatially-integrated spectrum. | |||||||||
| Errors: positions: in R.A. and in Dec.; sizes: ; P.A.: ; C+ fluxes: 10%; dust flux 20%. | |||||||||
| Velocities of the C+ line peaks are relative to 307.267 GHz (C+ 158 m at ). Errors are 20 km s-1. | |||||||||
| Position of the elliptical galaxy is from Barger et al. (2008). | |||||||||
| Dust continuum limit for the elliptical is the 5 limit from this paper, Fig. 3 (middle). | |||||||||
| Parameter | North | South | Dust |
|---|---|---|---|
| galaxy | galaxy | continuum, | |
| C+ line | C+ line | both galaxies | |
| Uncorrected for lensing: | |||
| Measured () offset from elliptical | () | () | () |
| Apparent luminosity [ L⊙] | |||
| Apparent line luminosity [ K km s-1 pc2] | — | ||
| Corrected for lensing: | |||
| True, undeflected () offset from elliptical | () | () | () |
| lens magnification factor | 1.7 | 1.5 | 1.6 |
| Corrected luminosity [ L⊙] | |||
| Corrected line luminosity [ K km s-1 pc2] | — | ||
| Gas Mass (H2+He) [M⊙] | — | ||
| Corrected angular diameters | |||
| True radius | 1.3 kpc | 0.9 kpc | 1.3 kpc |
| Notes: Positions are from Gaussian fits in the (u,v) plane, with errors of in R.A. and in Dec. | |||
| is for emitted wavelengths 40 to 120 m; (5 to 1000 m) is typically 30% higher. | |||
| Lens model: singular isothermal sphere at = 1.224, with velocity dispersion = 150 km s-1. | |||
| Derived values are for = 1.299 Gpc at = 5.185, and 6.295 kpc (arcsec)-1, for assumed values of | |||
| = 0.27, = 0.73, and = 71 km s-1 Mpc-1 (for formula, see e.g., Buchalter et al. 1998). | |||
3 Lensing by the elliptical galaxy 3-586.0 at = 1.224
The C+-line contours in Fig. 1 are superposed on a greyscale version (Downes et al. 1999) of the BVI image from the Hubble Deep Field, showing, as has been known for some time, that there are no optical counterparts at the positions of the merger galaxies in HDF 850.1. This superposition also shows clearly that the lines of sight to both of the merger components of HDF 850.1 pass close to the compact elliptical galaxy 3-586.0 (Williams et al. 1996), so both of the merger galaxies are subject to weak gravitational lensing.
With our new measured positions for the HDF 850.1 North and South galaxies, we re-computed the gravitational lensing effect by the = 1.2 elliptical galaxy 3-586.0. We took the position of this elliptical galaxy from Barger et al. (2008). Our measured C+ position of the North galaxy is at () = (, ) from the center of the elliptical; the South galaxy is at (, ). We modeled the lens as a singular isothermal sphere, at redshift = 1.224 (Barger et al. 2008), with velocity dispersion 150 km s-1 (Dunlop et al. 2004). We assumed reasonable values for the true (undeflected) offsets of the two HDF 850.1 galaxies in R.A. and Dec., and slowly varied these assumed offsets until the predicted lensed images of the two galaxies fell at their observed (deflected) displacements from the elliptical. Table 2 gives the results.
In this model, the lensing magnification is 1.7 for the North galaxy, and 1.5 for the South galaxy. The predicted galaxy images are arcs with long axes roughly along PA = (southeast to northwest), and this is approximately the mean direction of the observed C+ intensity contours. When the observed image diameters listed in Table 1 are corrected for these magnifications, then the corrected image sizes become nearly circular, with radii of 1.3 and 0.9 kpc for the C+ emitting regions in the North and South galaxies, respectively.
4 Dust brightness temperature and dust optical depth at 158 m
4.1 Measured brightness temperatures
In radio astronomy, we measure brightness temperatures, which are defined by the Rayleigh-Jeans formula (e.g., Pawsey & Bracewell 1955). This definition has nothing to do with whether radio sources are “in the Rayleigh-Jeans regime”, or even whether the radiation is thermal or nonthermal. Defined this way, the measured brightness temperatures are extremely useful because they are directly proportional to source brightness in units of Jy per solid angle. We can therefore write radiative transfer equations directly in terms of our measured brightness temperatures, in a much less complicated form than if we would use thermodynamic quantities like dust grain temperatures, spectral line excitation temperatures, or the 2.7 K cosmic background radiation temperature. Fortunately, it is easy to convert from measured brightness temperature to the radiation temperature of an equivalent blackbody, by equating the Rayleigh-Jeans formula to the Planck formula. For, e.g., the cosmic background, this yields:
| (1) |
where is the measured brightness temperature at the telescope, and is the thermodynamic (Planck) temperature. For example, at the frequency of this project, 307 GHz, if we observed the 2.7 K cosmic background, then at the telescope, we would measure a brightness temperature of only 0.063 K, not the 2.7 K radiation temperature of the cosmic background.
We now show that because the measured brightness temperature of the HDF 850.1 continuum source is relatively high, the dust radiation must be nearly optically thick.
4.2 Application to the dust continuum of HDF 850.1
We measure a dust continuum flux density of 4.6 mJy at 0.98 mm, and a source diameter of 0.4′′. These parameters correspond to a measured brightness temperature of = 0.54 K at 0.98 mm. Corrected for (1+), this corresponds to = 3.3 K at 158 m. Here, the primed symbol indicates the standard radio astronomy brightness temperatures, defined via the Rayleigh-Jeans formula, which is directly proportional to the brightness, in units of Jy sr-1.
The gravitational lensing has no effect here, because the lensing amplification of the source flux and the lensing magnification of the source area are the same, so the gravitational lensing preserves brightness temperature.
For simple radiative transfer in a homogeneous medium, the observed brightness temperature is
| (2) |
where and are the Rayleigh-Jeans equivalents of the dust and background temperatures, and is the dust optical depth.
At = 5.2, the cosmic background (Planck) temperature is 16.9 K, and at 158 m, its Rayleigh-Jeans equivalent is = 0.4 K, so at this wavelength, even at a redshift of 5.2, the radiative-transfer correction for the cosmic background is small.
This means that if were , the dust temperature would be + 0.4 K, or 3.7 K, which corresponds to a Planck temperature of = 28 K. This is the minimum dust temperature allowed by the observations. It corresponds to the limit of the dust being highly optically thick at 158 m. In general, in eq(2), for a measured brightness temperature, , the inferred dust temperature, , varies inversely as the factor containing the optical depth. If, for example = 0.6, then increases to 7.7 K, which corresponds to a Planck temperature of = 36 K.
We can also reverse the argument and adopt a dust temperature to derive the dust optical depth. Fits to the measured continuum fluxes of HDF 850.1 with ULIRG templates (e.g., Walter et al. 2012) indicate that the dust temperature is 45 K, or an equivalent Rayleigh-Jeans dust temperature of 14 K at 158m. From eq(2), for our measured continuum brightness temperature, this gives a dust optical depth of = 0.4 at 158 m, so the dust is starting to become optically thick as one approaches the peak of the FIR continuum. If the true dust temperature is somewhat lower, like the 30 to 35 K inferred for many submillimeter galaxies, then the dust optical depth will be close to unity at 158 m.
5 Excitation temperature of the C+ line
Similar reasoning holds for the C+ line. From the observed line fluxes and source angular sizes (Tables 1 and 2), we obtain peak brightness temperatures, corrected by , of 10.7 and 4.7 K for HDF 850.1 N and S respectively, if the sources have a Gaussian shape, and 21.4 and 7.9 K respectively, if they are disks. From the analogs of eqs(1) and (2) for line excitation temperature, we can show that these brightness temperatures correspond to line excitation temperatures in the range 30 to 50 K if the C+ line is optically thick (). This is exactly in the range deduced for the dust temperatures from the SED fitting by Walter et al. (2012), and for the gas kinetic temperatures that are consistent with the escape-probability fits by Walter et al. to their observed lines in the CO ladder. Because we are directly observing C+ line brightness temperatures comparable to the gas and dust temperatures, we conclude that the C+ lines are optically thick.
A second argument that the C+ lines are optically thick comes from the fact that, in brightness-temperature units (K km s-1 pc2), the C+ and CO(1–0) line luminosities are roughly the same (see discussion in Section 8). Because the C+ and CO line profiles are very similar, with nearly the same linewidths (Walter et al. 2012), then if the emitting areas are about the same, the C+ and CO line brightness temperatures must also be roughly the same. Because, in general, the CO(1–0) lines are optically thick and trace the gas temperature, the same must then also be true of the C+ line.
A third argument that C+ is optically thick comes from the escape-probability program RADEX (van der Tak et al. 2007). For K and for plausible H2 densities cm-3 and C+ column densities cm-2, the program predicts a C+ line excitation temperature of 29 K, about the same as the gas kinetic temperature, and a line optical depth 6.
Similar conclusions about the optical depth of the C+ 158 m line in galaxies have been reached by many other authors (e.g., Crawford et al. 1985; Stacey et al. 1991a; Stacey et al. 1991b (from observations of 13C+); Mashian et al. 2013).
Note also that although the energy needed to singly ionize carbon is 11 eV, or K, the excitation temperature of the C+ 158 m line is much lower, 30 to 50 K. This excitation may be provided by collisions with hydrogen molecules at the kinetic temperatures typical of warm molecular clouds in starburst galaxies. We therefore assume the C+ line excitation temperature is the same as the dust and gas kinetic temperatures.
If all this is correct, then the C+ line must be opaque, because with an excitation temperature in this “low” range, an optically thin C+ line would be hard to detect at cosmological distances.
We can now use these ideas to predict the C+-to-dust continuum flux ratio. We apply the same argument as used by Downes et al. (1993) to predict the ratio of the CO line flux to 100 m continuum flux in ULIRGs.
In this case, however, we are trying to predict the C+-to-dust flux ratio at the same rest wavelength, namely 158 m, so to first order, the C+-to-dust continuum flux ratio simplifies to
| (3) |
where , , and are the Rayleigh-Jeans equivalents of the line excitation temperature, the cosmic background temperature, and the dust temperature. The optical depths are for the line, and for the dust. We assume that the solid angles, and , of the C+ line and dust continuum sources are the same.
So for an optically thick C+ line, with , and with similar line and continuum source sizes, , and similar line excitation and dust temperatures, , eq(3) becomes
| (4) |
or, if the dust is optically thin, simply
| (5) |
For a dust optical depth close to unity at the FIR peak near 100 m, as is the case for many ULIRGs and dusty, high-redshift submillimeter galaxies, the line-to-continuum flux ratio should approach unity.
For HDF 850.1, we can compare these ideas directly with the observations. On the velocity-integrated map in Fig. 3, left, the line flux, integrated over the region shown on the continuum map, is 6.5 Jy km s-1. We can divide this integrated line flux by the full linewidth to zero power, or 940 km s-1, to obtain an average flux density over the line, of 6.9 mJy. Dividing this average line flux density by the spatially-integrated dust flux density of 4.6 mJy gives a line-to-continuum ratio of 1.5, as shown in Fig. 3 (right). This line-to-continuum ratio of about 1.5 would fit eq(4) if the dust optical depth were about unity at 158 m. This dust opacity is even higher than we estimated in section 4 by considering the continuum brightness temperature alone, so our conclusion is the same. The observed line and continuum brightness temperatures imply high C+ line optical depth, “low” C+ excitation temperature, of the same order as the dust temperature, with the dust starting to become optically thick near 158 m.
6 Comparison of the line-to-continuum ratio in other high- galaxies
So far, there are only 4 high- objects with subarcsec-beam measurements of the C+ line and the 158 m dust continuum (HDF 850.1, BR120207, J1148+5251, 09520115). Usually the integrated C+ line luminosity is compared with the far-IR or entire infrared luminosity, to see if the C+ line is correlated with the star formation rate. In this paper, our goal is different: we explore the physics of the C+ line, and estimate its optical depth and likely excitation temperature.
Table 3 lists some of the measurements in the literature. Although the argument in the previous section can be given in terms of the peak line brightness temperature, for consistency with our Fig. 3, we prefer comparing HDF 850.1 with other high- galaxies in terms of mean brightness temperature (or flux density per beam area), averaged over the entire line width, i.e., full width to zero power.
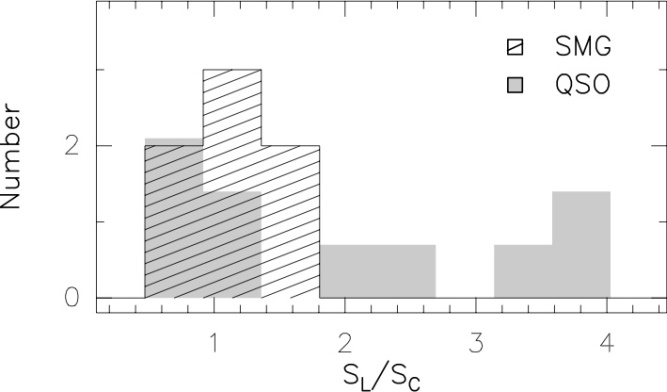
Our comparison shows that unlike the ratios of integrated C+ line luminosity to far-IR luminosity, which have a wide scatter, the observed ratios of mean line brightness temperature to 158 m dust brightness temperature are mostly about 2-to-1, within a range of a factor of two (Table 3 and Fig. 4). Furthermore, unlike the C+-to-FIR luminosity ratios, which seem to have a strong separation between AGNs and starbursts (Maiolino et al. 2009; Graciá-Carpio et al. 2011), the C+-to-158 m brightness temperature ratios (or flux density ratios) only show at most a factor-of-two difference between these two classes of sources. Our mean ratio for the submillimeter galaxy starbursts is , versus a ratio of for the quasar host galaxies, so their mean values actually agree, within the error bars.
This nearly constant ratio confirms that the C+ line is optically thick, with an excitation temperature roughly equal to the dust temperature, and that the dust itself is also nearly optically thick (dust optical depth in the range 0.1 to 1), and that the small variations in the ratio from source to source can mostly be explained by small variations in the dust opacity. To first order, we may say that as the dust radiation starts to become optically thick, it no longer traces mass, as it does at millimeter wavelengths, where the dust is optically thin, but instead it starts to trace the dust brightness temperature at the = 1 surface. Similarly, the optically thick C+ line (like the CO(1–0) line) traces the gas brightness temperature. Insofar as the gas and dust brightness temperatures are about the same, on kpc scales, in the high- sample in Table 3, the C+-to-158 m-continuum brightness temperature ratio will be roughly constant.
In contrast, the C+-to-FIR luminosity ratios vary by at least a factor of 100, as a function of (see, e.g., Cox et al. 2011, their fig.6; Carilli & Walter 2013, their fig.6). The much larger variations in the C+-to-FIR luminosity ratios, are due not only to the variations in dust opacity, but also to the fact that the C+ luminosity varies only as , i.e., Rayleigh-Jeans brightness temperature, whereas for dense dust sources, the far-IR luminosity varies as (Planck) . This means that the C+-to-FIR luminosity ratios have a much greater sensitivity to dust temperature variations than do the C+-to-158 m-continuum flux density ratios. In particular, in “warm” (AGN) sources, the C+-to-FIR luminosity ratios will decrease, relative to “cool” sources, not because the C+ is somehow “quenched”, but simply because the FIR luminosity of the warm dust is so large.
| Source | Spatially- | C+ | C+ line | 158 m | Line to | ||
| Redshift | integrated | linewidth | average flux | continuum | dust | Ref. | |
| line flux | densitya | flux density | flux density | ||||
| (z) | (Jy km s-1) | ( km s-1) | (mJy) | (mJy) | ratio | ||
| High-redshift submillimeter galaxies (SMGs): | |||||||
| HDF 850.1 | 5.2 | 6.5b | 470 | 6.9 | 4.6 | 1.5 | 1 |
| HLS0918 | 5.2 | 107 | 700 | 76 | 103 | 0.7 | 2 |
| BR120207 NW | 4.7 | 15 | 425 | 17.7 | 19.0 | 0.9 | 3, 4 |
| J1424+0223 | 4.2 | 107 | 690 | 77.5 | 90 | 0.8 | 5 |
| HFLS3 | 6.3 | 14 | 470 | 14.9 | 13.9 | 1.1 | 6 |
| ALESS 61.1 | 4.4 | 2.5 | 230 | 5.4 | 4.3 | 1.3 | 7 |
| ALESS 65.1 | 4.4 | 5.4 | 470 | 5.7 | 4.2 | 1.4 | 7 |
| Mean C+ line-to-dust ratio for SMGs: | |||||||
| High-redshift quasar hosts (QSOs): | |||||||
| BR120207 SE | 4.7 | 15 | 600 | 12.5 | 18 | 0.7 | 3, 4 |
| J01290035 | 5.8 | 2.0 | 194 | 5.2 | 2.6 | 2.0 | 8 |
| J02100456 | 6.4 | 0.27 | 300 | 0.45 | 0.12 | 3.7 | 9 |
| J09520115 | 4.4 | 20.1 | 193 | 52.1 | 15.6 | 3.3 | 10 |
| J10440125 | 5.8 | 1.7 | 420 | 2.0 | 3.1 | 0.7 | 8 |
| J1120+0641 | 7.1 | 1.0 | 235 | 2.2 | 0.61 | 3.6 | 11 |
| J1148+5251 | 6.4 | 4.1 | 350 | 5.9 | 4.5 | 1.3 | 12, 13, 14 |
| J1319+0950 | 6.1 | 4.3 | 518 | 4.1 | 5.2 | 0.8 | 8 |
| J20540005 | 6.0 | 3.5 | 242 | 7.1 | 3.1 | 2.3 | 8 |
| J2310+1855 | 6.0 | 9.0 | 392 | 11.4 | 9.1 | 1.3 | 8 |
| Mean C+ line-to-dust ratio for QSOs: | |||||||
| Notes: (a) C+ average line flux density = . | |||||||
| (b) In the region where the C+ and continuum maps overlap. | |||||||
| References: (1) this paper, (2) Rawle et al. 2013, (3) Wagg et al. 2012, (4) Carilli et al. 2013, (5) Cox et al. 2011, | |||||||
| (6) Riechers et al. 2013, (7) Swinbank et al. 2012, (8) Wang et al. 2013, (9) Willot et al. 2013, | |||||||
| (10) Gallerani et al. 2012, (11) Venemans et al. 2012, (12) Maiolino et al. 2005, | |||||||
| (13) Maiolino et al. 2012, (14) Walter et al. 2009. | |||||||
7 Implications for the C+ line physics
In normal, low-redshift quiescent galaxies like the Milky Way, the C+ line comes from a mixture of different environments: on 1-pc scales, from the widely-studied photon-dominated regions (PDRs) at cloud boundaries, on larger scales, from the neutral gas, and from within the bulk of the molecular clouds themselves (see Pineda et al. 2013 for a recent compilation in the Galaxy). In highly-turbulent merger galaxies, however, the mixture percentages are likely to be rather different, especially if the observing beam takes an average over kpc scales, as it does for galaxies at high redshift. For a highly turbulent filament in Stephan’s Quintet, Appleton et al. (2013) estimate that the standard PDR contribution is at most 10 to 15% of the C+ line emission. The large majority of the C+ line emission is coming from collisional excitation of the ionized fraction of carbon within the bulk of the warm molecular gas.
In our picture, on the kpc-scale of our beam, the C+, CO, and dust emission all come from the same volume. Carbon within the molecular clouds is partially ionized by the cosmic rays in the large starburst. The C+ line itself is excited by collisions with hydrogen molecules, and its excitation temperature becomes the same as the kinetic temperature of these collision partners. This picture explains why, at least on kpc scales, the C+ profiles look about the same as the CO profiles: their linewidths, their velocity gradients, and their excitation, by the H2 molecules, are the same.
In HDF 850.1, as explained in the previous sections, the observed line and continuum brightness temperatures imply high C+ line optical depth, “low” C+ excitation temperature, of the same order as the dust temperature, with the dust approaching optical thickness at 158 m. Our interpretation is thus different from the optically-thin C+ model of Mashian et al. (2013), in which the C+ and CO lines are emitted from separate regions of the molecular clouds, with the C+ in a “high-temperature” (500 K) region. Our model is in better agreement with their preferred, uniformly mixed CO and C+ region, although we prefer a somewhat lower kinetic temperature, which is in better agreement with the dust temperatures inferred from standard ULIRG and SMG templates.
8 The (H2)/(C+) conversion factor
Ever since the pioneering days of far-IR airborne astronomy, it has been known that there is a good correlation between the integrated intensities of the C+ and CO(1–0) lines, and therefore that C+ is a tracer of the molecular gas, and not of atomic hydrogen (e.g., Crawford et al. 1985; Wolfire et al. 1989; Stacey et al. 1991). This relation was observed to hold for both Galactic and extragalactic sources, including starburst galaxies. In these earlier papers, the integrated C+ intensities were given in flux units (erg s-1 cm-2 sr-1), with a typical C+-to-CO(1–0) luminosity ratio ranging from 4400 to 6300. For 7 galaxies at = 1 to 2 measured in both C+ and CO, Stacey et al. (2010) found a median ratio of 4400, with a variation of about a factor of two, up and down. In their samples (Stacey et al. 1991a; 2010), cooler, less active, non-starburst galaxies had much lower C+-to-CO(1–0) ratios. From another sample of 10 galaxies from = 2 to 4, Swinbank et al. (2012) obtain a ratio of 4400.
In flux units, the integrated C+ intensities (or line luminosities) contain a factor of frequency , from the conversion from km s-1 to Hz, and another factor of , from the conversion from Rayleigh-Jeans brightness temperature to flux density. If however, we quote line luminosities in brightness temperature units (K km s-1 pc2), then we must divide these earlier C+-to-CO(1–0) luminosity ratios by the cube of the frequency ratio, or (1900.5369 GHz /115.2712 GHz)3, which is 4482. From the observed ratios quoted above, this means that the C+-to-CO(1–0) luminosity ratio, when expressed in brightness temperature units, is close to unity, i.e., to within a factor about two, the (C+ 158 m) (CO(1–0)).
Because of this approximate equality of the C+ and CO(1–0) luminosities, and because the CO(1–0) luminosity is roughly proportional to the molecular gas mass, we can therefore use the C+ luminosity to estimate the molecular gas mass, with nearly the same conversion factor as for CO(1–0). The assumptions and justification for using a C+ conversion factor are thus the same as for using a CO conversion factor.
This is fortunate for us, because even though we do not yet have sub-arcsecond maps of HDF 850.1 in any lines of CO, we can nevertheless estimate the molecular gas mass in the North and South galaxies directly from their C+ luminosities. For this, we adopted a ULIRG conversion factor of 0.8 M⊙ (K km s-1 pc2)-1 (Downes & Solomon 1998). That factor was based on kinematic models for ULIRGs, that used escape-probability radiative transfer models for each 3D pixel of a turbulent, circumnuclear region, in the gravitational potential of a nuclear stellar bulge. The calibration was fourfold: 1) matching the calculated maps of CO intensities to well-resolved observed maps of CO intensities, 2) making the velocity dispersions due to turbulence and due to ordered motion match the observations in the correct proportions, 3) ensuring that the integrated gas mass was less than the dynamical mass, and 4) checking that the dust mass, estimated from the gas mass with a standard gas-to-dust ratio, was equal to the dust mass estimated directly from observations of the dust continuum. No assumptions were made about individual clouds’ self-gravity or cloud counting. A similar conversion factor has been derived by Mashian et al. (2013), from LVG fits to the HDF 850.1 CO and C+ lines observed by Walter et al. (2012).
After applying this conversion factor to HDF 850.1, the resulting gas masses, corrected for lens magnification (Table 2), are 1.5 and M⊙ for the North and South galaxies respectively. Our mass of M⊙ in total, as determined from the C+ luminosity, is therefore in excellent agreement with the global gas mass estimate (uncorrected for lensing) of M⊙ derived by Walter et al. (2012) by extrapolating to CO(1–0) from measured higher- CO lines. The fact that these two estimates agree so well indicates that there is not a large contribution to the C+ line from “CO-dark” molecular gas.
9 Why there is no optical or UV counterpart to HDF 850.1
As in many other high- ULIRGs and SMGs powered by starbursts, we see directly from the CO, C+, and submillimeter dust luminosities that HDF 850.1 contains large quantities of carbon, oxygen, and dust, presumably ejected by the supernovae in starbursts. The large mass (typically M⊙) of dust may explain why there is no optical counterpart of HDF 850.1 in the Hubble Deep Field optical images.
Furthermore, the relatively high brightness temperature of the dust continuum from HDF 850.1 shows that this large quantity of dust is nearly opaque at a rest wavelength of 158 m (see section 4). So if the dust is already opaque in the far-IR, it will certainly give a complete blackout of any Lyman that is emitted inside the dusty merger companion galaxies.
Although the submm-emitting dust has such a high optical depth that it will completely block the optical and UV, some Ly emission may not be covered by this dust, and will be able to escape, or, alternatively, some Ly may come from another object outside the submm dust source. An example of this proximity effect, at , is the SMG BR120207-NW. No Ly (or rest-frame near-IR, or visible light) is detected from this dusty SMG, but Ly is definitely detected quite nearby (within ), from non-SMG companions in the merging group (see, e.g., Salomé et al. 2012, Carilli et al. 2013, Carniani et al. 2013).
We can also extrapolate from the Chapman et al. (2005) detections of Ly emission in SMGs. In their SMG sample, the Calzetti-extinction-corrected UV luminosities underestimate the true bolometric luminosities (from the FIR) by a median factor of 120, which implies that less than one per cent of the UV can escape. Chapman et al. (2005) also give the median redshift of the SMGs with detected Ly emission lines as . The Ly flux densities in their Fig.2 spectra are typically 2 to 20 Jy. Because flux density decreases as , if these SMGs with median = 2.3 already existed at with exactly the same luminosities and emitting areas as at = 2.3, then their flux densities would be lower by a factor of . This would make many of them marginally detectable at , at the noise level in the Ly spectra of Chapman et al. (2005). If in addition, these SMGs were to follow the same size decrease as non-SMG galaxies, with a (1+) scaling (e.g., Oesch et al. 2010; Jiang et al. 2013), then their Ly flux densities might be scaled down by as much as , which would make most of the Chapman et al. = 2.3 sample undetectable at . As yet however, there is no evidence that SMGs follow the same trend of decreasing size at higher redshift as for non-SMG galaxies.
These three effects, the blockage by the heavy dust by a median factor of 120 as observed by Chapman et al. (2005), the additional downward scaling in flux density by the usual factor of due to the expansion of the universe, and a possible further downward scaling by , due to smaller intrinsic sizes at higher , could all contribute to making an optical or UV counterpart to HDF 850.1 difficult to detect.
10 Conclusion: HDF 850.1 is similar to other high- ULIRG and SMG mergers
To conclude, we summarize how the data in this paper provide evidence that HDF 850.1 is a merger of two galaxies:
1) In the integrated line emission (Fig. 3, left), the source has an irregular V-like shape, resembling those of interacting systems at both low and high redshift, rather than a single, undisturbed disk galaxy.
2) The red- and blue-shifted emission (Fig. 1) is concentrated in two distinct spatial locations, suggesting two merging galaxies. rather than parts of a large rotating disk. Instead, the two objects in the C+ maps, resemble the kpc-sized hotspots observed in the rest-frame optical in = 2 SMGs by Menéndez-Delmestre et al. (2013), which those authors also interpret as merger remnants, due to the lack of any spectroscopic kinematic signatures of rotating disks.
3) The line profiles of the red- and blue-shifted components (Fig. 2, upper and middle) are roughly Gaussian, with large linewidths (300 and 410 km s-1), characteristic of individual galaxies, rather than the linewidths expected from a large, quiescent disk galaxy.
4) The total velocity spread of 940 km s-1 in HDF 850.1 is typical of ULIRG mergers, like Arp 220, IRAS 17208-0014, Mrk273, NGC6240, and others. It is difficult to explain such a large velocity spread with a rotating disk, at any redshift.
5) HDF 850.1 has a high IR luminosity of L⊙ (Table 2, and Walter et al. 2012). This is comparable with the IR luminosities of those low- ultraluminous galaxies (ULIRG) that are known to be mergers. It is also comparable with high- submillimeter galaxies, for which most of the bright SMGs with L⊙ are also known to be major mergers (e.g., Engel et al. 2010). Further evidence that many of the high- IR luminous galaxies are mergers rather than disks is the recent study by Hung et al. (2013) of 2084 Herschel far-IR-selected galaxies at in the COSMOS field. Their study shows that the fraction of disk galaxies decreases with increasing , and that in the highest IR luminosity bins ( L⊙), more than half of the objects have interacting/merger morphologies, rather than disk galaxy morphologies.
6) It is not only the high FIR luminosities that argue for a merger, but also the high CO line luminosities of K km s-1 pc2 (Walter et al. 2012), that are characteristic of ULIRG merger galaxies, and are at least an order of magnitude greater than those of disk galaxies in the local universe. The fact that, in brightness temperature units, (C+) (CO(1–0)), shows that HDF 850.1 is definitely in the starburst class, rather than in the non-starburst class of galaxies that have much lower C+-to-CO ratios (Stacey et al. 1991; 2010). We interpret the ULIRG-level HDF 850.1 starburst as being induced by the merger.
7) The absence of an optical counterpart suggests high dust obscuration, typical of the gas-rich mergers like Arp 220 and other ULIRG mergers. (see discussion in the previous section). The optical depth of the dust radiation is close to unity at rest-frame 158 m. This is highly unusual. It is not observed for any known disk galaxies, but it is observed in the highly concentrated dust in merging galaxies, such as Arp 220 (e.g., Fischer et al. 1997; Downes & Eckart 2007).
8) HDF 850.1 is the only known SMG in the galaxy overdensity at = 5.2 (Walter et al. 2012), suggesting a rare, transient event within this galaxy group, namely a very large starburst, characteristic of gas-rich mergers.
9) The linear sizes of the two objects in HDF 850.1 (Table 2) are about the same as the 1 to 2 kpc sizes that are measured for individual galaxies themselves at = 5 (e.g., Oesch et al. 2010; Jiang et al. 2013). This also suggests that rather than parts of a large disk, they are pieces in the merger assembly of what will be a single, larger galaxy at later times.
10) The classic argument against the existence of large disks at = 5 is the angular momentum argument (see, e.g., Rees 1995). Analytical and numerical estimates indicate that when protogalaxies decouple from the expansion of the universe, tidal torquing between them would impart % of the rotation needed for centrifugal support. Hence for a large (10 kpc ) rotationally-supported disk to form, the infalling disk material must have acquired its angular momentum at distances pc. The infall timescale from such distances however, is comparable with the age of the universe at = 5.2. This means that large, settled-down, 10 kpc-scale galaxy disks cannot be in place much before = 2. Our size measurements of the HDF 850.1 North and South objects are consistent with these ideas, as are the recent measurements of kpc-sized rotating molecular disks in BR1202-07-NW and SE at = 4.7 (Salomé et al. 2012, Carilli et al. 2013, Carniani et al. 2013). The infalling gas does have time to establish rotational support in kpc-scale disks by = 5, but not in the order-of-magnitude larger disks that may be in place by = 2. By this angular momentum argument, it is rather unlikely that the entire structure, consisting of the HDF 850.1 North and South objects together, is one large, rotating disk at = 5.2.
Acknowledgements.
We thank the Plateau de Bure Interferometer operators for their help with the observing, and the referee for helpful comments and suggestions for improving the text. IRAM is supported by INSU/CNRS (France), MPG (Germany) and IGN (Spain).References
- (1) Appleton, P.N., Guillard, P., Boulanger, F., et al. 2013, ApJ, 777, 66
- (2) Barger, A., Cowie, L.L., & Wang, W.-H. 2008, ApJ. 689, 687
- (3) Buchalter, A., Helfland, D.J., Becker, R.H., & White, R.L, 1998, ApJ, 454, 503
- (4) Carilli, C.L., Riechers, D., Walter, F., et al. 2013, ApJ, 763, 120
- (5) Carilli, C.L., & Walter, F. 2013, ARAA, 51, 105.
- (6) Carniani, S., Marconi, A., Biggs, A., et al. 2013, A&A, 559A, 29
- (7) Chapman, S.C., Blain, A.W., Smail, I., & Ivison, R.J. 2005, ApJ, 622, 772
- (8) Cox, P., Krips, M., Neri, R., et al. 2011, ApJ, 740, 63
- (9) Crawford, M.K., Genzel, R., Townes, C.H., & Watson, D.M. 1985, ApJ, 291, 755
- (10) Downes, D., Solomon, P.M., & Radford, S.J.E. 1993, ApJ, 414, L13
- (11) Downes, D., & Solomon, P.M. 1998, ApJ, 507, 615
- (12) Downes, D., Neri, R., Greve, A., et al. 1999, A&A 347, 809
- (13) Downes, D., & Eckart, A. 2007, A&A, 468, L57
- (14) Dunlop, J.S., McLure, R.J., Yamada, T., et al. 2004, MNRAS, 350, 769
- (15) Engel, H., Tacconi, L.J., Davies, R.I., et al. 2010, ApJ, 724, 233
- (16) Fischer, J., Satyapal, S., Luhman, M.L., et al. 1997, ESA SP-419, ed. A. Heras et al. ESA, Noordwijk, 149
- (17) Gallerani, S., Neri, R., Maiolino, R., et al. 2012, 543, A114
- (18) Graciá-Carpio,J., Sturm, E., Hailey-Dunsheath, S., et al. 2011, ApJ, 728, L7
- (19) Hung, C.-L., Sanders, D.B., Casey, C.M., et al. 2013, ApJ, 778, 129
- (20) Jiang, L., Egami, E., Fan, X., et al. 2013, ApJ, 773, 153
- (21) Maiolino, R., Cox, P., Caselli, P., et al. 2005, 440, L51
- (22) Maiolino, R., Caselli, P., Nagao, T., et al. 2009, A&A, 500, L1
- (23) Maiolino, R., Gallerani, S., Neri, R., et al. 2012, MNRAS, 425, L66
- (24) Mashian, N., Sternberg, A., & Loeb, A. 2013, MNRAS, 435, 2407
- (25) Menéndez-Delmestre, K., Blain, A.W., Swinbank, M., et al. 2013, ApJ, 767, 151
- (26) Oesch, P.A., Bouwens, R.J., Carollo, C.M., et al. 2010, ApJ, 709, L21
- (27) Pawsey, J.L, & Bracewell, R.N. 1955, Radio Astronomy, Clarendon Press, Oxford, p.15
- (28) Pineda, J.L, Langer, W.D., Velusamy, T., & Goldsmith, P.F. 2013, A&A, 554, A103
- (29) Rawle, T.D., Egami, E., Bussmann, R.S., et al. 2013, arXiv:1310.4090
- (30) Rees, M. 1995, Perspectives in Astrophysical Cosmology, Cambridge University Press, Cambridge, U.K., pp. 69–71
- (31) Riechers, D.A., Bradford, C.M., Clements, D.L., et al. 2013, Nature, 496, 329
- (32) Salomé, P., Guélin, M., Downes, D., et al. 2012, A&A, 545, A57
- (33) Stacey, G.J., Geis, N., Genzel, R., et al. 1991a, ApJ, 373, 423
- (34) Stacey, G.J., Townes, C.H., Poglitsch, A., et al. 1991b, ApJ, 382, L37
- (35) Stacey, G.J., Hailey-Dunsheath, S., Ferkinhoff, C., et al. 2010, ApJ, 724, 957
- (36) Swinbank, A.M., Karim, A., Smail, I., et al. 2012, MNRAS, 427, 1066
- (37) Van der Tak, F.F.S., Black, J.H., Schöier, F.L., Jansen, D.J., van Dishoeck, E.F. 2007, A&A 468, 627
- (38) Venemans, B.P., McMahon, R.G., Walter, F., et al. 2012, ApJ, 751, L25
- (39) Wagg, J., Wiklind, T., Carilli, C.L., et al. 2012, ApJ, 752, L30
- (40) Walter, F., Riechers, D., Cox., P., et al. 2009, Nature, 457, 699
- (41) Walter, F., Decarli, R., Carilli, C.L., et al. 2012, Nature, 486, 233
- (42) Wang, R., Wagg, J., Carilli, C.L., et al. 2013, ApJ, 773, 44
- (43) Williams, R.E., et al. 1996, AJ, 112, 1335
- (44) Willott, C.J., Omont, A., & Bergeron, J. 2013, ApJ, 770, 13
- (45) Wolfire, M.G.L., Hollenbach, D., & Tielens, A.G.M. 1989, ApJ, 344, 770