Reflection and implantation of low energy helium with tungsten surfaces
Abstract
Reflection and implantation of low energy helium (He) ions by tungsten (W) substrate are studied using molecular dynamics (MD) simulations. Motivated by the ITER divertor design, our study considers a range of W substrate temperatures (300 K, 1000 K, 1500 K), a range of He atom incidence energies (100 eV) and a range of angles of incidence (-) with respect to substrate normal. The MD simulations quantify the reflection and implantation function, the integrated moments such as the particle/energy reflection coefficients and average implantation depths. Distributions of implantation depths, reflected energy, polar and azimuthal angles of reflection are obtained, as functions of simulation parameters, such as W substrate temperature, polar angle of incidence, the energy of incident He, and the type of W substrate surface. Comparison between the MD simulation results, the results obtained using SRIM simulation package, and the existing experimental and theoretical results is provided.
I Introduction
Plasma surface interaction (PSI) at the first wall and divertor of a fusion reactor not only poses a materials challenge in terms of radiation damage due to the extreme plasma and neutron irradiation flux, but also introduces a controlling factor on the boundary plasma conditions through recycling and impurity production. The latter effect has a direct impact on fusion power output since edge plasma is known to affect the performance of fusion-producing core plasmas. Presently both solid wall and liquid wall designs are being actively studied. The design of ITER chooses a combination of beryllium (Be) first wall and tungsten (W) divertor. A number of current tokamak upgrades and proposed future machines have been exploring a configuration of all-tungsten first wall and divertors. The primary benefits are the high melting temperature, the low sputtering yield, and the excellent thermal conductivity of refractory metals in general and tungsten in particular Philipps .
The plasma ion irradiation flux to the tungsten surface in a fusion reactor is made of deuteron (D) and triton (T), which are unburned fusion fuel, and helium (He), which is the fusion product. Unlike D and T, helium is chemically inert, but can bring severe damage to the tungsten surface by clustering in the form of subsurface bubbles, which can burst and induce complicated surface morphology known as fuzz. Also unlike D and T, helium can not aggregate on the tungsten surface as a deposited He layer. The incoming helium is either implanted below the W surface or reflected upon impact. The implanted He can migrate to the tungsten surface on a diffusive time scale. The desorption of He from a tungsten surface is energetically favorable so a mostly clean tungsten surface is maintained in a He plasma. In a working fusion reactor, the recycling of He will be complicated by the presence of triton and deuteron at the tungsten surface. Here we will focus on the pure He plasma situation. This simplification is helpful in establishing a better understanding of the fundamental process of He ion interaction with a tungsten surface. It is also practically important because, due to heating power constraint for accessing high (H) confinement mode, there is a proposed pure He plasma phase in the ITER program start-up.
Our emphasis here is on low energy helium ions, in the range of 1-100 electron volts (eV) at the time of impact with the tungsten surface. This is to be consistent with the design goal/choice that takes advantage of the negligibly small sputtering yield of light ions on tungsten surface at low energy. For an impacting He ion with energy incident polar angle and azimuthal angle the probability of it being reflected by the tungsten surface with an outgoing energy into a differential solid angle about and is Evidently is also a function of the tungsten surface type and its temperature The total probability of the He ion being reflected upon impact is
| (1) |
and the average energy of the reflected He is given by
| (2) |
The so-called energy reflection coefficient for mono-energetic He ion striking the tungsten at a particular orientation is given by
| (3) |
The reflection function provides the energy and angular distribution of the reflected He atoms for any given impacting He ion distribution
| (4) |
provides the wall feedback flux to the boundary plasma, which is described by a set of combined plasma/neutral evolution equations. In other words, sets the boundary condition for a boundary plasma model that can inform us on the energy and angular distribution of the impacting He ions. The importance of this recycling process is that it provides a crucial link in the feedback loop of PSI that governs the boundary plasma condition in a fusion reactor.
Particle conservation implies that is the probability of the impacting ion being implanted into the tungsten. For the implanted He ions, the final resting position gives the so-called range distribution function with the distance from the surface, the polar angle and the azimuthal angle, all relative to the point of initial impact at the tungsten surface. By definition,
| (5) |
The average projected range or implantation depth normal to the surface for an impacting He ion of is
| (6) |
where
| (7) |
the projected range. For an impacting He distribution of the total range distribution is
| (8) |
The range distribution or equivalently, provides the source information of implanted He atoms for understanding their eventual effect on the bulk and surface properties of the tungsten divertor and first wall. This is the materials side of plasma-surface interaction, in contrast to which provides the influence of plasma-surface interaction on the plasmas. Specifically for tungsten, implantation of He can cause He-bubble formation, blistering and formation of W nanostructure (“fuzz”) on the surface Tokitani ; Yoshida ; Kajita . This can lead to rapid erosion and significant degradation of the mechanical properties and heat load resistance of the material. Interaction of He with W surfaces has been investigated experimentally and theoretically for the last four decades vanGorkum ; Amano ; Robinson ; Tabata ; Eckstein ; Thomas . There were also a number of simulation studies. In particular, Henriksson et al. (see Refs. Henriksson1, ; Henriksson2, ) studied He bubble formation and initial stages of blistering in He implanted W. Li et al. (see Ref. Li, ) studied temperature effects on low energy He bombardment of the W surface. However, only the W(100) surface was considered and only bombardment with incident direction normal to the surface was studied.
The primary objective of this paper is to quantify and for low energy He ion bombardment of W surfaces. This information is required for further studies of wall recycling on boundary plasmas () and plasma irradiation on materials properties (). Molecular dynamics is arguably the method of choice to provide via direct numerical simulations. This will become obvious as one encounters the detailed multiple multi-body collision processes as opposed to single binary collision in He reflection by W surfaces. For the low energy He ion considered here, MD is also an excellent tool for quantifying the range distribution for the He implantation since the contribution from electronic stopping is small. We have performed MD simulations of low energy He bombardment of three W surfaces, using three W substrate temperatures, a range of He incident energies and a range of angles of incidence with respect to substrate normal. We have also compared the results of MD simulations with the results obtained using the SRIM simulation package SRIM , as well as with the existing experimental and theoretical results. For the purpose of completeness in documenting simulation data of and as boundary and initial conditions for boundary plasma modeling and studies of He transport in tungsten, we provide an unusually large amount of tables and plots.
The rest of the paper is organized as follows. The set up and the procedures of our MD simulations are described in Sec. II. The simulation results are given in Sec. III. Specifically, a summary of the integrated quantities for reflection and implantation, namely the particle and energy reflection coefficients, and the average range of implantation, are shown in Sec. III.1 as a function of substrate temperature, surface type, incidence energy and angle. The range distribution is taken up in Sec. III.2. The energy and angular distributions of the reflected He are examined in Sec. III.3 and Sec. III.4, respectively. For comparison, we also perform SRIM calculation in Sec. III.5, and MD simulations, using a second EAM potential, in Sec. III.6. Our results are contrasted with existing ones in Sec. IV, before concluding remarks in Sec. V.
II Molecular dynamics simulation procedure
Molecular dynamics is used in our atomistic studies of He reflection and implantation with a tungsten surface. To describe the interatomic interaction between W atoms we used the Ackland-Thetford embedded atom method (EAM) potential for W Ackland , modified by Juslin et al Juslin . To describe the interaction between He and W atoms we used the W-He pairwise potential recently developed by Juslin et al Juslin . We considered three bcc W surfaces ((100), (110), (310)), three simulation temperatures (300 K, 1000 K, 1500 K), a range of He deposition energies (0.5 eV - 100 eV), and a range of deposition angles with respect to substrate normal (-). For better statistics, we simulated 1000 He impacts for each set of simulation parameters. In those cases where the initial deposition angle with respect to substrate normal was not , the azimuthal angle for each deposition was drawn randomly (ranging from to ). This corresponds to a distribution of impacting He ions that is independent of i.e.,
In the case of a W(100) surface, the size of the simulation system varied from 6750 atoms ( 47.5 Å 47.5 Å 47.5Å) to 54000 atoms ( 95 Å 95 Å 95Å), depending on the initial energy of the He ion. In cases where the channeling effect Nastasi was especially pronounced, we used a simulation system elongated in the z direction (up to 220 Å). For (110) and (310) surfaces we used similar system sizes. Periodic boundary conditions were applied in the x and y directions. In the z direction there are free-standing top and bottom surfaces. With relatively large system sizes we did not need to use a thermostat for temperature control during the MD simulations of He impact with W surfaces, because the changes in temperature of the substrate under the influence of He impact were comparable to regular temperature fluctuations.
Prior to MD simulations of He impact with the W surface we equilibrated the substrate at the desired temperature by applying a Langevin thermostat to all atoms. Non-accumulative He-impact MD simulations were carried out for each set of deposition parameters (such as initial He impact energy and deposition angle ). In the beginning of each simulation a He atom was placed above the substrate (the initial distance to the substrate was greater than the W-He potential cutoff distance and x and y positions were chosen randomly each time) and assigned a velocity with direction and magnitude corresponding to the initial deposition angle and initial deposition energy. For each given deposition energy and temperature, for all 1000 trajectories we used the same initially prepared substrate block to save computational time. In a test on the 40 eV, K, normal-deposition case on the (100) surface, we verified using 5000 trajectories that this procedure gave the same results as a procedure in which the substrate block was integrated forward in time by 0.5 ps before each deposition was initiated. A time step of 0.1 fs was used in all simulations. In those cases where the He atom was reflected, we interrupted the MD simulation immediately and collected the data (reflected energy and angles of reflection). In cases of implantation of He atom into the W substrate, the total MD simulation time was 3 ps. By the end of 3 ps MD simulation the kinetic energy of a He atom is observed to always fall below the magnitude of He migration energy in bcc W ( eV) Juslin .
III Simulation Results
III.1 Summary of results for W(100), W(110), W(310) surfaces
A summary of the MD simulation results can be conveniently given in terms of the integrated quantities of particle reflection coefficient energy reflection coefficient and average projected range for the implanted He atoms.
In Table 1 we present the summary results on particle and energy reflection coefficients for low energy He bombardment of the W(100) surface, for a substrate temperature of K. A range of initial energies of He atoms is considered. As can be seen from Table 1, there is a strong dependence of reflection coefficient energy reflection coefficient and implantation depth on the initial incident energy of He atoms. We recall that a reflection coefficient is the ratio of reflected He atoms to the total number of impacting He atoms, Eq. (1). The energy reflection coefficient is defined as the ratio of the kinetic energy of the reflected He atom to the incident kinetic energy of the He atom, Eq. (3). Due to the high atomic number of tungsten, the reflection coefficients in both particle number and energy are much higher than those of a carbon or beryllium wall. Conventionally these reflection coefficients are anticipated to increase as the incident angle becomes larger, following a functional dependence of with the index negative. In our MD simulations, one can see from Table 1 that the fraction of reflected He atoms do tend to increase (for all incident energies), as the deposition angle with respect to substrate normal () becomes large, degrees. For the largest deposition angle we have considered () all He atoms are reflected (100 %), so the reflection coefficient is equal to 1 for all incident energies in this case. In cases of small deposition angle, the reflection coefficient is equal to 1 only for the lowest incident energies (up to 10 eV). The energy reflection coefficient has a similar behavior with respect to incident angle, and lower deposition energies produce higher energy reflection coefficients. What is different from the previous results Tabata2 is the non-monotonic dependence of particle/energy reflection coefficients with the incidence angle, showing a minimum at This is likely a geometrical effect of the tungsten lattice. It is known that at low energy, the interaction between an impacting ion and lattice atoms is dominated by multiple collisional events, so the lattice structure of the top few layers from the line of sight of the impacting ion can play an important role in particle reflection. This is consistent with the well-known channeling effect of the lattice. Around the angle of with respect to the W(100) surface normal, such a geometrical channeling effect appears to reach a maximum and results in a shallow minimum for the reflection coefficient. As the incident angle becomes even larger, the higher effective lattice atom density along the line of sight will become the dominant effect and produce much larger reflection coefficients in both particle number and energy. We note that this discussion uses a W(100) surface as an example. For other surfaces the local minima in particle/energy reflection coefficients may correspond to different deposition angles.
The substrate temperature (see Tables 2, 3) does not affect the results significantly, except for the implantation depth of He atoms at lower (300 K) temperature. For substrate T=300 K the average implantation depth increases substantially in the case of normal deposition of He atoms due to the increased probability of channeling events Nastasi .
The results we obtained for the W(110) and W(310) surfaces are summarized in Tables 4 and 5. They are similar to the results obtained for the W(100) surface (see Table 1) with a few exceptions. For instance, the reflection coefficient for deposition angles for the W(110) surface is slightly lower/higher compared to the corresponding results for the W(100) and W(310) surfaces. This can be explained by taking into account the differences in crystallographic orientation of substrates corresponding to different surfaces with respect to the deposition directions defined by the deposition angles.
We have also carried out additional MD simulations of He reflection and implantation with the W(100) surface under cumulative bombardment by the He atoms, which would be the case in a real fusion reactor. Although the results we obtained are preliminary and further work is required, it is of interest to note that the values we obtained for the particle/energy reflection coefficients and the average implantation depth are very similar to those obtained using the clean W surface without any He implanted. We note again that the results reported in this paper correspond to non-cumulative simulations.
III.2 Implantation depth or range distribution
For a plasma irradiation flux whose variation along the tungsten surface is small over the length scale of the transverse spread of the implanted ions, the implantation quantity of practical utility is the angularly-integrated projected range function
| (9) |
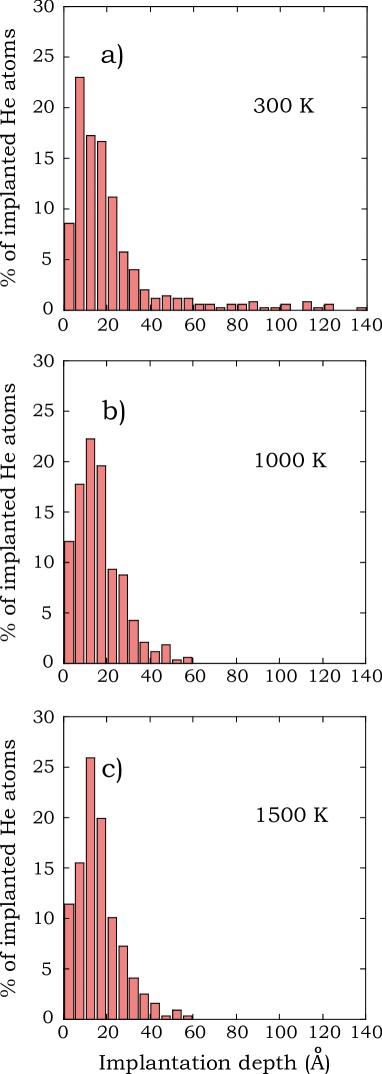
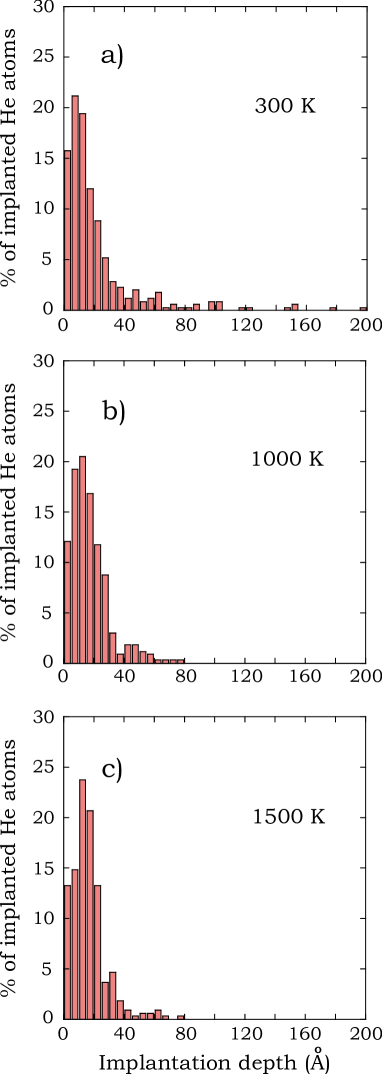
Fig. 1 compares implantation depth distributions of He atoms for different substrate temperatures (300 K, 1000 K and 1500 K). Normal deposition on W(100) substrate is considered. Initial incident energy of He atoms is 80 eV for all substrate temperatures. While the results are very similar for T = 1000 K and T = 1500 K (see Fig. 1b and Fig. 1c), in the case of T = 300 K, the implantation depth distribution has a long tail due to a substantial increase in the number of channeling events Nastasi . The channeling effect generally depends on substrate temperature, substrate orientation with respect to a deposition direction and other factors. We observed it in all cases corresponding to different substrate temperatures, different W surfaces, different He incident energies and angles. In the absence of the channeling effect the implantation depth distributions are usually modeled by a Gaussian distribution Nastasi :
| (10) |
Where is known as the projected range and is the projected range straggling (the average fluctuation, or standard deviation from the mean in the projected range). is a constant set by the implantation dose (or total number of implanted He atoms) Nastasi such that
| (11) |
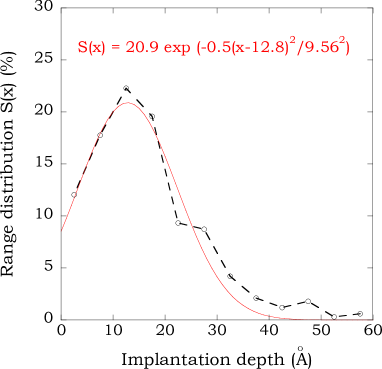
In the case of high energy ion implantation, can be satisfied, so the lower bound of this integral can be set to The constant is the implantation dose itself, i.e., In the case of low energy implantation, as considered here, is comparable to This gives rise to a Gaussian distribution truncated at the small end, as shown in Fig. 2, which provides a fit to the implantation depth distribution of He atoms (1000 K, normal deposition on W(100) surface, incident energy 80 eV). The actual average projected range as defined in Eq. (6), can be significantly different from in the Gaussian model.
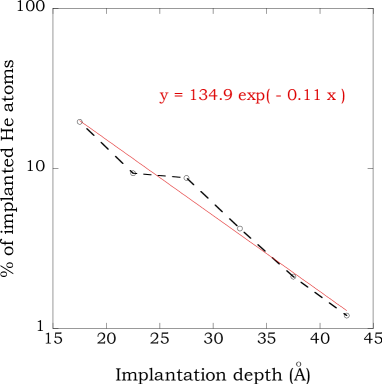
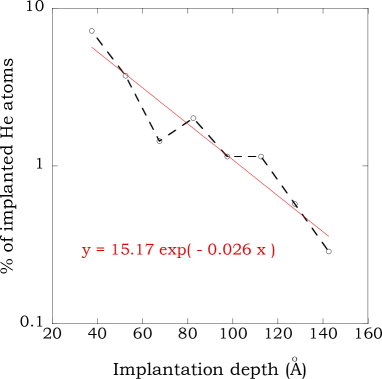
The channeled He atoms that penetrate much beyond have a distribution that falls off exponentially with distance as , where (see Ref. Nastasi, ). Fig. 3 shows the exponential fit to the tail of the same distribution in Fig. 2. In Fig. 4 an exponential fit to the tail of the implantation depth distribution is shown for simulation temperature K (corresponds to the distribution from Fig. 1a). In cases of higher temperatures (1000 K and 1500 K), the maximum implantation depth does not exceed 60 Å and the peaks of the distributions are between 10 Å and 15 Å. On the other hand, in the case of He implantation in W(100) at 300 K, the maximum He implantation depth observed in our MD simulations is close to 140 Å. This can be explained by an increase in number of channeling events at 300 K. At 300 K the peak of the distribution is between 5 Å and 10 Å.
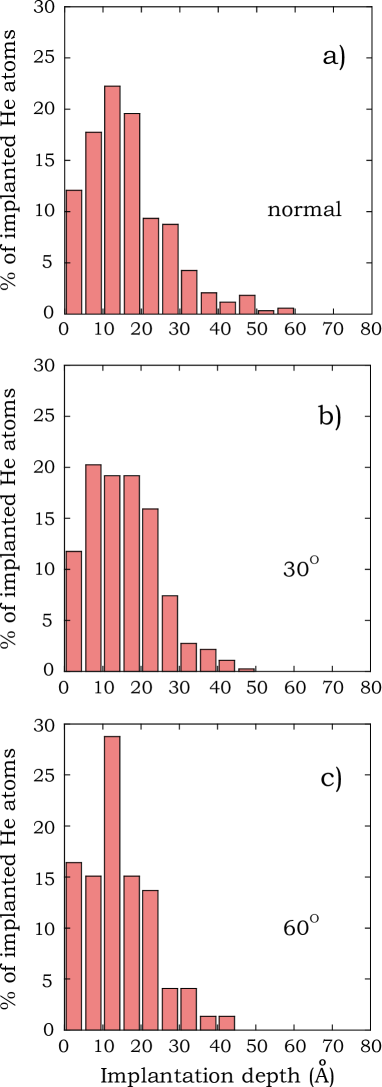
In Fig. 5 the dependence of implantation depth distribution for He atoms on deposition angle is presented. Three incidence angles with respect to substrate normal are considered (). In all cases the temperature of the W(100) substrate is 1000 K and the incident energy of He atoms is 80 eV. Even though 1000 non-cumulative depositions were carried out for each deposition angle, the number of implantation events is not enough to accumulate good statistics for the large incidence angle of (the number of implanted He atoms is only 73, as can be seen from Table 1). We can see from Fig. 5a that in the case of normal deposition, the projected range distribution has a slightly longer tail, compared to Figs. 5b and 5c, which correspond to the deposition angles of and respectively. This is due to the increased number of channeling events expected for the deposition angle of (and ) with respect to substrate normal in the case of the W(100) surface. As a result, the average implantation depth is also slightly increased in the case of normal deposition (see Table 1).
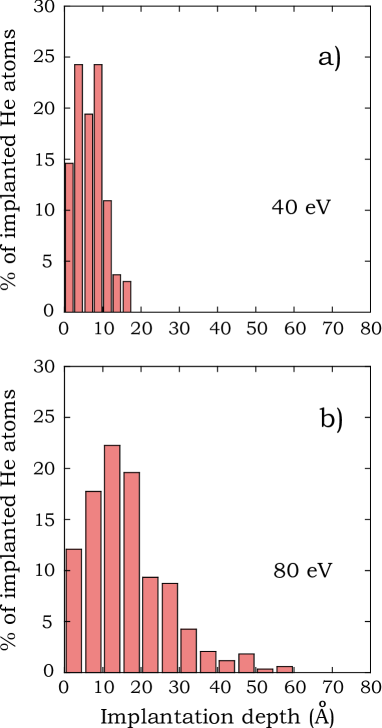
Fig. 6 demonstrates the dependence of implantation depth distribution for He atoms on the incident energy (incident energies of 40 eV and 80 eV are considered). In both cases deposition is normal and the temperature of the W(100) substrate is 1000 K. As can be seen from Fig. 6, initial energy of the He atom has a strong effect on the implantation depth distribution. He atoms with initial kinetic energy of 40 eV do not propagate deeper than 17.5 Å into the W substrate. On the other hand, the increase of incident energy to 80 eV results in a substantial increase in average implantation depth for He atoms (see Table 1). The maximum propagation distance increases up to 60 Å in this case.
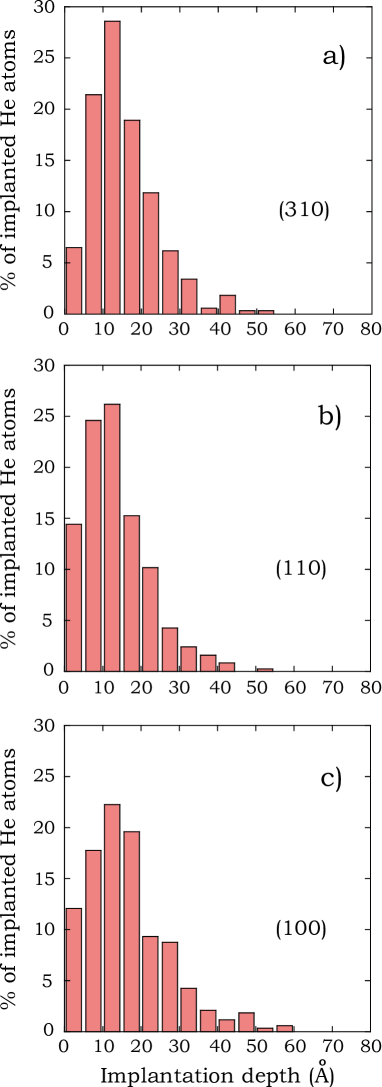
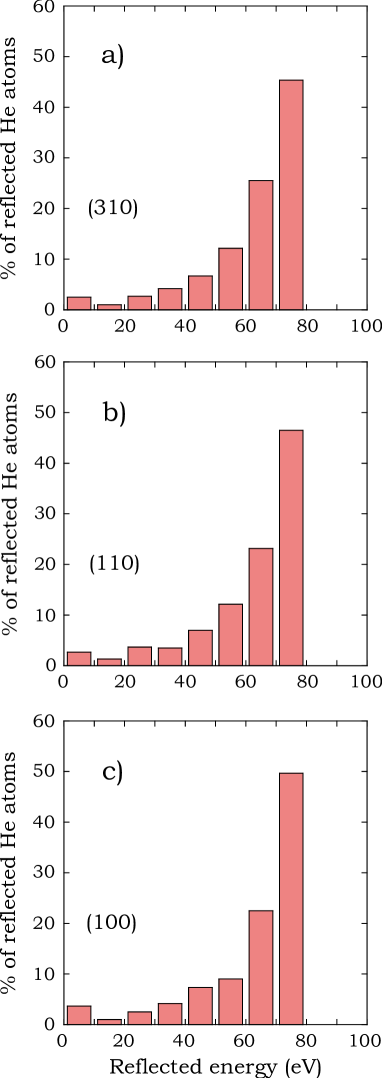
The implantation depth distributions for He atoms for the W(100), W(110) and W(310) surfaces are presented in Fig. 7. In all three cases the temperature of the W substrate is 1000 K and the incident energy of normally deposited He atoms is 80 eV. As can be seen from Fig. 7, the implantation profiles follow a similar behavior, but different lattice orientations do produce quantitative variations. We also note that all three surfaces show the limited implantation depth arising from disruption of channeling at this high, fusion-relevant temperature of T=1000K, consistent with what was seen in Fig. 1.
III.3 Energy distribution of He atoms reflected by W surface
The energy reflection coefficient is of importance to boundary plasmas since it is a measure of how efficiently plasma ion energy is being transferred into the reactor wall/divertor. The reflected ion energy distribution is
| (12) |
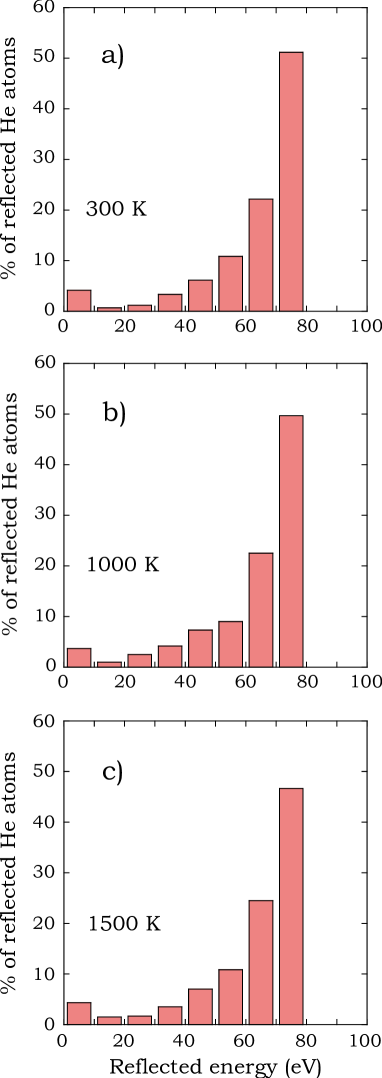
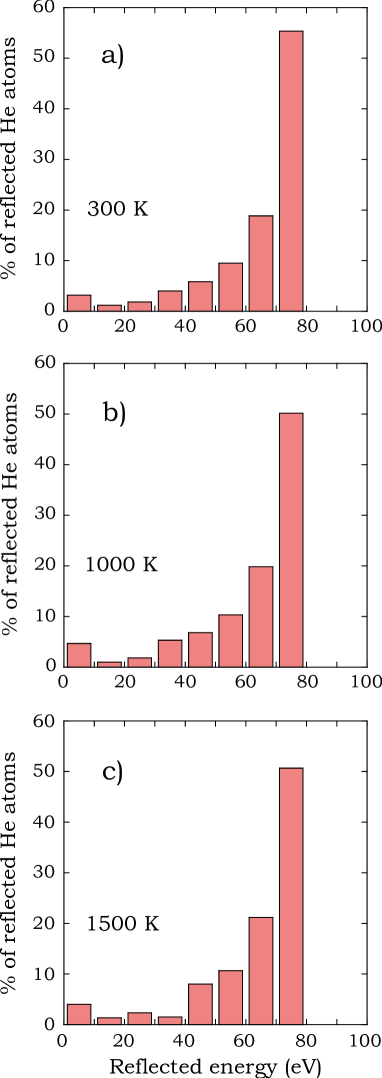
In Fig. 8 we compare energy distributions of reflected He atoms for different substrate temperatures (300 K, 1000 K and 1500 K). In all cases He atoms were deposited normally onto the W(100) substrate. The incident energy of He atoms is 80 eV for all substrate temperatures. As can be seen from Fig. 8, the substrate temperature does not affect the results significantly.
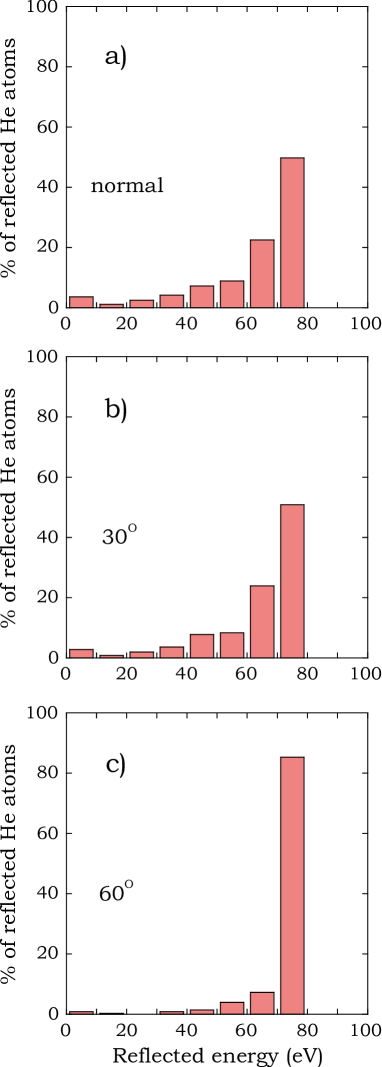
Fig. 9 shows the dependence of reflected He energy distribution on deposition angle. As can be seen from Fig. 9, the dependence is very strong. For lower deposition angles () about 50% of reflected He atoms have kinetic energy close to the initial incident energy. For the deposition angle the percentage of He atoms reflected with kinetic energy 70 eV - 80 eV is close to 90. This can be explained by the fact that at higher deposition angles a probability of substrate penetration by He atoms is reduced significantly. As a result, the fraction of He atoms that have a chance to lose energy in collisions with the atoms of W substrate before they find a way out is decreased substantially compared to the cases of lower deposition angles.
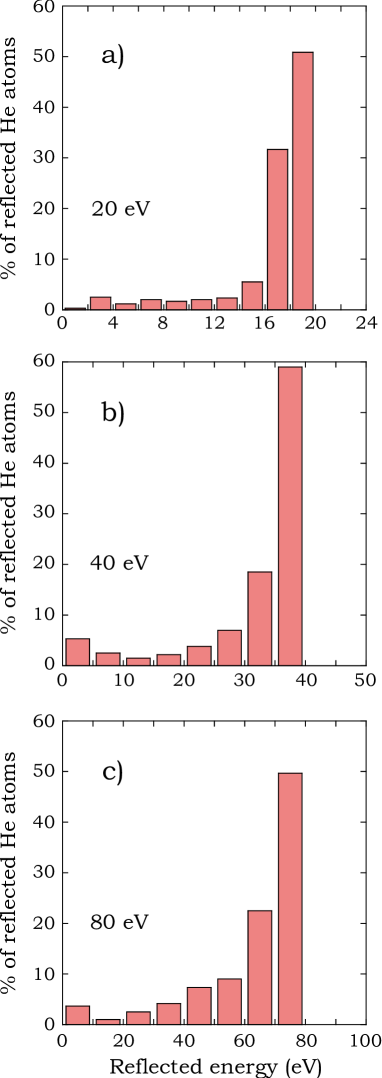
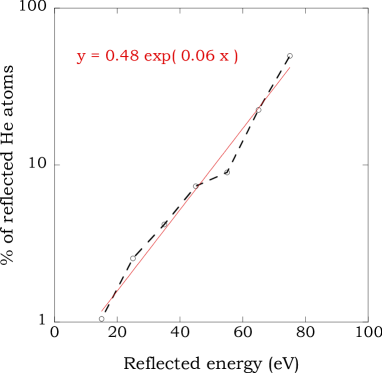
In Fig. 10 the dependence of reflected He energy distribution on incident energy is shown. Incident energies of 20 eV, 40 eV and 80 eV are considered. In all cases the temperature of the W(100) substrate is 1000 K, and He atoms are deposited normally with respect to the substrate surface. As can be seen from Fig. 10, the results are not very different in all three cases. However, the scaling of the results with is not the same. As can be seen from Fig. 11, the reflected energy distributions in the higher He incidence energy case ( eV is shown) closely follow an exponential distribution in (up to ),
| (13) |
In contrast, the reflected energy distribution of the low incidence energy case ( eV is shown) approximately scales as (see Fig. 12),
| (14) |
How this qualitative transition in scaling of occurs as increases remains to be understood from a theoretical perspective.
III.4 Angular distribution of He reflection by W surface
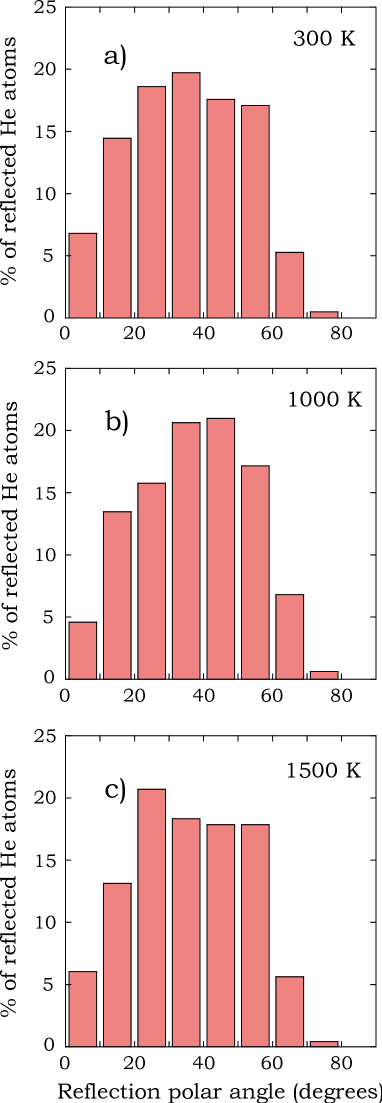
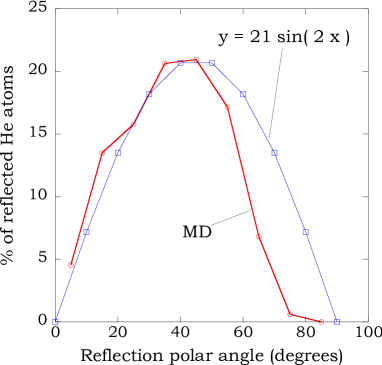
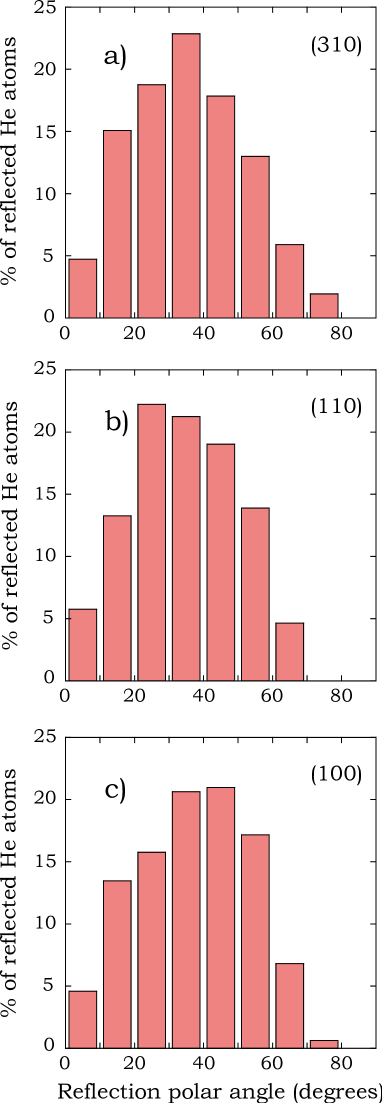
Fig. 14 shows the dependence of the polar angle distribution of reflected He atoms on substrate temperature (300 K, 1000 K and 1500 K). In all three cases the incident energy of He atoms on the W(100) substrate is 80 eV, and deposition is normal to the substrate surface. The same trend is observed in that most of the He atoms have the polar angle of reflection in the interval of with respect to substrate normal. It was indicated in previous studies on this topic that the distribution of polar angles of reflection for normal incidence has a characteristic sine distribution in Eckstein2 . In our data, the polar angle distributions of the reflected He atoms deviate from the sine distribution in such a way that more He atoms are reflected at small polar angles while fewer He atoms are reflected at large polar angles (for example, see Fig. 15).
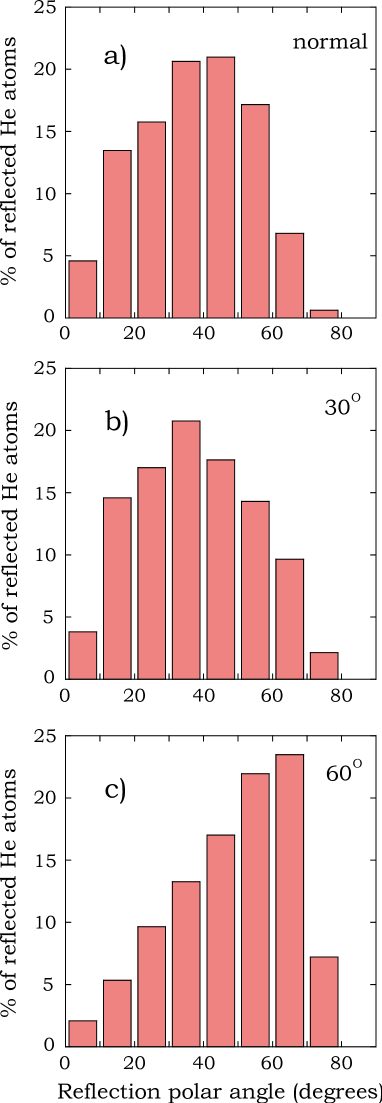
In Fig. 16 the dependence of polar angle distribution of reflected He atoms on deposition (polar) angle is shown. From Fig. 16b and Fig. 16c, showing incident angles of and , one can see that the peak of the distribution is very close to the initial polar angle of deposition (the azimuthal angle is of course opposite). This is especially pronounced for higher angles of incidence. In these cases He atoms do not penetrate the W substrate very often, and, as a result, the polar angle of reflection is very close to the polar angle of incidence. At (Fig. 16a), the distribution peak is not at all aligned with the incoming angle, because in this case the He atoms penetrate deeper (and more often) into the substrate, and spend some time under the surface colliding with the atoms of the substrate, and hence lose their memory of the incoming angle.
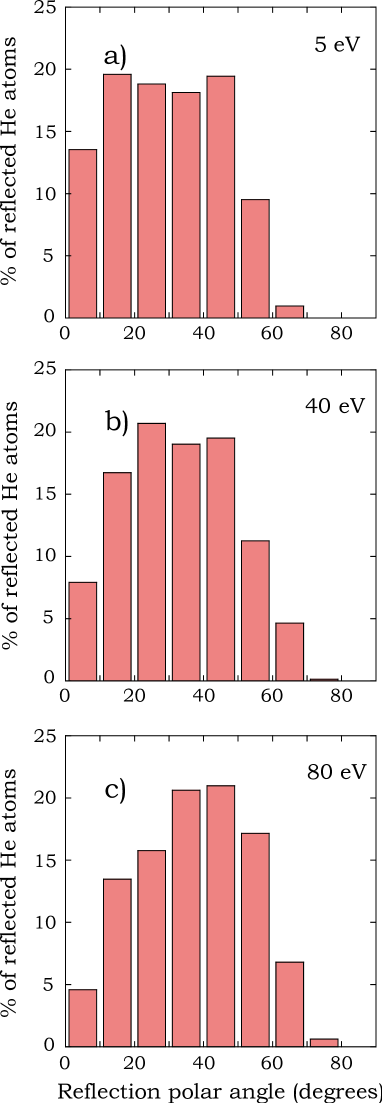
Fig. 17 illustrates the dependence of the polar angle distribution of reflected He atoms on the incident energy (incident energies of 5 eV 40 eV and 80 eV are considered). In all cases He atoms are deposited normally on the W(100) surface, and the temperature of the W substrate is 1000 K. The distribution has a more pronounced peak in the case of higher He incident energy (see Fig. 17c).
We do not observe a strong dependence of polar angle distribution of the reflected He atoms on the type of W surface (see Fig. 18). There are three surfaces considered: W(100), W(110) and W(310). In all cases the temperature of the W substrate is 1000 K and the incident energy of He atoms is 80 eV.
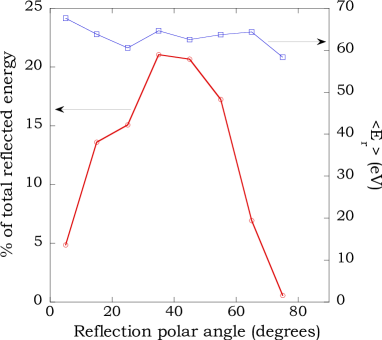
One can also integrate the total reflected He energy over at fixed A representative result for the reflection energy as a function of the reflection polar angle is shown in Fig. 19. Also shown in Fig. 19 is an average kinetic energy reflected at a particular polar angle as a function of reflection polar angle. We can see that it is roughly the same and independent of polar angle of reflection .
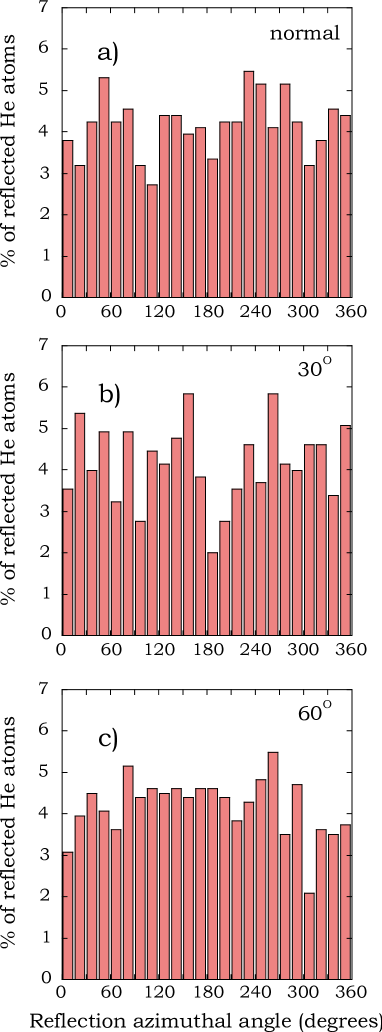
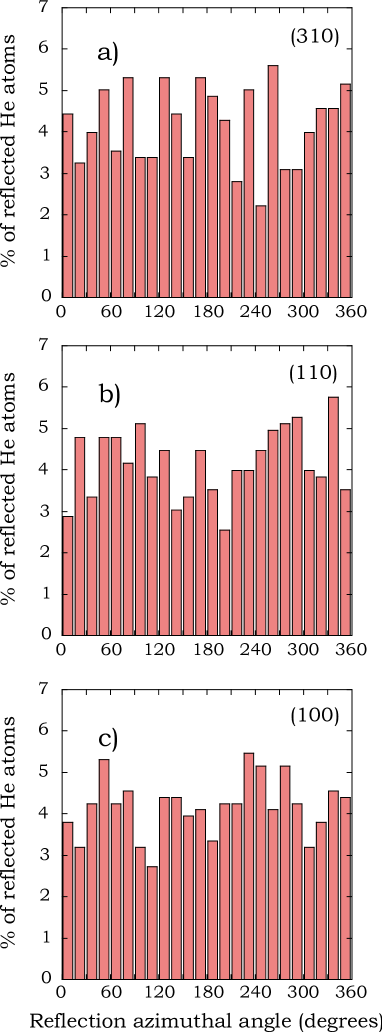
We could not detect any clear trend in the dependence of azimuthal angle distribution of reflected He atoms on MD simulation parameters, such as substrate temperature, deposition (polar) angle of He atoms, incident energy of He atoms, or the type of W surface. It appears that the azimuthal angles of reflection are distributed more or less evenly over . The dependence of azimuthal angle distribution of reflection on deposition (polar) angle is shown in Fig. 20 ( and polar deposition angles are considered). We note that in all simulation cases of non-normal deposition, the azimuthal angles of incidence were chosen randomly. The distributions of azimuthal angles of reflection for He atoms for W(100), W(110) and W(310) surfaces are presented in Fig. 21.
III.5 Results obtained using SRIM simulation package SRIM
In Table 6 the results of SRIM simulation SRIM are presented. Normal incidence of He atoms (incidence energies ranging from 5 eV to 100 eV) on 10000 Å thick W substrate is studied. Comparing the results of Table 6 with the corresponding results (normal incidence) of Table 1 one can clearly see a strong disagreement between the SRIM and MD simulation results. SRIM significantly underestimates the reflection coefficients for the whole range of incidence energies considered in this study. The disagreement is most pronounced for low incident energies. The average kinetic energy of reflected He atoms and the average implantation depth of implanted He atoms, obtained using SRIM, are also underestimated, compared to MD results. The disagreement between SRIM and MD simulation results can be explained by taking into account that SRIM uses a binary collision approximation to describe interactions between an incident He atom and the atoms of the W substrate. In contrast, MD simulation takes into account many-body interactions, which become increasingly important at low incident energies.
III.6 Results obtained using EAM potential for W by Derlet et al. Derlet
We carried out additional MD simulations of interaction of low energy He atoms with the W(100) substrate using a different EAM interatomic potential for W developed by Derlet et al. Derlet and modified by Björkas et al.Bjorkas ; Bjorkas2 , while maintaining the same W-He cross potential developed by Juslin et al Juslin . Comparing the results obtained using this EAM potential for W (see Figs. 22, 23) with the corresponding results obtained using the Ackland-Thetford EAM potential for W, Ackland modified by Juslin et al. Juslin (see Figs. 1, 8), we can see that they are not very different from each other. In particular, the implantation depth distributions obtained for three different substrate temperatures (300 K, 1000 K and 1500 K) using the Derlet potential (see Fig. 22), have longer tails (due to channeling events), compared to the corresponding results obtained using the Ackland-Thetford potential (Fig. 1). This is especially pronounced at low temperature (300 K). At this temperature the maximum He implantation depth observed in our MD simulations (using the Derlet potential) is close to 200 Å.
The reflection energy distributions for He atoms for different substrate temperatures (300 K, 1000 K and 1500 K) obtained using the Derlet potential (see Fig. 23) look very similar to the corresponding distributions obtained using the Ackland-Thetford potential (see Fig. 8). In the former case slightly more He atoms are reflected with the energy close to the incident energy (80 eV).
IV Comparison with existing results
There has been a fairly limited number of experiments on low energy He interaction with W surfaces. Among them are the experiments by van Gorkum et al. (see Ref. vanGorkum, ) and the experiments by Amano et al. (see Ref. Amano, ). The process of interaction of low energy He with W surfaces was simulated using the computer program MARLOWE (Version 11.5) (see Ref. Robinson, ). There are also a number of empirical formulas (see Refs. Tabata, ; Eckstein, ; Thomas, ) which were fitted using experimental and simulation data.
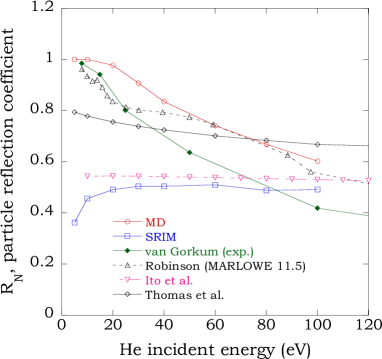
In Fig. 24 we compare our MD simulation results for incident energy dependence of the particle reflection coefficient with some of the existing experimental and theoretical results. Our MD simulation results are seen to be in qualitative agreement with the experimental results by van Gorkum et al. and the simulation results reported by Robinson (MARLOWE 11.5). This is to be contrasted with those obtained using the empirical formulas by Ito et al. and Thomas et al. (Refs. Tabata, ; Eckstein, ; Thomas, ), as well as the results we obtained using the SRIM simulation package (see Ref. SRIM, ), which all have significant disagreement.
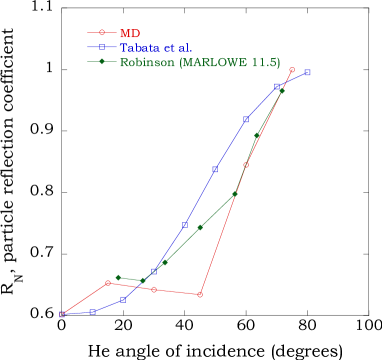
Fig. 25 compares our MD simulation results for the incident angle dependence of the He particle reflection coefficient with some of the existing theoretical results. Our MD simulation results are in qualitative agreement with the results obtained using the empirical formula by Tabata et al. (Ref. Tabata2, ) and the simulation results reported by Robinson (Ref. Robinson, ). We note that the enhanced channeling of the He atoms incident at angles around (in the case of He deposition on the W(100) surface considered here) leads to a significant deviation of our MD simulation results from the those obtained using the empirical formula by Tabata et al. (Ref. Tabata2, ) and the simulation results reported by Robinson (Ref. Robinson, ).
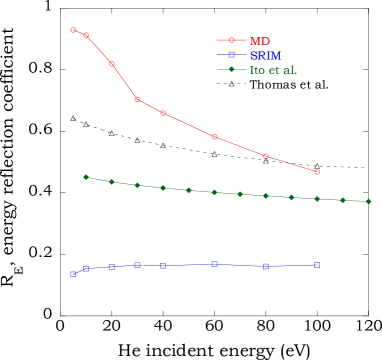
Fig. 26 compares our MD simulation results for the incident energy dependence of the energy reflection coefficient with some of the existing theoretical results. As can be seen from Fig. 26, our MD simulation results disagree with the results obtained using the empirical formulas from Refs. Tabata, , Thomas, (see also Ref. Eckstein, ). Our results are also in disagreement with those obtained using the SRIM simulation package.
It should be noted that the empirical formulas by Ito et al. (see Ref. Tabata, and also Ref. Eckstein, ) and Thomas et al. (see Ref. Thomas, ) were fit to the existing experimental and simulation (SRIM, MARLOWE) results corresponding to a very broad range of He incident energies (up to 1000 KeV). This may help explain in many cases, the disagreement of our MD simulation results with that of the empirical formulas.
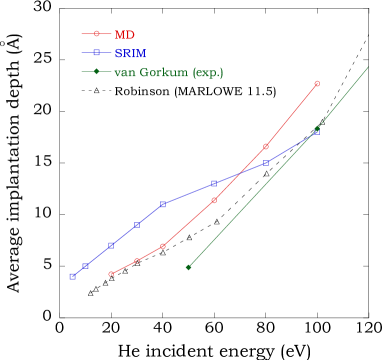
In Fig. 27 our MD simulation results for mean He implantation depth are compared with some of the existing experimental and theoretical results. The results from our simulations using the SRIM simulation package are also shown. The MD simulation results are in qualitative agreement with the experimental and theoretical results shown in Fig. 27 (Refs. vanGorkum, ; Robinson, ). We note that He stopping power in W is underestimated using classical MD simulations (only the nuclear stopping is captured, but not the electronic one). While the nuclear stopping dominates at lowest incident energies of He atoms, at higher He incident energies contribution from the electronic stopping becomes appreciable Haussalo .
Surprisingly, some of our results disagree strongly with the MD simulations results reported by Li et al. (see Ref. Li, ), who used Derlet’s potential for W (Ref. Derlet, ) in their studies. In addition, Li et al. developed and used in their studies a W-He pairwise potential Wang different from the W-He pairwise potential recently developed by Juslin et al. Juslin (which we used in our MD simulations). The reflection energy distributions we obtained are very different than the results reported by Li et al. In particular, we do not observe a significant dependence of reflection energy distribution for reflected He atoms on the temperature of the W(100) substrate (see Fig. 8). In contrast, Li et al. reported a very strong temperature dependence (see Fig. 5 of Ref. Li, ). The implantation depth distributions we obtained for different W(100) substrate temperatures are also different, compared to the corresponding results reported by Li et al. In particular, the distributions we report have much longer tails (see Fig. 1), compared to the results shown in Fig. 6 of Ref. Li, . It is unclear, other than the difference in interatomic potentials, what might have contributed to these drastically different predictions.
V Conclusions
Recycling of low energy helium ions on tungsten surface occurs primarily through reflection in a pure He plasma. This remains the case at elevated temperature (1000 - 1500 K) for the tungsten substrate, as to be expected in a fusion reactor like ITER, which is expected to have a pure He plasma operational phase. In contrast to the SRIM prediction but more consistent with limited experimental data, MD simulations reveal much larger particle and energy reflection coefficients at low incidence ion energy (1-100 eV), which is the range for ITER boundary plasmas by design. This suggests that substantial He ion energy will be fed back to the plasma instead of being absorbed by the tungsten wall. The effect of that large energy feedback on boundary plasmas will be pursued using the quantitative reflection results reported here.
Of qualitative in addition to quantitative interest is the energy distribution of the reflected He atoms, which undergoes an apparent transition from an exponential distribution, Eq. (13), to a Gaussian distribution, Eq. (14), as the incident He energy is lowered from eV to eV. This poses a theoretical puzzle for future modeling exercises. The angular distribution is found to have a weak azimuthal dependence, but a strong polar dependence. Although the conventional sine distribution is a reasonable approximation for normal incidence, the dependence of reflected He has a more extreme form at large incidence angle
The range distribution of implanted He is of interest in setting up longer-time scale materials studies under He irradiation. To that end, we recover the conventionally known Gaussian projected range distribution with exponential tails. The channeling effect is strong at K, but becomes less pronounced at fusion-relevant temperatures ( K), although it still exists in producing the exponential tail. Again, our studies cover a range of incidence angles, energies, W surface types, and substrate temperatures.
It is important to note that a detailed comparison of our new results with existing experimental, empirical and simulation results indicates much progress is desired for this decades-old problem. The agreements notwithstanding, the large spread in a key quantity of interest, the particle reflection coefficient, between our results and those of prior empirical and simulation data, is suggestive of the importance of additional experimental work in this important area of plasma-surface interaction research.
Acknowledgements.
We wish to thank N. Juslin for sharing the W and W-He interatomic potentials and T. Tabata for alerting us about typos in the reproduction of their fitting formulas in Ref. Eckstein . This work at Los Alamos National Laboratory (LANL) was supported by the United States Department of Energy (U.S. DOE), through the Office of Fusion Energy Science (VB and XZT), and the Office of Basic Energy Sciences (AFV). LANL is operated by Los Alamos National Security, LLC, for the National Nuclear Security Administration of the U.S. DOE, under contract DE-AC52-O6NA25396.| Deposition angle is | ||||
| (eV) | % refl. | % impl. | E reflection coeff. (%) | av. impl. depth (Å) |
| 5 (eV) | 100.0 | 0.0 | 92.93 | n/a |
| 10 (eV) | 100.0 | 0.0 | 91.20 | n/a |
| 20 (eV) | 97.7 | 2.3 | 81.93 | 4.23 |
| 30 (eV) | 90.7 | 9.3 | 70.38 | 5.51 |
| 40 (eV) | 83.5 | 16.5 | 65.89 | 6.93 |
| 60 (eV) | 74.1 | 25.9 | 58.25 | 11.40 |
| 80 (eV) | 66.8 | 33.2 | 51.91 | 16.60 |
| 100 (eV) | 60.2 | 39.8 | 46.86 | 22.70 |
| Deposition angle is | ||||
| (eV) | % refl. | % impl. | E reflection coeff. (%) | av. impl. depth (Å) |
| 5 (eV) | 100.0 | 0.0 | 93.32 | n/a |
| 10 (eV) | 100.0 | 0.0 | 91.11 | n/a |
| 20 (eV) | 97.8 | 2.2 | 79.00 | 5.21 |
| 30 (eV) | 88.9 | 11.1 | 66.08 | 5.0 |
| 40 (eV) | 82.0 | 18.0 | 61.47 | 7.36 |
| 60 (eV) | 72.0 | 28.0 | 55.43 | 10.57 |
| 80 (eV) | 68.4 | 31.6 | 54.16 | 14.98 |
| 100 (eV) | 65.3 | 34.7 | 51.65 | 20.09 |
| Deposition angle is | ||||
| (eV) | % refl. | % impl. | E reflection coeff. (%) | av. impl. depth (Å) |
| 5 (eV) | 100.0 | 0.0 | 93.66 | n/a |
| 10 (eV) | 100.0 | 0.0 | 91.03 | n/a |
| 20 (eV) | 98.3 | 1.7 | 78.47 | 3.97 |
| 30 (eV) | 87.7 | 12.3 | 64.33 | 5.44 |
| 40 (eV) | 79.5 | 20.5 | 60.61 | 6.47 |
| 60 (eV) | 69.9 | 30.1 | 54.67 | 10.74 |
| 80 (eV) | 63.5 | 36.5 | 48.80 | 15.54 |
| 100 (eV) | 64.2 | 35.8 | 50.48 | 20.23 |
| Deposition angle is | ||||
| (eV) | % refl. | % impl. | E reflection coeff. (%) | av. impl. depth (Å) |
| 5 (eV) | 100.0 | 0.0 | 95.65 | n/a |
| 10 (eV) | 100.0 | 0.0 | 94.35 | n/a |
| 20 (eV) | 99.6 | 0.4 | 88.90 | 2.68 |
| 30 (eV) | 94.1 | 5.9 | 79.20 | 4.41 |
| 40 (eV) | 88.0 | 12.0 | 72.25 | 6.68 |
| 60 (eV) | 73.6 | 26.4 | 60.57 | 10.23 |
| 80 (eV) | 69.5 | 30.5 | 55.84 | 14.80 |
| 100 (eV) | 63.4 | 36.6 | 50.07 | 20.29 |
| Deposition angle is | ||||
| (eV) | % refl. | % impl. | E reflection coeff. (%) | av. impl. depth (Å) |
| 5 (eV) | 100.0 | 0.0 | 98.29 | n/a |
| 10 (eV) | 100.0 | 0.0 | 97.73 | n/a |
| 20 (eV) | 100.0 | 0.0 | 97.28 | n/a |
| 30 (eV) | 100.0 | 0.0 | 96.73 | n/a |
| 40 (eV) | 99.5 | 0.5 | 94.87 | 4.59 |
| 60 (eV) | 96.8 | 3.2 | 90.26 | 11.01 |
| 80 (eV) | 92.7 | 7.3 | 84.74 | 14.36 |
| 100 (eV) | 84.5 | 15.5 | 75.75 | 19.27 |
| Deposition angle is | ||||
| (eV) | % refl. | % impl. | E reflection coeff. (%) | av. impl. depth (Å) |
| 5 (eV) | 100.0 | 0.0 | 99.78 | n/a |
| 10 (eV) | 100.0 | 0.0 | 99.74 | n/a |
| 20 (eV) | 100.0 | 0.0 | 99.59 | n/a |
| 30 (eV) | 100.0 | 0.0 | 99.54 | n/a |
| 40 (eV) | 100.0 | 0.0 | 99.52 | n/a |
| 60 (eV) | 100.0 | 0.0 | 99.46 | n/a |
| 80 (eV) | 100.0 | 0.0 | 99.40 | n/a |
| 100 (eV) | 100.0 | 0.0 | 99.33 | n/a |
| Deposition angle is | ||||
| (eV) | % refl. | % impl. | E reflection coeff. (%) | av. impl. depth (Å) |
| 5 (eV) | 100.0 | 0.0 | 93.02 | n/a |
| 10 (eV) | 100.0 | 0.0 | 91.59 | n/a |
| 20 (eV) | 97.0 | 3.0 | 82.39 | 4.47 |
| 30 (eV) | 89.7 | 10.3 | 71.86 | 4.45 |
| 40 (eV) | 86.7 | 13.3 | 69.05 | 6.94 |
| 60 (eV) | 74.9 | 25.1 | 59.58 | 12.21 |
| 80 (eV) | 66.3 | 33.7 | 51.90 | 22.18 |
| 100 (eV) | 59.5 | 40.5 | 46.33 | 34.00 |
| Deposition angle is | ||||
| (eV) | % refl. | % impl. | E reflection coeff. (%) | av. impl. depth (Å) |
| 5 (eV) | 100.0 | 0.0 | 93.52 | n/a |
| 10 (eV) | 100.0 | 0.0 | 91.38 | n/a |
| 20 (eV) | 98.4 | 1.6 | 78.43 | 2.08 |
| 30 (eV) | 87.1 | 12.9 | 64.61 | 4.76 |
| 40 (eV) | 78.4 | 21.6 | 57.77 | 6.09 |
| 60 (eV) | 68.9 | 31.1 | 53.67 | 10.65 |
| 80 (eV) | 62.8 | 37.2 | 49.54 | 14.94 |
| 100 (eV) | 64.2 | 35.8 | 50.09 | 21.12 |
| Deposition angle is | ||||
| (eV) | % refl. | % impl. | E reflection coeff. (%) | av. impl. depth (Å) |
| 5 (eV) | 100.0 | 0.0 | 98.20 | n/a |
| 10 (eV) | 100.0 | 0.0 | 97.79 | n/a |
| 20 (eV) | 100.0 | 0.0 | 97.42 | n/a |
| 30 (eV) | 100.0 | 0.0 | 96.97 | n/a |
| 40 (eV) | 99.9 | 0.1 | 96.13 | 6.92 |
| 60 (eV) | 95.7 | 4.3 | 89.67 | 9.25 |
| 80 (eV) | 92.8 | 7.2 | 85.13 | 12.67 |
| 100 (eV) | 86.8 | 13.2 | 78.37 | 17.66 |
| Deposition angle is | ||||
| (eV) | % refl. | % impl. | E reflection coeff. (%) | av. impl. depth (Å) |
| 5 (eV) | 100.0 | 0.0 | 93.09 | n/a |
| 10 (eV) | 100.0 | 0.0 | 91.09 | n/a |
| 20 (eV) | 98.2 | 1.8 | 81.34 | 4.39 |
| 30 (eV) | 89.9 | 10.1 | 69.28 | 5.20 |
| 40 (eV) | 82.2 | 17.8 | 63.54 | 7.87 |
| 60 (eV) | 74.5 | 25.5 | 58.39 | 11.00 |
| 80 (eV) | 68.4 | 31.6 | 52.74 | 16.38 |
| 100 (eV) | 64.0 | 36.0 | 50.13 | 22.33 |
| Deposition angle is | ||||
| (eV) | % refl. | % impl. | E reflection coeff. (%) | av. impl. depth (Å) |
| 5 (eV) | 100.0 | 0.0 | 94.25 | n/a |
| 10 (eV) | 100.0 | 0.0 | 91.26 | n/a |
| 20 (eV) | 98.3 | 1.7 | 77.69 | 3.10 |
| 30 (eV) | 89.7 | 10.3 | 66.32 | 5.47 |
| 40 (eV) | 77.9 | 22.1 | 59.00 | 7.27 |
| 60 (eV) | 71.0 | 29.0 | 54.15 | 11.30 |
| 80 (eV) | 66.8 | 33.2 | 52.34 | 16.13 |
| 100 (eV) | 65.7 | 34.3 | 50.54 | 20.49 |
| Deposition angle is | ||||
| (eV) | % refl. | % impl. | E reflection coeff. (%) | av. impl. depth (Å) |
| 5 (eV) | 100.0 | 0.0 | 98.23 | n/a |
| 10 (eV) | 100.0 | 0.0 | 97.85 | n/a |
| 20 (eV) | 100.0 | 0.0 | 97.32 | n/a |
| 30 (eV) | 99.7 | 0.3 | 96.39 | 6.49 |
| 40 (eV) | 99.3 | 0.7 | 94.58 | 7.21 |
| 60 (eV) | 94.6 | 5.4 | 87.58 | 9.81 |
| 80 (eV) | 88.8 | 11.2 | 81.22 | 15.09 |
| 100 (eV) | 86.2 | 13.8 | 76.47 | 19.35 |
| Deposition angle is | ||||
| (eV) | % refl. | % impl. | E reflection coeff. (%) | av. impl. depth (Å) |
| 5 (eV) | 100.0 | 0.0 | 93.10 | n/a |
| 10 (eV) | 100.0 | 0.0 | 89.68 | n/a |
| 20 (eV) | 96.5 | 3.5 | 66.44 | 3.85 |
| 30 (eV) | 85.5 | 14.5 | 59.42 | 4.87 |
| 40 (eV) | 77.8 | 22.2 | 57.42 | 6.56 |
| 60 (eV) | 72.2 | 27.8 | 54.77 | 10.01 |
| 80 (eV) | 62.6 | 37.4 | 48.34 | 13.55 |
| 100 (eV) | 61.4 | 38.6 | 46.19 | 19.13 |
| Deposition angle is | ||||
| (eV) | % refl. | % impl. | E reflection coeff. (%) | av. impl. depth (Å) |
| 5 (eV) | 100.0 | 0.0 | 94.74 | n/a |
| 10 (eV) | 100.0 | 0.0 | 93.84 | n/a |
| 20 (eV) | 99.2 | 0.8 | 84.62 | 3.73 |
| 30 (eV) | 87.6 | 12.4 | 66.63 | 4.78 |
| 40 (eV) | 76.7 | 23.3 | 58.05 | 6.46 |
| 60 (eV) | 67.7 | 32.3 | 50.58 | 10.48 |
| 80 (eV) | 60.7 | 39.3 | 46.45 | 14.90 |
| 100 (eV) | 57.9 | 42.1 | 44.51 | 21.43 |
| Deposition angle is | ||||
| (eV) | % refl. | % impl. | E reflection coeff. (%) | av. impl. depth (Å) |
| 5 (eV) | 100.0 | 0.0 | 98.52 | n/a |
| 10 (eV) | 100.0 | 0.0 | 98.27 | n/a |
| 20 (eV) | 100.0 | 0.0 | 98.12 | n/a |
| 30 (eV) | 100.0 | 0.0 | 97.92 | n/a |
| 40 (eV) | 100.0 | 0.0 | 97.60 | n/a |
| 60 (eV) | 99.7 | 0.3 | 96.51 | 2.05 |
| 80 (eV) | 97.5 | 2.5 | 92.67 | 14.05 |
| 100 (eV) | 94.0 | 6.0 | 87.36 | 14.95 |
| Deposition angle is | ||||
| (eV) | % refl. | % impl. | E reflection coeff. (%) | av. impl. depth (Å) |
| 5 (eV) | 100.0 | 0.0 | 93.30 | n/a |
| 10 (eV) | 100.0 | 0.0 | 90.85 | n/a |
| 20 (eV) | 98.2 | 1.8 | 75.26 | 4.08 |
| 30 (eV) | 85.0 | 15.0 | 60.48 | 4.76 |
| 40 (eV) | 76.4 | 23.6 | 55.63 | 6.90 |
| 60 (eV) | 70.4 | 29.6 | 54.26 | 10.62 |
| 80 (eV) | 67.8 | 32.2 | 52.89 | 15.49 |
| 100 (eV) | 63.3 | 36.7 | 49.18 | 20.80 |
| Deposition angle is | ||||
| (eV) | % refl. | % impl. | E reflection coeff. (%) | av. impl. depth (Å) |
| 5 (eV) | 100.0 | 0.0 | 94.54 | n/a |
| 10 (eV) | 100.0 | 0.0 | 92.93 | n/a |
| 20 (eV) | 99.1 | 0.9 | 82.82 | 3.71 |
| 30 (eV) | 91.7 | 8.3 | 71.06 | 5.31 |
| 40 (eV) | 81.9 | 18.1 | 65.36 | 6.57 |
| 60 (eV) | 73.3 | 26.7 | 58.49 | 11.44 |
| 80 (eV) | 69.0 | 31.0 | 55.09 | 16.69 |
| 100 (eV) | 65.0 | 35.0 | 50.56 | 21.47 |
| Deposition angle is | ||||
| (eV) | % refl. | % impl. | E reflection coeff. (%) | av. impl. depth (Å) |
| 5 (eV) | 100.0 | 0.0 | 97.74 | n/a |
| 10 (eV) | 100.0 | 0.0 | 97.18 | n/a |
| 20 (eV) | 100.0 | 0.0 | 96.60 | n/a |
| 30 (eV) | 99.6 | 0.4 | 94.57 | 3.46 |
| 40 (eV) | 96.9 | 3.1 | 90.99 | 6.53 |
| 60 (eV) | 91.4 | 8.6 | 83.67 | 11.72 |
| 80 (eV) | 85.2 | 14.8 | 76.29 | 15.92 |
| 100 (eV) | 83.6 | 16.4 | 73.43 | 21.02 |

| Deposition angle is | ||||
| (eV) | % refl. | % impl. | E reflection coeff. (%) | av. impl. depth (Å) |
| 5 (eV) | 36.22 | 63.78 | 13.49 | 4.0 |
| 10 (eV) | 45.60 | 54.40 | 15.39 | 5.0 |
| 20 (eV) | 49.05 | 50.95 | 15.96 | 7.0 |
| 30 (eV) | 50.37 | 49.63 | 16.54 | 9.0 |
| 40 (eV) | 50.37 | 49.63 | 16.34 | 11.0 |
| 60 (eV) | 50.95 | 49.05 | 16.81 | 13.0 |
| 80 (eV) | 48.76 | 51.24 | 16.07 | 15.0 |
| 100 (eV) | 49.12 | 50.88 | 16.58 | 18.0 |
References
- (1) V. Philipps, J. Roth, A. Loarte, Plasma Phys. Control. Fusion 45 (2003) A17.
- (2) M. Tokitani et al., J. Nucl. Mater. 337 (2005) 937.
- (3) N. Yoshida, H. Iwakiri, K. Tokunaga, T. Baba, J. Nucl. Mater. 337 (2005) 946.
- (4) S. Kajita, W. Sakaguchi, N. Ohno, N. Yoshida and T. Saeki, Nucl. Fusion 49 (2009) 095005.
- (5) A. A. van Gorkum and E. V. Kornelsen, Rad. Eff. 52 (1980) 25.
- (6) J. Amano and D. N. Seidman, J. Appl. Phys. 52 (1981) 6934.
- (7) M. T. Robinson, J. Nucl. Mater. 103 (1982) 525.
- (8) R. Ito, T. Tabata, N. Itoh, K. Morita, T. Kato, H. Tawara, Data on the backscattering coefficients of light ions from solids (A revision), Rep. IPPJ-AM-41, Institute of Plasma Physics, Nagoya (1985).
- (9) W. Eckstein, Atomic and Plasma - Material Interaction Data for Fusion 1 (1991) 17.
- (10) E. W. Thomas, R. K. Janev and J. Smith, Nucl. Instrum. Methods Phys. Res. B 69 (1992) 427.
- (11) K. O. E. Henriksson, K. Nordlund, J. Keinonen, D. Sundholm and M. Patzschke, Physica Scripta T108 (2004) 95.
- (12) K. O. E. Henriksson, K. Nordlund, J. Keinonen, Nucl. Instrum. Methods Phys. Res. B 244 (2006) 377.
- (13) M. Li, J. Wang, Q. Hou, J. Nucl. Mater. 423 (2012) 22.
- (14) J. F. Ziegler, M. D. Ziegler, J. P. Biersack, Nucl. Instrum. Methods Phys. Res. Sect. B 268 (2010) 1818.
- (15) G. J. Ackland, R. Thetford, Phil. Mag. A 56 (1987) 15.
- (16) N. Juslin, B. D. Wirth, J. Nucl. Mater. 432 (2013) 61.
- (17) M. Nastasi, J. W. Mayer and J. K. Hirvonen, Ion-Solid Interactions: Fundamentals and Applications (Cambridge University Press, 1996).
- (18) T. Tabata, R. Ito, Y. Itikawa, N. Itoh, K. Morita, H. Tawara, Dependence of the backscattering coefficients of light ions upon angle of incidence, Rep. IPPJ-AM-34, Institute of Plasma Physics, Nagoya (1984).
- (19) W. Eckstein, H. Verbeek and J. P. Biersack, J. Appl. Phys. 51 (1980) 1194.
- (20) P.M. Derlet, D. Nguyen-Manh, S.L. Dudarev, Phys. Rev. B 76 (2007) 054107.
- (21) C. Björkas, K. Nordlund, S.L. Dudarev, Nucl. Instr. Meth. Phys. Res. B 267 (2009) 3204.
- (22) C. Björkas, K. Nordlund, S.L. Dudarev, Nucl. Instr. Meth. Phys. Res. B 268 (2010) 1529.
- (23) P. Haussalo, K. Nordlund, J. Keinonen, Nucl. Instrum. Methods Phys. Res. B 111 (1996) 1.
- (24) J. Wang, Y. Zhou, M. Li, Q. Hou, J. Nucl. Mater. 427 (2012) 290.