xxx–xxx
A correlation between star formation rate and average black hole accretion rate in star forming galaxies
Abstract
We present the results of recent studies on the co-evolution of galaxies and the supermassive black holes (SMBHs) using Herschel far-infrared and Chandra X-ray observations in the Boötes survey region. For a sample of star-forming (SF) galaxies, we find a strong correlation between galactic star formation rate and the average SMBH accretion rate in SF galaxies. Recent studies have shown that star formation and AGN accretion are only weakly correlated for individual AGN, but this may be due to the short variability timescale of AGN relative to star formation. Averaging over the full AGN population yields a strong linear correlation between accretion and star formation, consistent with a simple picture in which the growth of SMBHs and their host galaxies are closely linked over galaxy evolution time scales.
keywords:
galaxies: evolution — galaxies: active — galaxies: starburst — Infrared: galaxies — X-rays: galaxies1 Introduction
For the past decades, it has became increasingly clear that the formation of stars in galaxies and the growth of supermassive black holes (SMBHs) might follow parallel evolutionary paths(see Alexander & Hickox, 2012, for a review). A number of studies have directly investigated the link between the growth of the galactic stellar mass (star formation rate, SFR) and the growth of SMBH mass (BH accretion rate, BHAR) in galaxies hosting active galactic nuclei (AGN). For high-luminosity AGNs, an increase in the average SFR as a function of BHAR has been observed (e.g. Lutz et al., 2008; Serjeant & Hatziminaoglou, 2009; Serjeant et al., 2010), while other studies have also found weak or inverted connections (Page et al., 2012; Harrison et al., 2012). Studies with inclusions of lower luminosity AGNs further suggest that the evolutionary link between SMBHs and their host galaxies only exists in high luminosity AGNs that are possibly triggered by mergers, and there is little or no correlation at lower AGN luminosities (e.g. Shao et al., 2010; Rosario et al., 2012; Rovilos et al., 2012). On the contrary, the studies of the average BHAR of SF galaxies imply that the galaxy and SMBH growth rates may be strongly connected when averaging over the whole population of SF galaxies (Rafferty et al., 2011; Mullaney et al., 2012a). Thus, whether BH growth follows SF in all galaxies, or only in the most powerful systems, remains a matter of debate.
The apparent contradictory results may be attributed to the difference in the characteristic timescales of SF and BH accretion. Both theoretical and observational studies have found evidence implying that the SMBH accretion rate can vary by several orders of magnitudes in a time scale much shorter than the typical time scale for galactic star formation events (see Hickox et al., 2013, and reference therein). Therefore, to uncover the relation between the SFR and BHAR, the key quantity to study may therefore be the average AGN luminosity of a population, which thus smoothes over the variations of individual sources. Here we present a study investigating the average BHAR in SF galaxies for a sample in the Boötes survey region (Chen et al., 2013; Hickox et al., 2013).
2 Sample
We use data from the 9 deg2 Boötes multiwavelength survey, which is covered by the optical observations from NOAO Deep Wide Field Survey (Jannuzi & Dey, 1999) and the AGN and Galaxy Evolution Survey (AGES, Kochanek et al., 2012), X-ray data from the Chandra XBoötesSurvey (Murray et al., 2005), mid-IR data from Spitzer IRAC Shallow Survey (ISS, Eisenhardt et al., 2004), Spitzer Deep Wide Field Survey (SDWFS, Ashby et al., 2009) and MIPS observations, and far-IR data from the Herschel HerMES survey (Oliver et al., 2012). The redshifts of our sample come from the AGES survey (spectroscopic) as well as ISS and SDWFS (photometric, Brodwin et al., 2006). Our sample is composed of SF galaxies selected using both the Herschel SPIRE observations and the Spitzer MIPS observations.
3 Results
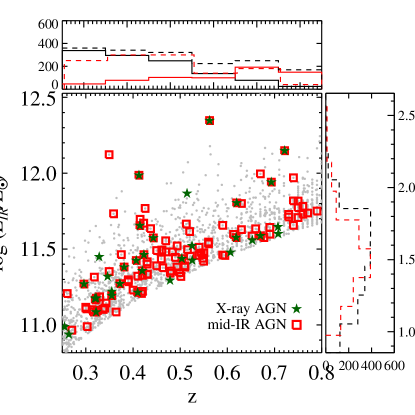
We first derive the SFR for our SF galaxies by extrapolating the flux measurements to the bolometric infrared luminosity () using the SF galaxy templates from Kirkpatrick et al. (2012). Since the bulk of comes from the cold dust in SF galaxies, and the distribution of dust temperature in SF galaxies has reasonably small scatter, we first derive the total for every galaxy in our sample using the ratio between the observed-frame monochromatic flux to the total derived from the Kirkpatrick et al. (2012) template. We next convert the to SFR using a Kennicutt relation adjusted to a Chabrier IMF. The redshift and SFR distribution of our sample is shown in Fig. 1. We refer the detailed discussion of SFR estimation of our sample to §2.5 in Chen et al. (2013).
To determine the connection between the SF activity and the average SMBH accretion rate, we measure AGN luminosities using a combination of X-ray and mid-IR observations. In detail, we convert the mid-IR or X-ray luminosity for individually detected, X-ray (with (2-10keV) ) or mid-IR selected AGNs (Stern et al., 2005) using the average bolometric correction factor from Vasudevan & Fabian (2007) and a radiative efficiency of 0.1. For SF galaxies without direct identified AGN, we measure their average X-ray luminosity and BHAR using an X-ray stacking analysis in bins of their SFR (Hickox et al., 2007).
We next measure the average BHAR for our entire sample by averaging the for the detected AGN and the remaining SF galaxies in bins of SFR. We find an almost linear relation between SFR and BHAR:
| (1) |
We tested the effect of the flux limits to the observed SFR-BHAR correlation using a mock catalog of galaxies with the flux limits similar to our sample. We found that for a mock catalog of galaxies without intrinsic SFR-BHAR correlation, the observed correlation in the flux limits similar to our real sample is much weaker than the relation observed in Eq. (1). In addition, the observed evolution of as a function of the average redshift in the different bins of our sample is at least 1.0 dex larger than the pure redshift evolution of the X-ray luminosity function, indicating that most, if not all, of our observed trend is due to the intrinsic correlation between SFR and BHAR.
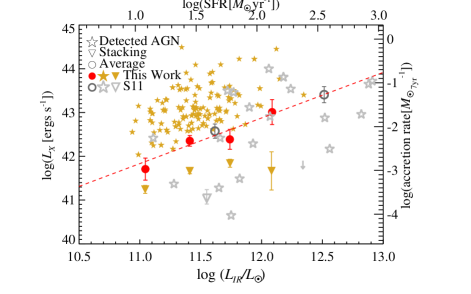
We also compared our result with the sample of Herschel selected SF galaxies in the pencil-beam Chandra Deep Field-North (Symeonidis et al., 2011) at redshift . Since Symeonidis et al. (2011) measured the and for both detected AGN and normal SF galaxies separately, we could make a direct comparison of the SFR-average BHAR correlation by calculating the average BHAR for their sample using the same methods that we used to derive our average BHAR. The results are displayed in Fig. 2, which show the presence of a correlation between SFR and average BHAR in samples of SF galaxies for a range of redshifts and X-ray flux limits.
4 Conclusion
In summary, we studied the average BHAR from a sample of SF galaxies with SFR measurements using Herschel. We selected AGNs at X-ray and mid-IR wavelengths to ensure that our BHAR is not biased by AGN obscuration, and employed an X-ray stacking analysis to measure SMBH accretion for SF galaxies without direct X-ray or mid-IR identifications. We obtained an almost linear relation between the average BHAR and SFR of , and determined that this relation also holds for deeper, narrower observations, suggesting that the average BHAR to SFR correlation is a universal consequence of the coevolution between SMBHs and galaxies. The next step of understanding the SFR to BHAR correlation in different populations of galaxies requires information on the distribution of AGN X-ray luminosity as a function of SFR, which provides motivation for wide, deep X-ray surveys in multiwavelength fields.
References
- Alexander & Hickox (2012) Alexander, D. M., & Hickox, R. C. 2012, New Astronomy Reviews, 56, 93
- Ashby et al. (2009) Ashby, M. L. N., Stern, D., Brodwin, M., et al. 2009, ApJ, 701, 428
- Brodwin et al. (2006) Brodwin, M., Brown, M. J. I., Ashby, M. L. N., et al. 2006, ApJ, 651, 791
- Chen et al. (2013) Chen, C.-T. J., Hickox, R. C., Alberts, S., et al. 2013, ApJ, 773, 3
- Eisenhardt et al. (2004) Eisenhardt, P. R., Stern, D., Brodwin, M., et al. 2004, ApJS, 154, 48
- Harrison et al. (2012) Harrison, C. M., Alexander, D. M., Mullaney, J. R., et al. 2012, ApJ, 760, L15
- Hickox et al. (2007) Hickox, R. C., Jones, C., Forman, W. R., et al. 2007, ApJ, 671, 1365
- Hickox et al. (2013) Hickox, R. C., Mullaney, J. R., Alexander, D. M., et al. 2013, ApJ submitted (arXiv:1306.3218)
- Jannuzi & Dey (1999) Jannuzi, B. T., & Dey, A. 1999, in ASP Conf. Ser. 191: Photometric Redshifts and the Detection of High Redshift Galaxies, ed. R. Weymann, L. Storrie-Lombardi, M. Sawicki, & R. Brunner (San Francisco: ASP), 111
- Kirkpatrick et al. (2012) Kirkpatrick, A., Pope, A., Alexander, D. M., et al. 2012, ApJ, 759, 139
- Kochanek et al. (2012) Kochanek, C. S., Eisenstein, D. J., Cool, R. J., et al. 2012, ApJs, 200, 8
- Lutz et al. (2008) Lutz, D., Sturm, E., Tacconi, L. J., et al. 2008, ApJ, 684, 853
- Mullaney et al. (2012a) Mullaney, J. R., Pannella, M., Daddi, E., et al. 2012a, MNRAS, 419, 95
- Murray et al. (2005) Murray, S. S., Kenter, A., Forman, W. R., et al. 2005, ApJs, 161, 1
- Oliver et al. (2012) Oliver, S. J., Bock, J., Altieri, B., et al. 2012, MNRAS, 23
- Page et al. (2012) Page, M. J., Symeonidis, M., Vieira, J. D., et al. 2012, Nature, 485, 213
- Rafferty et al. (2011) Rafferty, D. A., Brandt, W. N., Alexander, D. M., et al. 2011, ApJ, 742, 3
- Rosario et al. (2012) Rosario, D., Santini, P., Lutz, D., et al. 2012, A&A, 545, A45
- Rovilos et al. (2012) Rovilos, E., Comastri, A., Gilli, R., et al. 2012, A&A, 546, A58
- Serjeant & Hatziminaoglou (2009) Serjeant, S., & Hatziminaoglou, E. 2009, MNRAS, 397, 265
- Serjeant et al. (2010) Serjeant, S., Bertoldi, F., Blain, A. W., et al. 2010, A&A, 518, L7
- Shao et al. (2010) Shao, L., Lutz, D., Nordon, R., et al. 2010, A&A, 518, L26+
- Stern et al. (2005) Stern, D., Eisenhardt, P., Gorjian, V., et al. 2005, ApJ, 631, 163
- Symeonidis et al. (2011) Symeonidis, M., Georgakakis, A., Seymour, N., et al. 2011, MNRAS, 417, 2239
- Vasudevan & Fabian (2007) Vasudevan, R. V., & Fabian, A. C. 2007, MNRAS, 381, 1235