E(B-V), N(H I) and N()
Abstract
We consider the structure of the N(H I) - E(B-V) relationship when H I is measured in the 21 cm radio line and E(B-V) is defined by far-IR dust-derived measures. We derive reddening-dependent corrections to N(H I) based on interferometric absorption measurements over the past 30 years that follow a single power-law relationship E(B-V)1.074 at 0.02 E(B-V) 3 mag. Corrections to 21cm line-derived H I column densities are too small to have had any effect on the ratio N(H I)/E(B-V) mag-1 we derived at 0.015 E(B-V) 0.075 mag and 20o; they are also too small to explain the break in the slope of the N(H I) - E(B-V) relation at E(B-V) 0.1 mag that we demonstrated around the Galaxy at o. The latter must therefore be attributed to the onset of -formation and we show that models of formation in a low density diffuse molecular gas can readily explain the inflected N(H I)- E(B-V) relationship. Below = 20o N(H I)/E(B-V) measured at 0.015 E(B-V) 0.075 mag increases steadily down to = 8o where sightlines with small E(B-V) no longer occur. By contrast, the ratio N(H I)/E(B-V) measured over all E(B-V) declines to N(H I)/E(B-V) mag-1 at o, perhaps providing an explanation of the difference between our results and the gas/reddening ratios measured previously using stellar spectra.
1 Introduction
In an earlier paper (Liszt, 2014) we considered the relationship between H I column density N(H I) derived from the large-scale 21cm H I sky surveys (Kalberla et al., 2005; Peek et al., 2011), and reddening E(B-V) as derived from far IR dust emission by Schlegel et al. (1998) (SFD98). We traced N(H I) and E(B-V) around the sky at galactic latitudes and considered data at lower column densities mag, where the hydrogen should be in the form of neutral atoms and corrections to N(H I) for saturation and -formation are unimportant. We showed that the relevant value of the gas/reddening ratio is N(H I)/E(B-V) mag-1, considerably larger than the usually-cited ratio N(H)/E(B-V) mag-1 derived from optical/uv absorption measurements toward stars by Bohlin et al. (1978), where N(H) = N(H I) + 2N(). It is also larger than the values N(H I)/E(B-V) mag-1 that are consistently quoted for stellar reddening and Ly- absorption toward early-type stars (Bohlin et al., 1978; Shull & van Steenberg, 1985; Diplas & Savage, 1994).
In fact there are two mysteries in the disparity between radio/IR and optical/uv derivations of N(H)/E(B-V). The first is the numerical discrepancy, which puts several 21 cm surveys and the work of SFD98 together on one side in opposition to Ly- measurements by several groups using IUE and Copernicus and stellar reddening on the other. The second is the very nearly constant value for N(H I)/E(B-V) quoted for the stellar data, as opposed to the radio-IR relationship shown in Figure 1 of Liszt (2014) that had a very strong point of inflection to smaller N(H I)/E(B-V) at E(B-V) 0.08 mag. In principle the inflection in the radio data could reflect either the influence of saturation of the 21cm line profiles or the expected onset of formation as originally discovered in the uv absorption data (Savage et al., 1977). We noted a seemingly similar inflection in the IUE results of Diplas & Savage (1994), whereby much higher values of N(H I)/E(B-V) were seen at E(B-V) mag (their Fig. 4a), but this was not taken into account in their final result. It should also have been present in the earlier treatment of the IUE results by Shull & van Steenberg (1985), who derived very nearly the same numerical result as in the later work.
This work is largely concerned with understanding the change in slope of the radio-IR defined N(H I)-E(B-V) relationship, unravelling the possibly competing effects of 21cm H I line saturation and -formation. In Section 2 we discuss independent measures of 21cm H I optical depth as a function of reddening, which can be employed to show that saturation corrections to 21cm measurements of N(H I) are small at least until E(B-V) 0.3 mag. In that case, only -formation can explain the observed inflection. In Sect. 3 we show that rather conventional models of formation in a low density diffuse molecular gas can reproduce the observed N(H I)-E(B-V) relationship. In Section 4 we extend our analysis to lower galactic latitude = 9o- 20o and show that that there are progressively higher values of N(H I)/E(B-V) at all E(B-V) as declines. Section 5 is a brief summary and discussion.
2 Optical depth and saturation correction in the 21cm line
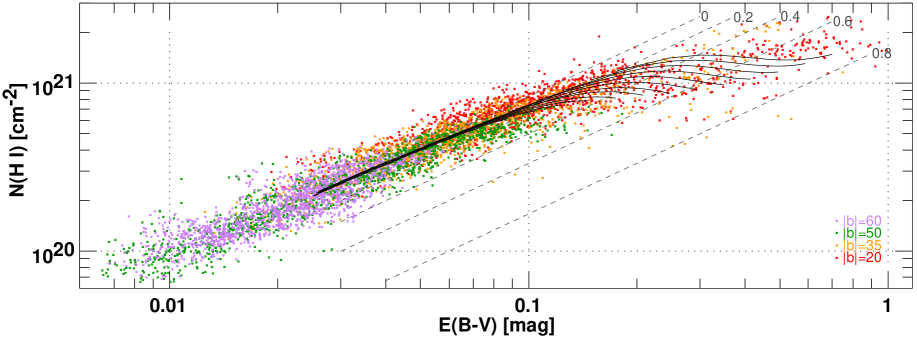
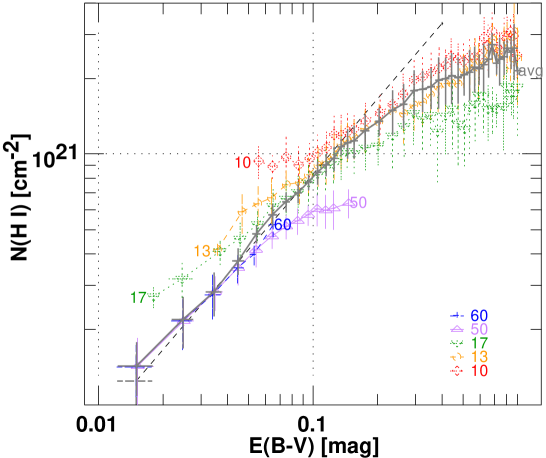
Figure 1 shows an updated and annotated version of the N(H I)-E(B-V) relationship first shown in (Liszt, 2014), again using H I profiles from the LAB (Leiden-Argentina-Bonn) all-sky H I survey (Kalberla et al., 2005) and E(B-V) from the work of SFD98. Explaining the annotations and the rather modest saturation correction to N(H I) that has been applied to the data is the subject of the current work. In passing, please note that Figure 1 of Liszt (2014) inadvertently displayed the data for only that half the sky at 0o o, without affecting the numerical results. Note also that the phenomenon of gas without dust, which manifests itself as high ratios of N(H I)/E(B-V) at small E(B-V), is not clearly present down to reddenings as small as 0.01 mag. Also missing at small values of E(B-V) is a downturn in N(H I) that could have signalled the presence of in increasing fracion of warm ionized gas.
2.1 Systematic variation of the 21cm optical depth with reddening
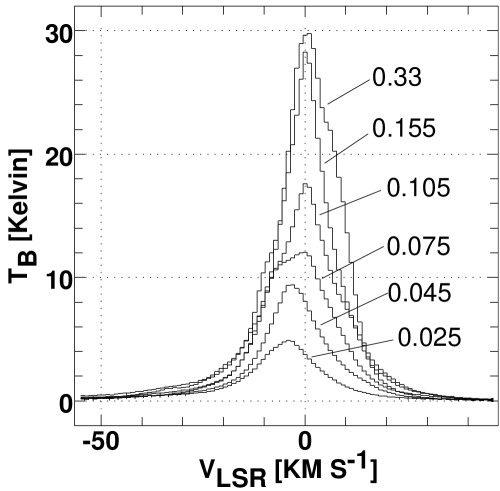
To understand the possible effects of saturation we began by binning the data in reddening (averaging over all the data comprising Fig. 1) and forming mean H I emission profiles as a function of reddening. Figure 2 shows some of these for 0.025 mag mag and it is clear that imputing high optical depth to the profiles around E(B-V) = 0.1 mag would require spin temperatures below 30 K for which there is no support in such diffuse gas.
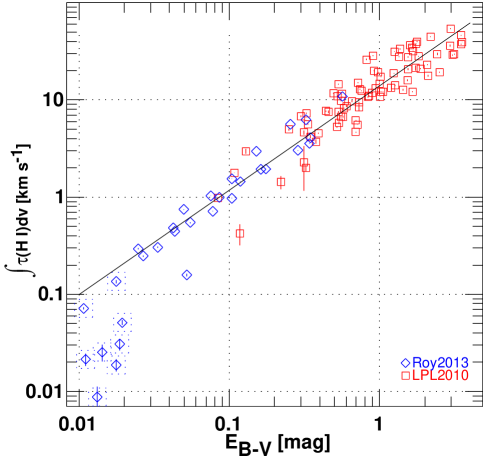
The argument for modest optical depths may be made quantitative by considering the variation of measured 21cm optical depth = (units of km s-1) with reddening first discussed by Liszt et al. (2010) using a combination of their own more recent VLA data and that measured earlier by Dickey et al. (1983). Liszt et al. (2010) showed that there is a strong, nearly-linear relationship between and E(B-V) but with scant data at higher galactic latitude and with much scatter and sparse data-coverage at E(B-V) 0.3 mag. This situation is alleviated by inclusion of the new results of Roy et al. (2013) as shown in Fig. 3 111 For sightlines in common between the two datasets, the value from Liszt et al. (2010) has been retained.
The error-weighted regression line in Fig. 3 is log log E(B-V) or = 14.07E(B-V)1.074, using all the datapoints shown at E(B-V) 0.02 mag. The ratio /E(B-V) changes by only 45% over the range 0.02 mag.
H I absorption (hence the presence of the cold neutral medium) is not consistently detected below E(B-V) = 0.02 mag. This was noted by Kanekar et al. (2011) who described the lack of H I absorption for N(H I) . This implies a ratio N(H I)/E(B-V) mag-1 in keeping with the values found in our work but a more quantitative estimate can be derived from the table of and optical-depth corrected N(H I) of Roy et al. (2013), from which it is found that N(H I)/E(B-V) mag-1.
Note that Fig. 3 appears to validate the use of E(B-V) from SFD98 up to rather higher values and at rather lower galactic latitudes than are usually believed to be reliable, see the discussion in the original work. Unlike the original discussion in Liszt et al. (2010) the relationship between and E(B-V) is demonstrated over a wide range of galactic latitudes 1o-60o.
2.2 Saturation correction to N(H I)
A general saturation correction can be determined by constraining the derived column densities N(H I) to conform to the empirical -E(B-V) relationship, where the free parameter connecting N(H I) to is the spin temperature that is used to convert the observed brightness temperature profiles to N(H I). From the single power law for the -E(B-V) relationship and the inflected variation of N(H I) with E(B-V) in Fig. 1 it may be inferred that there is a variation in the mean spin temperature with increasing E(B-V), actually a decline leading to a saturation correction that increases with E(B-V) as expected.
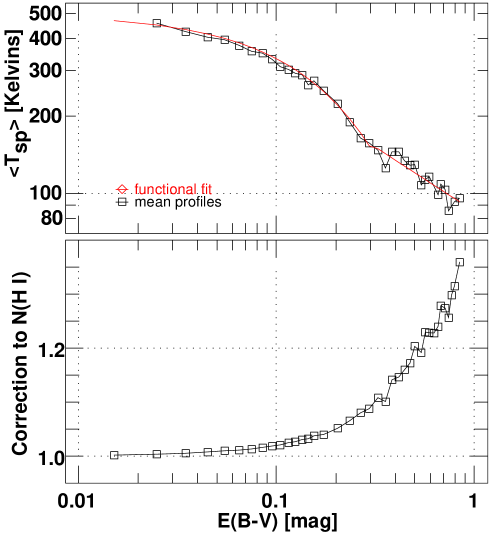
We began by deriving mean values from binned H I profiles (Fig. 2) across the range of E(B-V), assuming the power-law -E(B-V) relationship shown in Fig. 3: these mean are shown in the upper panel of Fig. 4. Then we fit a smooth function to the variation of with E(B-V) and applied that to all H I profiles individually to correct them for the optical depth implied by their known reddening. This process is self-consistent in reproducing the power-law -E(B-V) relationship when applied to the data at large. The power-law -E(B-V) relation breaks down at E(B-V) 0.02 mag, N(H I) , leading to an underestimation of the mean , but no correction for saturation is needed at such small N(H I) anyway.
Fig. 4 at bottom shows the derived saturation correction as a multiplicative correction to the values of N(H I) derived from the mean H I profiles in the limit of zero optical depth, N(H I) with the integral expressed in units of K-km s-1. Note that the variation and the corrections shown are relevant only to the data that was considered. A different dataset might require a different variation of with E(B-V) (see Section 4 below) and the magnitude of the correction that must be applied depends not only on but on the H I profile itself. When the profile integral is very small, even very small do not result in a significant correction to the optically thin value of N(H I). As well, the derived at a given E(B-V) might be very different for different datasets without implying significantly different correction factors at that E(B-V). The point is that N(H I)/ by definition but N(H I) depends on only when the optical depth is high.
In any case, the correction factor relevant to the dataset shown in Fig. 1 is below 20% for E(B-V) 0.5 mag. In Liszt (2014) we used a constant = 145 K but the important ramifications of the data are the same. There is no appreciable correction to N(H I) at small E(B-V), leading to a reliable value for N(H I)/E(B-V). The correction for saturation is not responsible for the inflection in the plot of N(H I)/E(B-V), which must be ascribed to the onset of -formation.
The relevance and accuracy of using a so-called isothermal correction to N(H I) given the optical depth absorption profile has recently been examined by Chengalur et al. (2013), who derive correction factors comparable to ours. The correction is described as isothermal because a single is applied at each velocity to emission that is a blend of contributions from different gas phases. The correction does an excellent job of bounding even very large errors in N(H I) that may occur at = 1-10 km s-1 when the optical depth is unknown. The method adopted here is broader because we use an implied optical depth integral to derive a single value of across an entire line profile but the conclusions are the same.
3 The influence of formation on N(H I)
The empirical correction factors derived in Sect. 2 were applied to the data in Fig. 1 but a significant gap remains at E(B-V) 0.1 mag between the observed, corrected N(H I) and the straight line N(H I)/E(B-V) mag-1 that is applicable below E(B-V) = 0.08 mag where -formation does not occur (Bohlin et al., 1978). That is also the line of zero molecular fraction, and superposed on the data are (dashed) lines of constant molecular hydrogen fraction f = 1-N(H I)/N(H), indicating very high molecular fractions at high E(B-V).
Also shown in Fig. 1 are the results of a model calculation of -formation in a diffuse gas at low density n(H) = 14. These are the same equilibrium heating/cooling/-formation models we have used earlier in for instance Liszt (2007) to illustrate and CO formation, but now with the remainder H I shown on the vertical axis. Also, the models were calculated using the newly inferred value N(H)/E(B-V) mag-1 that provides less dust shielding and extinction at a given N(H). Each leaf of the plot is for a separate cloud model having a central hydrogen column density N(H) differing by a factor 21/4 from its neighbors and the variation along each leaf represents the locus of column density seen at all impact parameters across the face of the model. The right-most points along each leaf correspond to sightlines passing closer to the center of the model and so would be observed with smaller probability in real observations.
In any case, the point is to demonstrate that although there seems to be little alternative to -formation, that explanation also works in practice.
4 Latitude variation
Fig. 1 shows that the data at latitudes at 20o fit together into a coherent whole with a single message about N(H I)/E(B-V) over the Galaxy and over a wide range of E(B-V). This is not true of the sky at smaller , as will be discussed now.
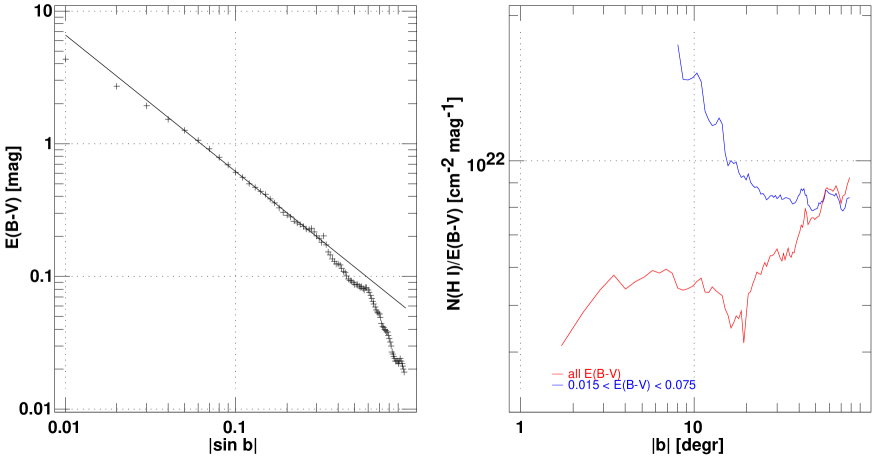
Figure 5 at left shows the latitude variation of the mean reddening averaged around the sky. Below about 15o much of the sky is well-described by the cosecant law expected for a plane-parallel stratified medium. At higher latitudes the latitude dependence progressively steepens with, finally, a cubic dependence (actually, power-law -3.1) for 36o. Given these gradients we worried that the larger H I beamsize of the LAB survey might have artificially increased the values we derived for N(H I)/E(B-V). The disparity in beamsizes (36′ vs 6′) would merely introduce scatter for a uniform sky, but the larger H I beam has a slightly lower intensity-weighted mean when viewing a medium that is concentrated to the galactic equator.
Numerical integration over the H I beam using the gradients shown in Fig. 5 suggested that the effect would not be important but as a test we recalculated our results comparing N(H I) with E(B-V) measured 9′ and 18′ closer to the galactic equator (ie 50% and 100% of the radius of the H I beam). We found only that the mean N(H I)/E(B-V) declined progressively below = 8o, by a maximum of 5% at = 4o. The vertical sky gradient should not have affected any of the conclusions drawn in this work.
At the right in Figure 5 we show the variation in the mean N(H I)/E(B-V) at 0.015 E(B-V) 0.075 mag and over all E(B-V)222 Note that we derived a separate saturation correction at 20o where profiles are broader, with smaller peak brightness and integrated opacity at a given N(H I) or E(B-V).. N(H I)/E(B-V) measured over the confined range varies little at 20o, in keeping with Fig. 1, but increases rapidly down to = 8o, below which there are no LAB survey grid-points in the confined E(B-V) range. The mean N(H I)/E(B-V) taken over all E(B-V) behaves oppositely, staying near N(H I)/E(B-V) = mag-1 at 20o and increasing above. The two curves increasingly coincide at larger where there are fewer positions with high reddening. The values N(H I)/E(B-V) mag-1 measured over all E(B-V) at 30o may explain the difference between and our results and those obtained previously (Savage et al., 1977; Shull & van Steenberg, 1985; Diplas & Savage, 1994) from stellar absorption spectra.
To better understand the latitude variation, Fig. 6 shows N(H I)/E(B-V) for data at high and low , binned in E(B-V). formation forces N(H I) down while the curves in Fig. 6 lay higher at smaller where the overall -fraction should be larger. Reconciling the low-latitude curves in Fig. 6 with a constant N(H)/E(B-V) mag-1 requires recognizing two effects:
- i)
-
The curves generally rise for smaller because sightlines at lower latitude and higher E(B-V) are, somewhat counter-intuitively, less likely to be molecular. Only at low latitude is it possible to accumulate strong reddening over long pathlengths, in gas devoid of .
- ii)
-
The low-latitude curves lie above the regression line. So either the gas/reddening ratio increases closer to the galactic plane or the curves must be shifted to the right. Very recent results from Planck Planck Collaboration et al. (2013) suggest just such a correction as noted in Section 5.
5 Discussion
When E(B-V) from SFD98 is compared with 21cm H I column densities at 0.015 E(B-V) 0.075 mag where -formation should be negligible, the stable ratio N(H I)/E(B-V) = mag-1 derived at 20o substantially exceeds the seemingly universal value N(H I)/E(B-V) mag-1 that is derived from optical/uv absorption line work (Bohlin et al., 1978; Mirabel & Gergely, 1979; Shull & van Steenberg, 1985; Diplas & Savage, 1994). Moreover the N(H I)/E(B-V) ratio measured over the same restricted range of reddening increases strongly for 20o, approximately doubling down to = 8o, at which point sightlines with E(B-V) 0.075 mag do not exist in the data we considered at the gridpoints of the LAB all-sky H I survey,
At 20o, corrections to N(H I) for optical depth in the 21cm line exceed 20% only at E(B-V) 0.5 mag, given the observed profiles and the integrated H I optical depth-reddening law we derived from interferometric H I absorption measurements, E(B-V)1.074 at 0.02 E(B-V) 3 mag. Optical depth corrections to N(H I) are even smaller at 10o 20o where the galactic velocity gradient is more apparent and profiles have smaller peak 21cm brightness for a given N(H I) and E(B-V). In this case only -formation can be responsible for the inflection in the N(H I)-E(B-V) relationship that occurs at E(B-V) 0.08 mag and we showed model results for -formation in a low density diffuse gas that are a good match to the data.
In our earlier work we discussed possible corrections to the reddening maps of SFD98, based on previous work by other investigators; the prevailing view appeared to be that the reddening maps of SFD98, had, if anything, overestimated E(B-V). Correcting the results of SFD98 in that manner would only exaggerate the effect discussed here. More recently the Planck dust maps have appeared (Planck Collaboration et al., 2013), and they may tell a different story. Although the Zodaical Emission-corrected 353 GHz optical depth maps converted to reddening give the same result we derived, N(H I)/E(B-V) mag-1, those maps are recommended for use only at larger E(B-V). By contrast, the Planck reddening maps based on QSO colors that are recommended for use below E(B-V) = 0.3 mag would have E(B-V)′ = (E(B-V)SFD+0.003 mag)/0.92. When such a transformation is used to rederive the present results, we find a high-latitude asymptote N(H I)/E(B-V) mag-1, accounting for about half the effect noted, in the log sense. This transformation increasing the E(B-V) values of SFD98 at smaller E(B-V) would shift the curves in Fig. 6 to the right in the manner required to reconcile them with a single value of N(H I)/E(B-V), as discussed in Sect. 4.
References
- Bohlin et al. (1978) Bohlin, R. C., Savage, B. D., & Drake, J. F. 1978, ApJ, 224, 132
- Chengalur et al. (2013) Chengalur, J. N., Kanekar, N., & Roy, N. 2013, MNRAS, 432, 3074
- Dickey et al. (1983) Dickey, J. M., Kulkarni, S. R., Heiles, C. E., & Van Gorkom, J. H. 1983, ApJS, 53, 591
- Diplas & Savage (1994) Diplas, A. & Savage, B. D. 1994, ApJ, 427, 274
- Kalberla et al. (2005) Kalberla, P. M. W., Burton, W. B., Hartmann, D., et al. 2005, A&A, 440, 775
- Kanekar et al. (2011) Kanekar, N., Braun, R., & Roy, N. 2011, ApJ, 737, L33
- Liszt (2014) Liszt, H. 2014, ApJ, 780, 10
- Liszt (2007) Liszt, H. S. 2007, A&A, 476, 291
- Liszt et al. (2010) Liszt, H. S., Pety, J., & Lucas, R. 2010, A&A, 518, A45
- Mirabel & Gergely (1979) Mirabel, I. F. & Gergely, T. E. 1979, A&A, 77, 110
- Peek et al. (2011) Peek, J. E. G., Heiles, C., Douglas, K. A., et al. 2011, ApJS, 194, 20
- Planck Collaboration et al. (2013) Planck Collaboration, Abergel, A., Ade, P. A. R., et al.2013, arXiv preprint, astroph:1312.1300, submitted to A&A
- Roy et al. (2013) Roy, N., Kanekar, N., Braun, R., & Chengalur, J. N. 2013, MNRAS,436, 2352
- Savage et al. (1977) Savage, B. D., Drake, J. F., Budich, W., & Bohlin, R. C. 1977, ApJ, 216, 291
- Schlegel et al. (1998) Schlegel, D. J., Finkbeiner, D. P., & Davis, M. 1998, ApJ, 500, 525
- Shull & van Steenberg (1985) Shull, J. M. & van Steenberg, M. E. 1985, ApJ, 294, 599