The dominant epoch of star formation in the Milky Way formed the Thick Disc
Abstract
We report the first robust measurement of the Milky Way star formation history using the imprint left on chemical abundances of long-lived stars. The formation of the Galactic thick disc occurs during an intense star formation phase between 9.0 (z1.5) and 12.5 Gyr (z4.5) ago and is followed by a dip (at z1.1) lasting about 1 Gyr. Our results imply that the thick disc is as massive as the Milky Way’s thin disc, suggesting a fundamental role of this component in the genesis of our Galaxy, something that had been largely unrecognized. This new picture implies that huge quantities of gas necessary to feed the building of the thick disc must have been present at these epochs, in contradiction with the long-term infall assumed by chemical evolution models in the last two decades. These results allow us to fit the Milky Way within the emerging features of the evolution of disc galaxies in the early Universe.
Subject headings:
Galaxy: abundances — Galaxy: disk — Galaxy: evolution — galaxies: evolution1. Introduction
Galaxies in the early Universe have clumpy, highly turbulent, gas-dominated discs (Elmegreen et al., 2007; Genzel et al., 2008) and are vigorously forming stars. They are believed to sustain their high rates of star formation by the accretion of cold gas along filaments into their central regions (Kereš et al., 2005, 2009; Dekel et al., 2009). The most intense phase of star formation takes place at redshifts 1-5 (Hopkins & Beacom, 2006), with steep decline thereafter (Madau et al., 1996). It is currently unknown how our Milky Way (hereafter MW) galaxy fits into this general scheme. A fundamental piece of the puzzle is missing in our understanding of the star formation history (hereafter SFH) of the MW, and its association with galaxies observed in the early Universe. The aim of this study is to present the first results of a new method to measure the SFH in our Galaxy using chemical abundances.
The chemical elements formed and ejected by the early generations of stars during the formation of the MW are now found in the atmospheres of old, long-lived stars. The absolute and relative abundances of these elements are a gauge of the past star formation as the Galaxy evolved. Observed variations in the elemental abundance patterns as a function of the age of the stars can be reproduced with a chemical evolution model to infer the SFH of our Galaxy. The method has the huge advantage that, if stars have different origins in the disc, and follow a uniform evolution (as is the case for the thick disc, see below), the measured SFH is non-local, and valid for the entire population. Although the approach is model-dependent, and its validity relies on assumptions which are still largely debated - such as the invariance of the IMF with time - it is much more economical and straightforward than standard methods, which aim to reconstruct the Galactic SFH by determining individual stellar ages for volume complete samples. Our method does not rely on star density, it uses only abundance variations as a function of age, thus is not limited by number densities-related problems such as the design of volume complete samples, scale height corrections, etc. Moreover, it gives access to detailed variations of the SFH at ancient epochs, a domain that is likely to remain inaccessible with standard methods at least until the advent of the ESA astrometric mission, Gaia. Counting stars as a function of age for ancient populations is indeed impractical for the time being, simply because there are not enough old stars with sufficiently accurate ages.
2. Observations
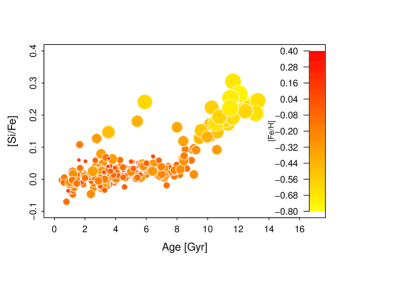
We base our study on a spectroscopic dataset of 1111 F, G and K dwarfs stars from the solar vicinity (Adibekyan et al., 2012). Ages were obtained using a Bayesian estimate of the probability distribution function for each star (Haywood et al., 2013) and a severe pruning to only include stars with robust age estimates has been applied. Moreover, in the present study we exclude outer thin disc stars (stars on the thin disc sequence – e.g, low-alpha stars, see Haywood et al. (2013) – with [Fe/H] -0.2 dex), because of their possible separate chemical evolution history (Haywood et al., 2013). This reduces the sample to 281 stars. Fig. 1 shows the distribution of [Si/Fe] versus age for the final sample. It illustrates a change of slope in the declining ratio of [/Fe] at about 8 Gyr. Two distinct phases in the abundance enrichment history of the MW are clearly evident (Haywood et al., 2013).
As in Haywood et al. (2013), we define the thin and thick discs as corresponding to these two different phases, with a transition between these two formation epochs about 8–9 Gyr ago. Starting from this result, we sought to model the corresponding variation in the SFH needed to reproduce these trends in [/Fe] with time.
3. Model
Our modelling approach assumes the following:
(i) All the gas is in the system at
the beginning, with no inflow or outflow. This is similar to a closed-box model (Tinsley, 1980), but is
equivalent to saying that most accretion in the inner disc (R10 kpc)
occured early.
(ii) The ISM is
initially devoid of metals and remains well mixed during its whole
evolution.
(iii) Because our aim is to recover the Galactic SFH, no coupling between the star formation rate and the gas content
is assumed. Instead, we determine the SFH by fitting our model to the data.
Our approach is otherwise typical of chemical evolution models. We adopt standard theoretical yields (Iwamoto et al., 1999; Nomoto et al., 2006; Karakas, 2010), an IMF (Kroupa, 2001) independent of time, and a stellar mass-lifetime relation dependent on the metallicity (Raiteri et al., 1996). No instantaneous recycling approximation has been implemented.
We search for the SFH that best fits the [/Fe]-Age relation (in this case the alpha element used is the Silicon), rather than [/Fe]-[Fe/H], as is usually done. Our main reason for doing this is that different star formation histories can produce similar chemical [/Fe]-[Fe/H] tracks, thus the solution is degenerate in this plane, without age information. Moreover, the evolutionary [/Fe]-[Fe/H] track of the thin disc being very limited (Haywood et al., 2013), it is not possible to use this sequence to constrain its detailed evolution.
In practice, at t = 0, the system contains a pristine gas of mass 1. For each time step the code looks at the provided SFH and calculates the amount of mass that is converted from the ISM into stars and subtracts it from the ISM. The mass of O, Mg, Fe, Si, H, corresponding to the abundance of the ISM at that time is also removed from the ISM and used to calculate the metallicity of the stellar population.
The code then looks at the stars created in every previous time step and calculates the amount of gas and metals that is returned to the ISM. This is done by interpolating the cumulative yields produced for all stars at the end of their lives and taking into account the metallicity of the star at its formation. This mass is then added to the ISM and the fraction of recycled gas is removed from the star and returned to the gas component. A chemical track is finally generated resulting from this particular SFH, and fitted to the data through a approach, using the difference between the model value of [Si/Fe] at the age of each star in the data and the observed [Si/Fe]. The data is fitted iteratively. At each iteration an entire SFH is created and the chemical evolution code is used to calculate the corresponding chemical track. The algorithm requires an initial guess SFH and a user supplied convergence criterion. A series of best fits are found by bootstraping the sample, and these best fits are averaged in order to smooth the SFH (see Snaith et al. (2014) for a detailed description).
4. Results
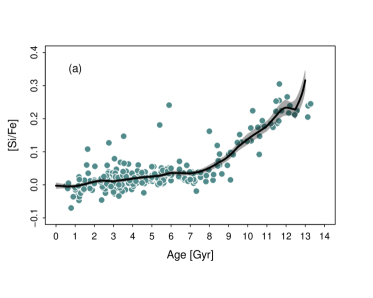
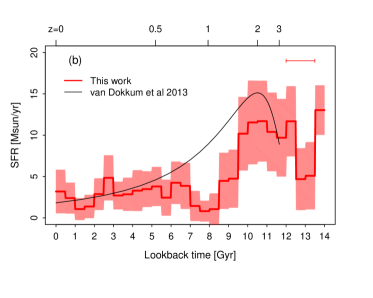
The result of the fitting procedure to the Age-Silicon data is given in Fig. 2(a), with the corresponding
SFH in Fig. 2(b). The star formation obtained suggests that:
(1) the Galaxy underwent an intense phase
of star formation between 9 and 13 Gyr ago, during the formation of the thick disc. At those epochs, the SFR peaked at 3–4 times the value characterising the subsequent thin disc formation phase;
(2) this intense SF phase lasted 4 Gyr and produced about as much mass in stars as that produced in the following 8 Gyr, during the
thin disc formation (Fig. 2(c)). In other words, the thick disc of the Galaxy is about as
massive as the thin disc (in agreement with recent mass estimates
using structural parameters, see Sect. 5.1);
(3) the estimated SFH shows a distinct dip at 8-9 Gyr. A statistical analysis (Snaith et al.,
2014) indicates that this dip is robust, and implies that the end of the thick disc formation
phase is marked by a decrease in the star formation.
A caveat must be added. As mentioned in the introduction, although our sample is local (100pc), as long as the analysis is based on stars with sufficiently large and different eccentricities, the recovered SFH is non-local, and is valid for the whole population. While this is true for the thick disc, it becomes less correct for younger stars that have orbits more confined to the solar circle. In this respect, it is difficult to ascertain if the dip in the SFR at 7-9 Gyr is a local feature or not. Reciprocally, stars that avoid the solar circle will not be represented in the Age-abundance plane, and not taken into account in the reconstructed SFH. From that point of view, our position, at the limit between the inner and outer discs, has an advantage: the solar vicinity is a fair sampling of all known populations of the disc, while we know that the inner disc lacks the metal-poor thin disc stars, and the outer disc lacks both the metal-rich alpha-poor thin disc and the alpha-rich metal-poor thick disc.
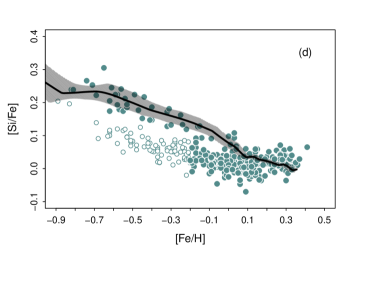
Finally, it is interesting to show the chemical evolution in the [Si/Fe]-[Fe/H] plane generated by the recovered SFH. This is done in Fig. 2(d), which illustrates the [Si/Fe]-[Fe/H] chemical track of the model that results from averaging individual [Si/Fe]-[Fe/H] tracks. Each of these tracks has been derived using the best fit SFH solution obtained by fitting the Age-[Si/Fe] relation through bootstraping the data. It is striking to see that, even if the model has not been designed to fit this relation, the obtained chemical tracks describe very well the thick disc sequence. In contrast, the thin disc is less well described, as expected, since the mean [/Fe] and metallicity vary very little during the thin disc phase, while the dispersion in metallicity is very large at any given age (or [/Fe]), due to the position of the Sun at the transition between the inner metal-rich and the outer metal-poor discs.
Overall, the recovered SFH allows us to match, at the same time, the Age-[Si/Fe] and the [Si/Fe]-[Fe/H] relations, thus guaranteeing that it is a robust description of the chemical evolution of stars observed today at the solar vicinity.
5. Discussion
5.1. The thick disc mass
These results lead to a fundamental revision of the role played by the thick disc in galactic evolution, as already suggested by Bernkopf et al. (2001), and more recently, Fuhrmann (2011); Fuhrmann et al. (2012). With the recent recognition that our MW’s stellar mass is dominated by its disc - the contribution of the central spheroidal component being 10% at most (Shen et al., 2010; Kunder et al., 2012; Di Matteo et al., 2013) - the thick disc is arguably the dominant old stellar population of the MW.
The most recent thick disc scale length measurements (Bovy et al., 2012; Bensby et al., 2011, but see Jayaraman et al. (2013)) show that this population has a much shorter scale length than previously thought, of about 2.0 kpc, while the thin disc scale length is 3.6 kpc. From the stellar surface densities derived from the SEGUE survey data (Bovy et al., 2012), and assuming that the thick and thin discs separate at [/Fe]=0.25 dex (on the SEGUE scale, Bovy et al., 2012), the thin disc contributes to 21 M⊙.pc-2 to the local stellar surface density, and the thick disc to 8 M⊙.pc-2. Correcting for the scale length effect assuming the values just quoted, we find that the thick disc represents 47% of the stellar mass within 10 kpc of the galactic centre, in accordance with estimates from the SFH given here.
In other words, the stellar population responsible for the increase of the metallicity in the Galaxy from halo to thin disc values is massive (see also Fuhrmann et al., 2012, for a similar conclusion), and essentially concentrated in the inner Galaxy. This is confirmed by the first APOGEE results (Anders et al., 2013, Fig. 14), where it is shown that the MDF for stars with median galactocentric radii between 4 and 7 kpc has a mode at [Fe/H] -0.2 dex, with roughly equal amount of stars above and below this value. Interestingly, the distribution of alpha abundance as a function of metallicity given in this same plot shows that below [Fe/H]-0.2 dex, most stars are alpha-enhanced, meaning that they are thick disc objects.
5.2. The G-dwarf problem and the accretion history of the Galaxy
As well as a major contributor to the total mass budget of the Galaxy, the thick disc also produced as much metals as the thin disc in the following 8 Gyr of galactic evolution.
This role has been largely over-looked in chemical evolution models of our Galaxy (all models based on long term infall, e.g. Naab & Ostriker, 2006; Schönrich & Binney, 2009; Micali et al., 2013), which were built on the assumption of an apparent lack of intermediate metallicity disc stars in the Galaxy - the so-called G-dwarf problem (van den Bergh, 1962) - simply because these stars are poorly represented in the solar neighbourhood. A consequence is that Galactic chemical evolution models so far have underestimated the importance of this population, leading to a biased view of Galactic evolution. The G-dwarf problem as such vanishes because (1) the local metallicity distribution function (MDF) is strictly local and cannot be used to constrain models that aim to give a general description of the chemical evolution of the discs-4-4-4This is applicable when comparing the (relative) frequency of stars of local samples to models that are designed to describe the chemical evolution of the entire disc. Our sample is local as well, but we use variations of metallicities and abundances as a function of age in our derivation of the SFH, not their number densities. and (2) stars of intermediate metallicities are in fact largely present in the Galaxy and correspond to the thick disc.
This is of crucial importance also for the long-term evolution of the Galaxy, since it alleviates the need for prolonged infall onto the inner (10 kpc) disc over the last 8 Gyr. Over this period, the MW may have sustained its star formation from the gas not consumed during the thick disc formation epoch and by recycling the mass lost from disc stars (Leitner & Kravtsov, 2011).
Such a picture is not in accordance with models of galaxy formation. We find here that there may have been a period of intense accretion very early in the history of the Galaxy but, after that, the MW may have evolved mostly by reprocessing the material lost from stars, and by consuming the gas left at the end of the thick disc formation phase. There is very little need for significant cosmological gas accretion beyond the early phases of the MW formation. This may call for a substantial revision of our galaxy evolution models, which suggest that slow, long-term accretion of nearly primordial gas is continuously needed in the disc (Naab & Ostriker, 2006; Schönrich & Binney, 2009; Micali et al., 2013; Fraternali, 2013).
Note that these results are derived from inner disc stars, and are not applicable to the outer disc, which could have followed a different chemical evolution (Haywood et al., 2013) resulting from a mixture of gas ejected by outflows from the forming thick disc, and pristine accreted gas. In this picture, it is expected that the first (z2) gas accretion phase mainly fuels the building of the inner regions of the disc, while significant accretion may continue in the outer regions afterwards.
5.3. The extragalactic context
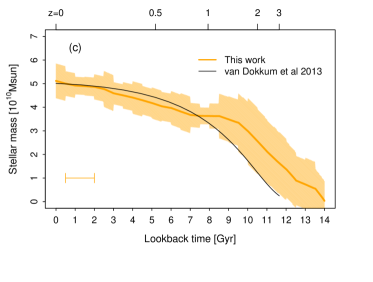
The evolution of our Galaxy derived from these results fits well with observational studies of distant galaxies, which indicate that MW progenitors assembled more than half of their stellar mass within 5 Gyr after the Big Bang (Leitner, 2012; van Dokkum et al., 2013; Muzzin et al., 2013; Patel et al., 2013). Figure 4 (panels (b) and (c)) illustrates the evolution of the SFR and cumulative stellar mass as a function of age compared to the one obtain by van Dokkum et al. (2013) for Milky Way-type progenitors at different redshifts. Given possible systematic effects in the age scale, good qualitative agreement is obtained between these estimates and our recovered SFH from solar vicinity data. These direct observations, together with the properties of local disc galaxies, which do not show any presence of substantial old, classical spheroids (Kormendy et al., 2010; Fisher & Drory, 2010), suggest that the stellar mass formed at these early epochs was likely in thick discs. Moreover, spectroscopic observations of distant galaxies show that their discs have high velocity dispersions in their gas, similar to that measured in the present stellar thick disc of the MW (Swinbank et al., 2011; Lehnert et al., 2013). For these reasons, the formation of the thick stellar disc is a fundamental part of the formation of the MW, and disc galaxies generally.
6. Conclusions
We have presented the first robust measurement of the MW star formation history using the imprint left on chemical abundances of long-lived stars at the solar vicinity. Our results show that the thick disc formed coincident with the maximum star formation activity in the Universe, between 12.5 and 9 Gyr ago, and play a fundamental role in the chemical evolution of the Galaxy, as well as in its global mass budget.
The implication of these results are far reaching. Firstly, although we have no direct clue of what would be a MDF representative of the entire disc, the fraction of stars of intermediate metallicity is significantly higher than described by the local MDF. A simple closed-box MDF with a maximum at [Fe/H]-0.1 dex has a median at [Fe/H]-0.3 dex, which is about the metallicity transition between the thick and thin discs (see the age-metallicity relation in Haywood et al. (2013)), and this is in accord with the equal mass balance measured here between the two discs. It suggests that the simple closed-box may be a good first order model to describe the chemical evolution of the discs. Secondly, the difference in scale length between the two discs, if confirmed, implies that the solar vicinity MDF is strictly local and cannot be used as it is to infer a general chemical evolution of the Galactic disc. Thirdly, these results suggest that large amounts of gas must have been available early in the Galaxy to sustain the formation of the thick disc, adding support to the choice of adopting a closed-box model to approximate its chemical evolution. We find that there may have been a period of intense accretion very early in the history of the Galaxy, and that, by z1, the MW may have evolved mostly by reprocessing the material lost from stars, and by consuming the gas left at the end of the thick disc formation phase. This finding is at odds with current galaxy evolution models, which suggest that slow, long-term accretion of nearly primordial gas is continuously needed in the MW disc to sustain its star formation.
References
- Adibekyan et al. (2012) Adibekyan, V. Z., Sousa, S. G., Santos, N. C., et al. 2012, A&A, 545, A32
- Anders et al. (2013) Anders, F., Chiappini, C., Santiago, B. X., Rocha-Pinto, H. J., Girardi, L. et al. astro-ph/1311.4549
- Bensby et al. (2011) Bensby, T., Alves-Brito, A., Oey, M. S., Young, D. & Melendez, J. 2011, ApJL, 735, 46
- Bernkopf et al. (2001) Bernkopf, J., Fidler, A., & Fuhrmann, K. 2001, Astrophysical Ages and Times Scales, 245, 207
- Bovy et al. (2012) Bovy, J., Rix, H.-W., Hogg, D. W., et al. 2012, ApJ, 755, 115
- Bovy et al. (2012) Bovy, J., Rix, H.-W., Liu, C., et al. 2012, ApJ, 753, 148
- Dekel et al. (2009) Dekel, A., Birnboim, Y., Engel, G., et al. 2009, Nature, 457, 451
- Di Matteo et al. (2013) Di Matteo, P., Haywood, M., Gomez, A., et al., submitted A&A
- Elmegreen et al. (2007) Elmegreen, D. M., Elmegreen, B. G., Ravindranath, S., & Coe, D. A. 2007, ApJ, 658, 763
- Fisher & Drory (2010) Fisher, D. B., & Drory, N. 2010, ApJ, 716, 942
- Fraternali (2013) Fraternali, F. 2013, IAU Symposium 298, eds S. Feltzing, G. Zhao, N.A. Walton & P.A. Whitelock; arXiv:1310.2956
- Fuhrmann et al. (2012) Fuhrmann, K., Chini, R., Hoffmeister, V. H., & Bernkopf, J. 2012, MNRAS, 420, 1423
- Fuhrmann (2011) Fuhrmann, K. 2011, MNRAS, 414, 2893
- Genzel et al. (2008) Genzel, R., Burkert, A., Bouché, N., et al. 2008, ApJ, 687, 59
- Haywood et al. (2013) Haywood, M., Di Matteo, P., Lehnert, M., Katz, D., & Gómez, A. 2013, A&A, 560, A109
- Hopkins & Beacom (2006) Hopkins, A. M., & Beacom, J. F. 2006, ApJ, 651, 142
- Iwamoto et al. (1999) Iwamoto, K., Brachwitz, F., Nomoto, K., et al. 1999, ApJS, 125, 439
- Jayaraman et al. (2013) Jayaraman, A., Gilmore, G., Wyse, R. F. G., Norris, J. E., & Belokurov, V. 2013, MNRAS, 431, 930
- Karakas (2010) Karakas, A. I. 2010, MNRAS, 403, 1413
- Kereš et al. (2009) Kereš, D., Katz, N., Davé, R., Fardal, M., & Weinberg, D. H. 2009, MNRAS, 396, 2332
- Kereš et al. (2005) Kereš, D., Katz, N., Weinberg, D. H., & Davé, R. 2005, MNRAS, 363, 2
- Kormendy et al. (2010) Kormendy, J., Drory, N., Bender, R., & Cornell, M. E. 2010, ApJ, 723, 54
- Kroupa (2001) Kroupa, P. 2001, MNRAS, 322, 231
- Kunder et al. (2012) Kunder, A., Koch, A., Rich, R. M., et al. 2012, AJ, 143, 57
- Leitner (2012) Leitner, S. N. 2012, ApJ, 745, 149
- Leitner & Kravtsov (2011) Leitner, S. N., & Kravtsov, A. V. 2011, ApJ, 734, 48
- Lehnert et al. (2013) Lehnert, M. D., Le Tiran, L., Nesvadba, N. P. H., et al. 2013, A&A, 555, A72
- Madau et al. (1996) Madau, P., Ferguson, H. C., Dickinson, M. E., et al. 1996, MNRAS, 283, 1388
- Micali et al. (2013) Micali, A., Matteucci, F., & Romano, D. 2013, MNRAS, 436, 1648
- Muzzin et al. (2013) Muzzin, A., Marchesini, D., Stefanon, M., et al. 2013, ApJ, 777, 18
- Naab & Ostriker (2006) Naab, T., & Ostriker, J. P. 2006, MNRAS, 366, 899
- Nomoto et al. (2006) Nomoto, K., Tominaga, N., Umeda, H., Kobayashi, C., & Maeda, K. 2006, Nuclear Physics A, 777, 424
- Patel et al. (2013) Patel, S. G., van Dokkum, P. G., Franx, M., et al. 2013, ApJ, 766, 15
- Raiteri et al. (1996) Raiteri, C. M., Villata, M., & Navarro, J. F. 1996, A&A, 315, 105
- Schönrich & Binney (2009) Schönrich, R., & Binney, J. 2009, MNRAS, 396, 203
- Shen et al. (2010) Shen, J., Rich, R. M., Kormendy, J., et al. 2010, ApJ, 720, L72
- Swinbank et al. (2011) Swinbank, A. M., Papadopoulos, P. P., Cox, P., et al. 2011, ApJ, 742, 11
- Tinsley (1980) Tinsley, B. M. 1980, Fund. Cosmic Phys., 5, 287
- van den Bergh (1962) van den Bergh, S. 1962, AJ, 67, 486
- van Dokkum et al. (2013) van Dokkum, P. G., Leja, J., Nelson, E. J., et al. 2013, ApJ, 771, L35