transition in cerium: magnetic form factor and dynamic magnetic susceptibility in dynamical mean-field theory
Abstract
The nature of the elemental cerium phases, undergoing an isostructural volume collapse transition, cannot be understood using conventional solid state concepts. Using the combination of density functional theory and dynamical mean-field theory, we study the magnetic properties of both the and the phases. We compute the magnetic form factor, and show that it is very close to free ion behavior in both the local moment phase as well as the more itinerant phase, in agreement with neutron scattering experiments. In sharp contrast, the dynamic local magnetic susceptibility of the two phases is strikingly different. In the phase, the sharp low energy peak due to local moment formation and consequently low Kondo temperature dominates the spectra. In the phase two broad peaks can be identified, the first is due to Kondo screening, and the second is due to Hund’s coupling. This shows that hybridization plays a central role in the transition in cerium, and that from the point of view of magnetic properties, the electrons are strongly correlated in both phases.
pacs:
71.27.+a, 71.30.+hThe physical mechanism driving the - phase transition has puzzled physicists for many years Koskenmaki and K.A. Gschneidner (1978). Similar to other elements, the temperature versus pressure phase diagram of cerium shows multiple structural transitions, where the symmetry of the structure changes across the phase transition. The - transition is exceptional because it is isostructural, i.e. the atoms retain their ordering in an structure while the volume collapses by 15 from to phase upon increasing pressure. Moreover, the transition is accompanied by a dramatic change in the magnetic susceptibility: the phase shows Pauli-like susceptibility, while the phase has Curie-like susceptibility. Therefore, most of the theoretical work has focused on the hypothesis that electronic effects are responsible for the transition.
Numerous theoretical models were proposed to explain the isostructural transition in Ce. For example, in the promotional model Coqblin and Blandin (1968), the electrons are localized in the phase, and are promoted to the conduction band in the phase. However photoemission spectroscopy shows little change in the number of the conduction electrons at the transition. Johansson proposed Johansson (1974) that the transition is an example of a Mott transition. Here the electrons undergo a Mott transition, from a non-bonding localized state in the phase to a narrow band in the phase, which participates in bonding. The electrons remain bystanders during the transition. Upon increasing pressure, a localization-delocalization transition occurs with a subsequent loss of moment and decrease of volume. In this model, the electron number remains almost unchanged with pressure, so this feature is consistent with photoemission results. A different scenario was proposed by Lavagna et al. Lavagna et al. (1982) and Allen Allen and Martin (1982), dubbed the Kondo volume collapse theory. Here the electrons are not bystanders as in the Mott scenario. Instead the transition is connected to the change in the effective hybridization (and thus the Kondo scale) of the electrons with the electrons and so there is a decrease in volume due to the increase of the Kondo temperature .
Dynamical mean-field theory (DMFT) Georges et al. (1996) is a modern tool to understand the physics of strong electron correlations. The combination of density functional theory (DFT) and DMFT Kotliar et al. (2006); Haule et al. (2010) (DFT+DMFT) allows one to consider structural effects, electronic effects and the physics of strong correlations from first-principles. It brings the physics of f-electron delocalization and f-spd hybridization into a unified framework. As a result of many studies over several years, different aspects of the transition have been considered, including changes in the density of states Zölfl et al. (2001); Held et al. (2001); McMahan et al. (2003), in the optical conductivity Haule et al. (2005), and in the thermodynamic properties Amadon et al. (2006); Lanatà et al. (2013).
From the theoretical point of view, the magnetic properties of the volume collapse transition have not been adequately addressed so far. The static local and the uniform magnetic susceptibility was computed in Ref. Streltsov et al., 2012 using charge non-self-consistent DFT+DMFT, but the local susceptibility turned out to be similar in both phases and the magnetic susceptibility was underestimated due to negligence of spin orbit coupling, which was shown to be crucial for proper description of - transition in cerium Lanatà et al. (2013). As shown in this letter, the orbital moment dominates the magnetic moment in cerium, and is quenched when spin-orbit coupling is neglected. Recently, compelling neutron scattering experiments Murani et al. (2005) were performed, which call for theoretical analysis. Here we shall revisit the transition from the point of view of magnetic properties by computing the magnetic form factor , the local dynamic susceptibility and the magnetic spectral response . We shall show that the magnetic form factor shows free ion behavior in both phases, indicating that from the point of view of magnetic properties, the electrons are strongly correlated both in the and phases. The dynamic magnetic susceptibility of the two phases is very different. It shows a sharp low energy peak at the characteristic energy, which scales with the coherence temperature of each phase. Since the coherence scale is directly connected with the strength of hybridization, this suggests that the hybridization plays a central role in the transition in cerium.
Model and method.– In this Letter, we have performed DMFT+DFT calculations in a charge self-consistent implementation Haule et al. (2010). For the Kohn-Sham potential, we used the GGA functional as implemented in Wien2k package Blaha et al. (2001), and continuous-time quantum Monte Carlo (CTQMC) method to solve the auxiliary impurity problem Haule (2007). We used Hubbard repulsion eV, Hund’s coupling eV, and temperature . The lattice constants of the unit cell are and for the and phases respectively.
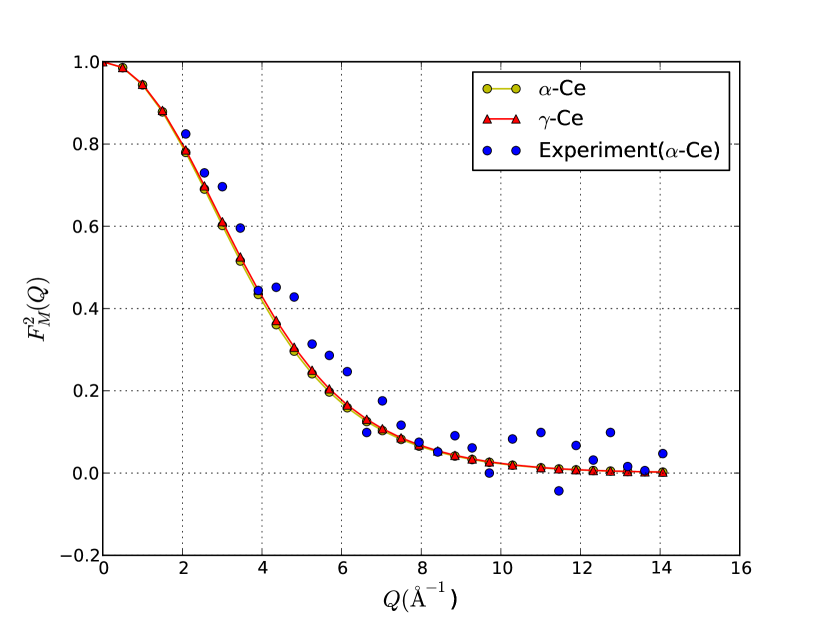
Magnetic form factor.– The magnetic form factor is the Fourier transform of the spatial distribution of the electronic magnetic moment, here mostly contributed by electrons. Thus it is an ideal observable for determining the nature of the electrons. In particular, the magnetic form factor can determine whether electrons are localised or itinerant, as suggested in Ref. Hjelm et al., 1994. The idea is the following: band formation results in the quenching of the magnetic moment, especially the orbital component relative to the spin component. Thus, if the volume collapse is due to a localisation-to-delocalisation transition, there should be a dramatic change between the shape of the magnetic form factor between the and phases. For cerium, the measured magnetic form factor has free ion behavior, which is in good agreement with the computed ionic Ce3+ magnetic form factor Stassis et al. (1978). On the other hand, for the cerium, electronic structure calculations predict metal-like behavior for the magnetic form factor Hjelm et al. (1994). However, these calculations are in striking contrast with recent high-energy neutron inelastic measurements by Murani et al. Murani et al. (2005), which show free ion behaviour for the magnetic form factor of cerium as well.
| -Ce | -Ce | |
|---|---|---|
| -0.03468 | ||
| 0.13841 | ||
| 1.327 | 1.334 |
Following the formalism described in Ref. Pezzoli et al., 2011, we compute the magnetic form factor within the DFT+DMFT framework. Figure 1 shows the magnetic form factor squared in presence of an external magnetic field for both and cerium. The curves are close to each other and display free ion behavior, typical of a correlated state. This is a consequence of the electron-electron Coulomb repulsion, and cannot be captured solely by electronic band structure effects. Our results are in good agreement with the measured magnetic form factor of cerium of Ref. Murani et al. (2005), and show that electronic structure calculations, when combined with the dynamical mean-field theory, have the predictive power to capture the magnetic response of the electrons, and therefore to reconcile theory and neutron scattering experiment.
To gain a deeper understanding of these results, we resort to dipole approximation, , where is the spatial average of the spherical Bessel function over the atomic cerium wave function , is the total (spin plus orbital) magnetic moment, and . As shown in Table 1, and have opposite sign because of third atomic Hund’s rule (that is because of spin-orbit coupling and ), and , thus . The coefficient determines the shape of and remains basically unchanged across the transition. It is close to the one expected for a free Ce3+ ion, implying that there is a localised electronic density for both and cerium.
Local dynamic magnetic susceptibility.– The magnetic form factor indicates that both and phase are strongly correlated phases, which is compatible with both Mott and Kondo volume collapse scenarios, but eliminates the promotional model. In the Mott scenario, the two phases are correlated because they lie on slightly opposite sides of the delocalisation-localisation transition, while in the Kondo volume collapse picture, the two phases are correlated because the electron moment remains stable across the transition. However, the Kondo volume collapse scenario differs from the Mott scenario because it does not consider the electrons to be mere bystanders, but emphasizes their role in the screening of the local magnetic moments, via the Kondo effect. Therefore, the dynamic magnetic susceptibility, which measures the spatial and temporal distribution of the magnetic fluctuations, can indicate whether the hybridization plays a key role at the transition.
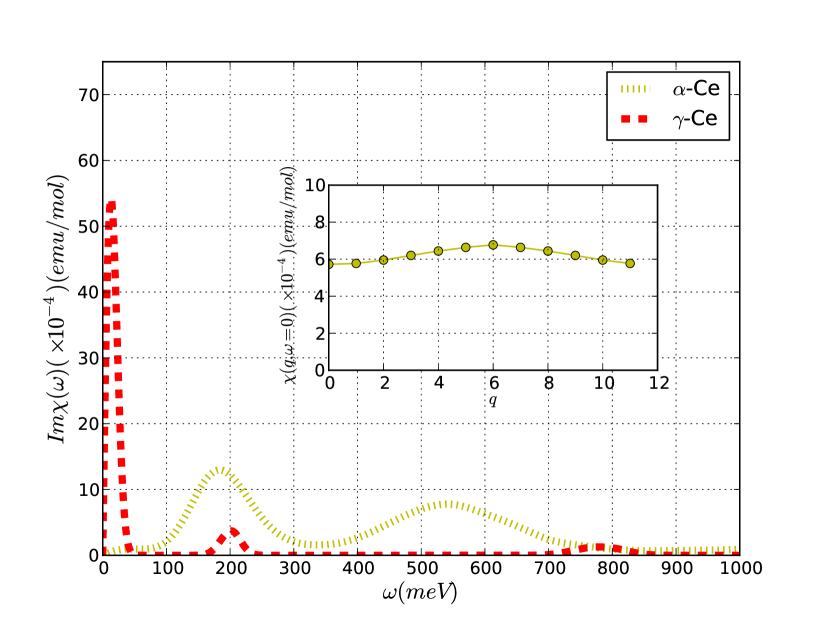
In our calculations, we used the CTQMC impurity solver to obtain the local dynamic susceptibility of and cerium as a function of Matsubara frequencies. We then analytically continued the data using maximum entropy method to obtain Im along the real frequency axis. In Figure 2 we show Im for both phases. At small frequencies, Im for cerium shows a narrow and intense magnetic peak centered at approximately 10 meV. This feature has to be expected from the local moment character of electrons in cerium. The position of this peak gives a measure of the Kondo temperature . For cerium, this peak shifts to higher frequency, around 180 meV. Thus, in going from to phase, there is a shift of magnetic intensity from low to high energy, signalling a change (precisely, an increase) in . This is one of the central results of our work. We emphasize that, at large frequencies, the overall intensity of Im in the phase is larger than in the phase, reflecting the increased hybridization of electrons in the former phase.
In order to ascertain the nature of the different peaks in the dynamic susceptibility of cerium, we performed simulations of the phase with different values of spin-orbit coupling (not shown). Upon increasing spin-orbit coupling, the peak at low frequency (meV) moves towards . This is a feature of the fact that by increasing the spin-orbit coupling, the effective Kondo temperature of the system is reduced. Hence this peak is a feature of the Kondo coherence energy of the system. This trend has to be expected because of the hybridisation between the conduction electrons and the f electrons. By increasing the spin orbit coupling, the energy splitting between the and states increases, therefore fluctuations are hampered and states are less occupied. It follows that the hybridisation with conduction electrons decreases as well. The importance of the spin-orbit coupling has also been emphasized in the cerium compounds CeIn3-xSnx and CePd3 Murani et al. (1993, 1996); Bickers et al. (1987).
The second peak (meV) however does not show sensitivity to the spin-orbit coupling. To further ascertain the origin of the second peak, we performed simulations with altered values of Hunds Coupling (not shown). The second peak is always roughly centred at indicating that it represents an excitation of the the f-electrons in the (non-zero) doubly occupied sector of f-electron occupancy.
Notice that to crosscheck the validity of our analytic continuation procedure, we benchmarked our results against a well-known sum rule for Im. It is known that where is the Bose distribution function and is the magnetic moment along the z axis, which can be independently extracted in our simulation without need of analytic continuation. A good quantitative agreement is obtained in both phases.
In addition, we have verified that the local dynamical susceptibility is a good representative of the behavior of the susceptibility within the first Brillouin zone. This is important, because it verifies the so-called ”single-ion form factor dependence” often used to analize experimental data Murani et al. (2005), where the dynamical structure is factorized into momentum dependent form factor , and energy dependent structure factor Im, i.e, . To verify the quality of this approximation, we have computed the static susceptibility of cerium within the first Brillouin zone using a two particle vertex method, developed in Ref. Park et al., 2011. We calculate using the Bethe-Salpeter equation , where is the two particle irreducible vertex, which we sample within DMFT, and is the RPA susceptibility, which we compute using the full k-dependent LDA+DMFT green’s function. Note that within DMFT, the two particle irreducible vertex is local. The inset of Figure 2 shows . We can see that there is no significant variation in the static susceptibility within the first Brillouin zone, which validates the ”single-ion form factor formula”.
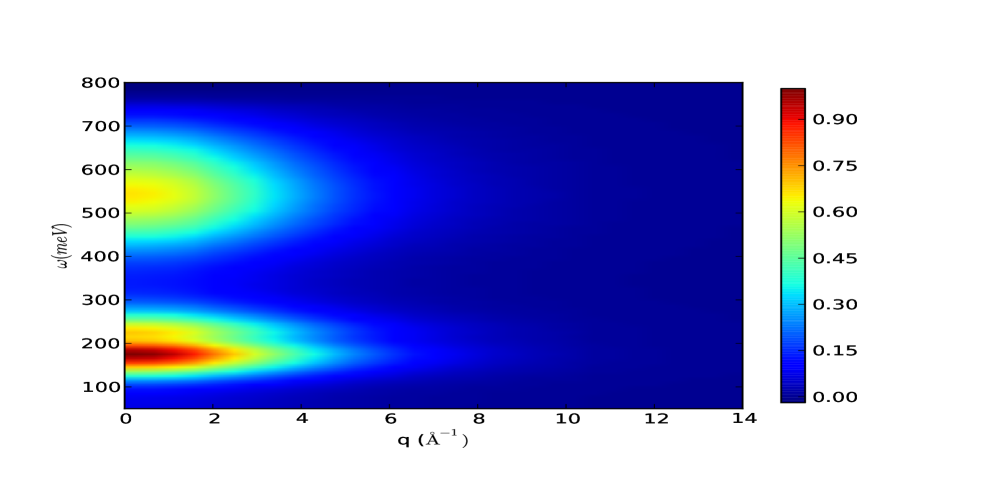
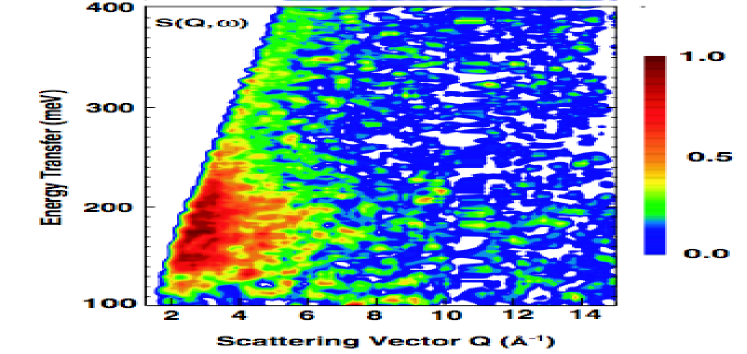
Magnetic spectral response.– We then use this formula to compute frequency dependent of both phases. Figure 3 shows the difference between the and magnetic spectral response (). In the lower panel we show the experimental spectrum Murani et al. (2005). There is a good agreement between the two, particularly in the position of the broad peak assigned to the Kondo screening in the -phase. Note that the spectrum displayed in Fig. 3 becomes negative in the low energy region where -Ce susceptibility has sharp peak due to local moment character (see Fig. 2). This region has been left out of theoretical (as well as experimental) plot so as to enable better visualization of the other features.
In summary, we showed theoretically that the neutron magnetic form factor has a free ion behaviour in both phases, indicating that the electrons remain strongly correlated across the - transition. On the other hand, the local dynamical susceptibility and the magnetic spectrum show dramatic changes across the transition, with an energy shift from lower to higher frequencies, a direct consequence of the increase of the Kondo temperature in the cerium. Therefore, our data shows that the physics of the volume collapse - transition in cerium is controlled by the hybridization between the localised and the electrons and also establishes the importance of using different probes and observables to understand different aspects of the volume collapse transition in cerium.
Acknowledgment.– M.E.P. and G.S. thank A. Murani for enlightening discussions. This work was partially supported by NSF DMR-0746395 (K.H.) and and DE-FG02-99ER45761(G.K)
References
- Koskenmaki and K.A. Gschneidner (1978) D. Koskenmaki and J. K.A. Gschneidner, Cerium, Handbook on the Physics and Chemistry of Rare Earths, Vol 1, KA. Gschneidner, Jr. and L. Eyring, Ed. (Elsevier, North-Holland, Amsterdam, 1978).
- Coqblin and Blandin (1968) B. Coqblin and A. Blandin, Advan. Phys. p. 281 (1968).
- Johansson (1974) B. Johansson, Philosophical Magazine. 30, 469 (1974).
- Lavagna et al. (1982) M. Lavagna, C. Lacroix, and M. Cyrot, Physics Letters A 90, 210 (1982), ISSN 0375-9601, URL http://www.sciencedirect.com/science/article/B6TVM-46SNMSW-1CT/2/aa5d5f284d9aa0dc3de3381ab6bd7d0d.
- Allen and Martin (1982) J. W. Allen and R. M. Martin, Phys. Rev. Lett. 49, 1106 (1982), URL http://link.aps.org/doi/10.1103/PhysRevLett.49.1106.
- Georges et al. (1996) A. Georges, G. Kotliar, W. Krauth, and M. J. Rozenberg, Rev. Mod. Phys. 68, 13 (1996), URL http://link.aps.org/doi/10.1103/RevModPhys.68.13.
- Kotliar et al. (2006) G. Kotliar, S. Y. Savrasov, K. Haule, V. S. Oudovenko, O. Parcollet, and C. A. Marianetti, Rev. Mod. Phys. 78, 865 (2006), URL http://link.aps.org/doi/10.1103/RevModPhys.78.865.
- Haule et al. (2010) K. Haule, C.-H. Yee, and K. Kim, Phys. Rev. B 81, 195107 (2010), URL http://link.aps.org/doi/10.1103/PhysRevB.81.195107.
- Zölfl et al. (2001) M. B. Zölfl, I. A. Nekrasov, T. Pruschke, V. I. Anisimov, and J. Keller, Phys. Rev. Lett. 87, 276403 (2001), URL http://link.aps.org/doi/10.1103/PhysRevLett.87.276403.
- Held et al. (2001) K. Held, A. K. McMahan, and R. T. Scalettar, Phys. Rev. Lett. 87, 276404 (2001), URL http://link.aps.org/doi/10.1103/PhysRevLett.87.276404.
- McMahan et al. (2003) A. K. McMahan, K. Held, and R. T. Scalettar, Phys. Rev. B 67, 075108 (2003), URL http://link.aps.org/doi/10.1103/PhysRevB.67.075108.
- Haule et al. (2005) K. Haule, V. Oudovenko, S. Y. Savrasov, and G. Kotliar, Phys. Rev. Lett. 94, 036401 (2005), URL http://link.aps.org/doi/10.1103/PhysRevLett.94.036401.
- Amadon et al. (2006) B. Amadon, S. Biermann, A. Georges, and F. Aryasetiawan, Phys. Rev. Lett. 96, 066402 (2006), URL http://link.aps.org/doi/10.1103/PhysRevLett.96.066402.
- Lanatà et al. (2013) N. Lanatà, Y.-X. Yao, C.-Z. Wang, K.-M. Ho, J. Schmalian, K. Haule, and G. Kotliar, Phys. Rev. Lett. 111, 196801 (2013), URL http://link.aps.org/doi/10.1103/PhysRevLett.111.196801.
- Streltsov et al. (2012) S. V. Streltsov, E. Gull, A. O. Shorikov, M. Troyer, V. I. Anisimov, and P. Werner, Phys. Rev. B 85, 195109 (2012), URL http://link.aps.org/doi/10.1103/PhysRevB.85.195109.
- Murani et al. (2005) A. P. Murani, S. J. Levett, and J. W. Taylor, Phys. Rev. Lett. 95, 256403 (2005).
- Blaha et al. (2001) P. Blaha, K. Schwarz, G. K. H. Madsen, D. Kvasnicka, and J. Luitz, WIEN2K, An Augmented Plane Wave + Local Orbitals Program for Calculating Crystal Properties (Karlheinz Schwarz, Techn. Universität Wien, Austria, 2001).
- Haule (2007) K. Haule, Phys. Rev. B 75, 155113 (2007), URL http://link.aps.org/doi/10.1103/PhysRevB.75.155113.
- Hjelm et al. (1994) A. Hjelm, J. Trygg, O. Eriksson, B. Johansson, and J. Wills, Phys. Rev. B 50, 4332 (1994), URL http://link.aps.org/doi/10.1103/PhysRevB.50.4332.
- Stassis et al. (1978) C. Stassis, C.-K. Loong, G. Kline, O. McMasters, and K. Gschneider, J. Appl. Phys. 49, 2113 (1978).
- Pezzoli et al. (2011) M. E. Pezzoli, K. Haule, and G. Kotliar, Phys. Rev. Lett. 106, 016403 (2011), URL http://link.aps.org/doi/10.1103/PhysRevLett.106.016403.
- Murani et al. (1993) A. P. Murani, A. D. Taylor, R. Osborn, and Z. A. Bowden, Phys. Rev. B 48, 10606 (1993), URL http://link.aps.org/doi/10.1103/PhysRevB.48.10606.
- Murani et al. (1996) A. P. Murani, R. Raphel, Z. A. Bowden, and R. S. Eccleston, Phys. Rev. B 53, 8188 (1996), URL http://link.aps.org/doi/10.1103/PhysRevB.53.8188.
- Bickers et al. (1987) N. E. Bickers, D. L. Cox, and J. W. Wilkins, Phys. Rev. B 36, 2036 (1987), URL http://link.aps.org/doi/10.1103/PhysRevB.36.2036.
- Park et al. (2011) H. Park, K. Haule, and G. Kotliar, Phys. Rev. Lett. 107, 137007 (2011), URL http://link.aps.org/doi/10.1103/PhysRevLett.107.137007.