Hubble Space Telescope detection of the double pulsar system J07373039 in the far-ultraviolet
Abstract
We report on detection of the double pulsar system J07373039 in the far-UV with the ACS/SBC detector aboard HST. We measured the energy flux erg cm-2 s-1 in the 1250–1550 Å band, which corresponds to the extinction-corrected luminosity erg s-1 for the distance kpc and a plausible reddening . If the detected emission comes from the entire surface of one of the neutron stars with a 13 km radius, the surface blackbody temperature is in the range – K for a reasonable range of interstellar extinction. Such a temperature requires an internal heating mechanism to operate in old neutron stars, or it might be explained by heating of the surface of the less energetic Pulsar B by the relativistic wind of Pulsar A. If the far-UV emission is non-thermal (e.g., produced in the magnetosphere of Pulsar A), its spectrum exhibits a break between the UV and X-rays.
1 Introduction
Double Neutron Star Binaries (DNSBs) are very rare objects (currently, 8 DNSBs are known) thought to be formed in consequent supernova explosions in the course of evolution of a massive binary system (e.g., Stairs et al. 2004). It is generally believed that once the first neutron star (NS) is formed and the second star evolves further, it starts to transfer matter onto the primary NS. The accretion results in a spin-up of the NS, which becomes a millisecond (recycled) pulsar. At some point the second star explodes as a supernova and, if the explosion does not disrupt the binary or disintegrate the second star, a DNSB is formed.
J07373039 (J0737 hereafter) is the only known example of a DNSB system in which both NSs have been detected as pulsars (Lyne et al. 2004). Observations of DSNBs in general are of great importance since they allow one to accurately measure the masses of both NSs and test the predictions of General Relativity (GR) or other models of gravity. Having two precise clocks orbiting each other in a tight binary and the fortuitous viewing angle, nearly edge-on (inclination angle ) greatly improves the precision and expands the number of potentially measurable quantities (e.g., the NS moment of inertia and higher-order terms in GR); see Kramer & Stairs (2008) for a review. In addition to the radio timing, optical, UV and X-ray observations have the potential to provide additional useful constraints on the NS radius through measurements of thermal emission from the NS surface, particularly when the distance to the NS is accurately measured through its parallax (as it is for J0737, kpc, Deller et al. 2009; or kpc after Lutz-Kelker correction, Verbiest et al. 2012). UV and X-ray observations can also measure the NS surface temperature (e.g., Pavlov et al. 2002), which, together with the mass and radius information, can provide tight constraints on the unknown equation of state of matter in the superdense NS interior (Yakovlev & Pethick 2004).
Radio observations (Burgay et al. 2003; Lyne et al. 2004) have shown that the binary consists of the recycled Pulsar A ( ms, erg s-1, Myr, G) and the ordinary old Pulsar B ( s, erg s-1, Myr, G) locked in a tight 2.4-hour orbit with a maximum separation of only light-seconds and an eccentricity . The nearly edge-on geometry of J0737 allowed Lyne et al. (2004) to detect a radio eclipse of Pulsar A by the magnetosphere of Pulsar B, likely resulting from synchrotron absorption in the magnetosphere of the latter (Arons et al. 2005; Lyutikov 2004). Even more interesting was the finding that the pulsed radio emission of Pulsar B was seen only during two short orbital phase intervals before and after Pulsar A’s superior conjunction. These changes strongly suggest that the magnetosphere (and possibly atmosphere) of Pulsar B is influenced by the wind or radiation of the more powerful Pulsar A (Jenet & Ransom 2004; Demorest et al. 2004; Zhang & Loeb 2004). Pulsar A dominates the energetic output of the system (by over a factor of 3000 in spin-down power), and so it is likely to dominate the non-thermal output as well111The emission, however, may come not only from Pulsar A’s magnetosphere, but also from an intrabinary shock or Pulsar B’s magnetosphere, activated by Pulsar A’s wind..
J0737 is also the first of the two known DNSBs detected in X-rays (the second being B1534+12; Kargaltsev et al. 2006; Durant et al. 2011b). Following observations with Chandra ACIS (10 ks, McLaughlin et al. 2004, and 80 ks, Possenti et al. 2008) and XMM-Newton (50 ks; Pellizzoni et al. 2004; Campana et al. 2004), a 230-ks XMM-Newton observation was undertaken (Pellizzoni et al. 2008, P+08 hereafter). The derived spectrum allows for several two-component or three-component models, e.g., two blackbodies (BB+BB), blackbody plus power-law (BB+PL), or BB+BB+PL. The reason for this is the relatively narrow energy range of the X-ray data (0.3–8 keV, with best sensitivity in 0.5–2 keV) and the large number of correlated model parameters.
Guillemot et al. (2013) presented the detection of J0737 in GeV -rays with Fermi LAT. Pulsations from Pulsar A were detected, but not from Pulsar B. A double-peaked pulsation profile was found, with a -ray efficiency in the typical range for millisecond pulsars. Although significantly detected, the inferred spectrum was highly uncertain, with photon index and cut-off energy GeV. The magnetic inclination angle, , and viewing angle, , were both found to be near 90, consistent with the radio modeling.
There was only one deep observation J0737 in the optical (Ferraro et al. 2012; F+12 hereafter), employing the high resolution camera (HRC) of the Advanced Camera for Surveys (ACS) aboard the Hubble Space Telescope (HST). F+12 used a coronograph to obstruct a nearby ( away) bright (, late F-type) star, but the target was not detected.
To reduce the relative brightness of the F-star, we observed J0737 in the far ultraviolet (FUV). In this Letter we describe the observation, present the discovery of the FUV emission, and discuss some implications.
2 Observations and Results
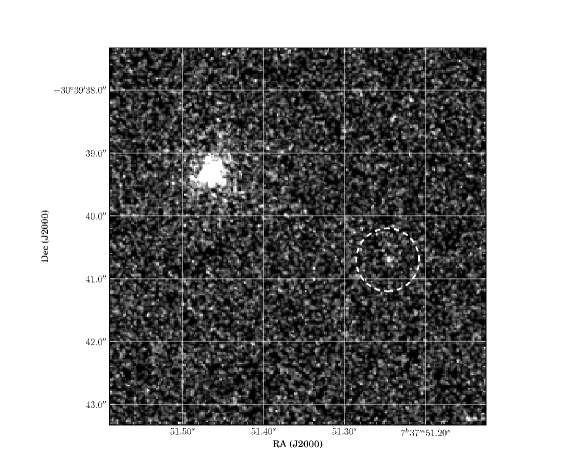
J0737 was observed with HST on 2012 December 12 in the FUV using the Solar-blind Channel (SBC) of ACS (346 field of view, 00340030 pixel scale), using long-pass filter F125LP with peak transmission around 1300 Å and sharp cut-off to shorter wavelengths222See http://www.stsci.edu/hst/acs/documents/handbooks/cycle20/c10_ImagingReference40.html. A total exposure time of 5553 s was acquired across three orbits in the Earth’s shadow, where the geo-coronal FUV background is greatly reduced. The resulting combined 6″6″ image around the position of J0737 is shown in Figure 1. In addition to the bright field F-star, we detected a faint point source, which we show below to be the FUV counterpart to J0737.
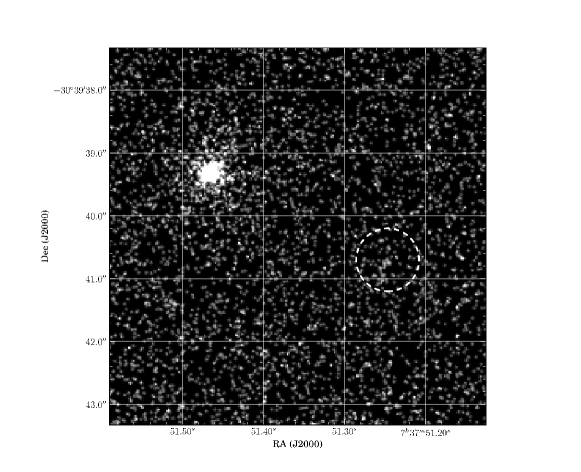
We also filled the remainder of the orbits with imaging using filter F140LP333See http://www.stsci.edu/hst/acs/documents/handbooks/cycle20/c10_ImagingReference41.html, for a total exposure time of 1845 s, because this filter cuts off the geocoronal background (including the oxygen lines) seen at shorter wavelengths when not in the Earth’s shadow.
2.1 Astrometry
We based our astrometry on the F-star position. The most accurate astrometric information for this star is given in the UCAC4 catalog (Zacharias et al. 2012). The catalog position of the star 297-026440 is , at the epoch of 2000.0, its proper motion is mas yr-1, mas yr-1. Calculating the star’s position at the epoch of the HST observations (2012.95), we find that the HST coordinates are offset with respect to the UCAC4 coordinates by 029003 in R.A. and 133003 in Dec. We, therefore, adjusted the WCS of the image, by simple translation. The pulsar’s position also needs to be corrected for proper motion; from the information in Deller et al. (2009) we found , at the epoch of the HST observations.
In the corrected F125LP image we found a source located almost exactly at the predicted position of J0737 (Figure 1, top). The difference between the star-pulsar offset as predicted (p) by the calculations above and as measured (m) from the image is , . The offset is smaller than the uncertainty of the predicted J0737 position, dominated by the error in the reference star’s proper motion over 13 yr, about 003 in each coordinate (one-sigma), under one image pixel. This source is not present in any optical or IR catalog, nor in the deep optical HST images of F+12. With the low surface density of FUV sources in the field, a chance coincidence would be extremely unlikely and, hence, we conclude that the FUV source we discovered is indeed J0737.
In the F140LP image (also corrected using UCAC4; see Figure 1, bottom), a faint enhancement in the count rate is seen at a very similar position. The centroid is poorly determined, but about 007 distant from the F125LP counterpart of J0737. As this could be due to a noise fluctuation, we consider this as a tentative detection.
2.2 Photometry and Spectrum
In an aperture of radius 00875, we measure the F125LP count rate of 0.0084 cts s-1 (corresponding to about 47 counts in total 444The total number of counts in the aperture is not an integer due to the drizzling procedure with which the three images were combined into the final image.), of which 0.0032 cts s-1 are from the background (measured in a 50″ radius circle and scaled to the 00875 aperture). The detection significance is 4.2. The aperture correction was measured from the bright field F-star, to correct to the 05 radius aperture for which the photometry calibration baseline is established. We found a correction factor of 1.52 555The ACS instrument handbook recommends measuring the correction rather than using tabulated values, see http://www.stsci.edu/hst/acs/documents/handbooks/current/c05_imaging7.html. The final derived source count rate is 0.00790.0018 cts s-1. Using the same method, the derived count rate for the possible faint F140LP source (using the nominal aperture center, without centroiding) is 0.0050.002 cts s-1, at 2.5 significance.
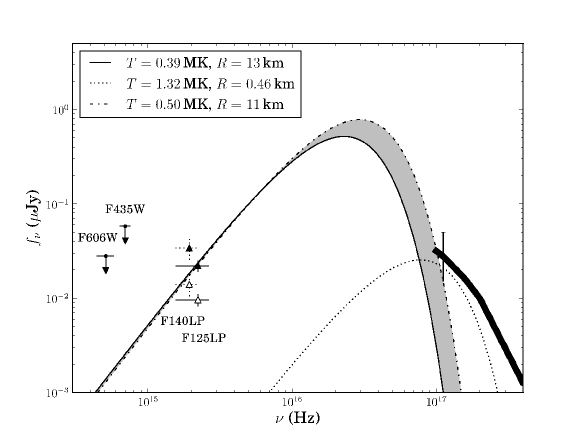
We used the spectral modeling package pysynphot to calculate the count-rate expected in F125LP for BB model spectra and a range of temperatures and extinctions. The pysynphot package integrates the model spectrum over the asymmetric instrumental band-pass (sensitivity function) and returns the count rate for given model parameters. Comparing the simulated count rates with the measured one, we derive a best-fit temperature for each assumed value of extinction and emission area. We used pysynphot’s standard Galactic extinction from Cardelli et al. (1989). For apparent emitting area of a km sphere, as would be expected from one of the pulsars, with a distance kpc and plausible reddening , we find K from the F125LP detection. With this assumed spectrum, the spectral flux is Jy ( Jy, corrected for extinction) at the effective wavelength Å. The integrated flux in the 1250–1550 Å band is erg s-1 cm-2, or erg s-1 cm-2 after correcting for extinction (corresponding to a luminosity erg s-1 at kpc).
For a PL that is flat (frequency-independent) in (one possible non-thermal spectrum), we find Jy, implying erg s-1 cm-2, erg s-1 cm-2 (corresponding to erg s-1).
The derived spectral flux for the tentative F140LP detection is Jy ( Jy) at the effective wavelength Å, for a thermal model. In Figure 2 we also include the flux limits of F+12 in the optical and the extinction-corrected X-ray spectrum from P+08 in the X-rays; the rough uncertainty at the low-energy end of the X-rays associated with extinction in the range cm-2 is indicated by an error-bar. We also show the cool component of the BB+BB fit of the phase-integrated X-ray spectrum (P+08).
3 Discussion
The excellent positional coincidence of the source firmly detected in the F125LP image leaves no doubt that it is the counterpart of J0737. The detection in F140LP is marginal. Given the large uncertainties and overlapping bands, the estimated F140LP flux is consistent with the F125LP flux, but it does not add useful spectral information. If treated as an upper limit, it is less restrictive than those in the optical. Therefore, we do not include it in further analysis.
The FUV emission can come from the surface of one (or both) NSs, in which case it should have a thermal spectrum. Alternatively, the emission can be nonthermal, coming either from the magnetosphere of Pulsar A (the other pulsar is not energetic enough) or from a shock powered by the interaction of the Pulsar A’s wind with Pulsar B’s magnetosphere (e.g., Lomiashvili & Lyutikov 2013) or the circumbinary medium (for the bow-shock scenario, see, e.g., Granot & Mészáros 2004; Zhang & Loeb 2004). With just one measurement, we cannot definitively discriminate between these possibilities. Below we discuss constraints on the nature of the FUV emission based on the existing multiwavelength data.
The measured FUV flux, as well as the optical upper limits (F+12), are clearly inconsistent with the extrapolation of the X-ray PL component (; P+08), which overpredicts the optical-FUV fluxes by several orders of magnitude. Comparing the FUV flux with the optical limits, we find that the optical-FUV spectrum cannot decrease with frequency faster than , for the plausible reddening (i.e., the optical-FUV photon index ). It means, in particular, that, if the FUV emission is nonthermal, there is a break in the spectral slope between the FUV and X-ray bands, . Such a break has been seen in spectra of young pulsars (e.g., the Vela pulsar; Romani et al. 2005; Pavlov et al. 2001), but it remains unclear whether or not a similar break is present in old and recycled pulsars (e.g., Zavlin & Pavlov 2004; Durant et al. 2011a). Extrapolation of the Fermi LAT spectrum (Guillemot et al. 2013) toward the optical falls below the measured FUV flux; however, the -ray spectrum is very uncertain.
The FUV luminosity erg s-1, for a flat spectrum and , corresponds to the radiative efficiency (we use in this estimate because Pulsar A is by far the dominant source of power in the system), consistent with typical values for optical-UV efficiency (e.g., Zharikov et al. 2006). The FUV luminosity is a factor of lower than the nonthermal X-ray luminosity in 0.2–10 keV, which is also typical for pulsars detected in the optical-UV (Zavlin & Pavlov 2004).
The FUV emission can also be interpreted as thermal emission from the NS surface (for simplicity, below we assume that it is dominated by one NS). The unabsorbed FUV flux and the corresponding surface temperature depend on the reddening and the wavelength dependence of extinction (for instance, according to Cardelli et al. 1989, for the effective Å of the F125LP filter). The range of found from X-ray fits (P+08) suggests – for V-band extinction, or –0.15 for an average Galactic . For this range we obtain – MK for the NS radius km and kpc, which corresponds to bolometric luminosities – erg s-1.
For the average reddening of the above range, , we obtained MK ( erg s-1). This temperature is similar to the cool component temperature, , found by P+08 in a BB+BB+PL fit of the phase-resolved X-ray spectrum and ascribed to Pulsar B. However, the normalization of that cool X-ray component implies an implausible emitting radius, km, at kpc. This suggest that either the parallax measurement greatly overestimated the distance or, more likely, that the X-ray models were too simplistic to capture the emission properties of this complex binary system.
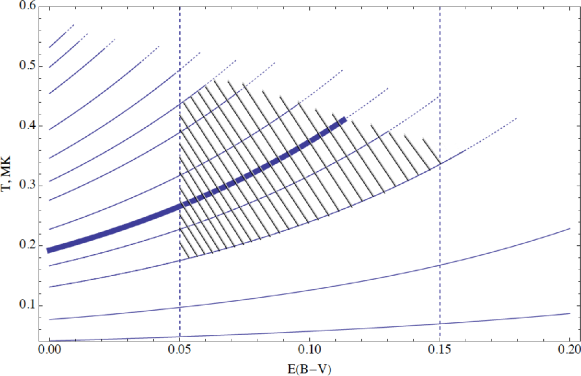
The requirement that the extrapolation of the thermal FUV spectrum to higher energies should not exceed the measured X-ray spectrum puts additional constraints on the extinction, radius-to-distance ratio (where km and kpc) and the NS surface temperature. The region of allowed parameters is shown in Figure 3, with the most plausible values within the shaded area. The optical limits (F+12) constrain the parameters (e.g., – K, depending on ) only at implausibly large (not shown in Figure 3).
The inferred surface temperature is larger than the predictions of standard cooling models, K for pulsars older than 10 Myr (both pulsars in J0737 are believed to be significantly older; Lorimer et al. 2007). This is also substantially higher than the temperature MK of the Gyr-old millisecond PSR J0437–4715 (Kargaltsev et al. 2004; Durant et al. 2012). Such surface temperatures require a heating mechanism to operate in the NS interior (see, e.g., Gonzalez & Reisenegger 2010). We defer further discussion of NS heating/cooling models until the thermal nature of the FUV spectrum is confirmed.
For J0737, there may be an alternative heating mechanism (which is not relevant to isolated pulsars): the surface of Pulsar B could be heated by Pulsar A’s wind if the ultra-relativistic particles of the wind penetrate Pulsar B’s magnetosphere and precipitate onto the surface. The bolometric luminosity of Pulsar B should be smaller than the fraction of Pulsar A’s spin-down power intercepted by the Pulsar B’s magnetosphere: erg s-1 for an isotropic wind, where cm is Pulsar B’s light cylinder radius, and cm is the average separation between the pulsars. Since the radiative efficiency is typically a small fraction of the total power available, this estimate shows that the observed emission is unlikely to come from the Pulsar B’s surface heated by the Pulsar A’s wind. It is more likely that we see internal NS reheating operating in Pulsar A.
4 Conclusion
We discovered FUV emission from J0737 and measured the flux in two broad filters. If the observed emission is thermal, it would imply a pulsar surface temperature that is much higher than predicted by standard coiling curves. Alternatively, the FUV emission could be non-thermal, but this would require a broken PL spectrum which decreases faster in X-rays than in the optical-UV with increasing frequency. Further observations are needed to firmly establish the nature of the FUV emission from J0737.
Acknowledgments: This work was supported by National Aeronautics Space Administration through the HST-GO-12494.04-A award issued by the Space Telescope Science Institute.
References
- Arons et al. (2005) Arons, J., Backer, D. C., Spitkovsky, A., & Kaspi, V. M. 2005, in Astronomical Society of the Pacific Conference Series, Vol. 328, Binary Radio Pulsars, ed. F. A. Rasio & I. H. Stairs, 95
- Burgay et al. (2003) Burgay, M., et al. 2003, Nature, 426, 531
- Campana et al. (2004) Campana, S., Possenti, A., & Burgay, M. 2004, ApJ, 613, L53
- Cardelli et al. (1989) Cardelli, J. A., Clayton, G. C., & Mathis, J. S. 1989, ApJ, 345, 245
- Deller et al. (2009) Deller, A. T., Bailes, M., & Tingay, S. J. 2009, Science, 323, 1327
- Demorest et al. (2004) Demorest, P., Ramachandran, R., Backer, D. C., Ransom, S. M., Kaspi, V., Arons, J., & Spitkovsky, A. 2004, ApJ, 615, L137
- Durant et al. (2011a) Durant, M., Kargaltsev, O., & Pavlov, G. G. 2011a, ApJ, 743, 38
- Durant et al. (2012) Durant, M., Kargaltsev, O., Pavlov, G. G., Kowalski, P. M., Posselt, B., van Kerkwijk, M. H., & Kaplan, D. L. 2012, ApJ, 746, 6
- Durant et al. (2011b) Durant, M., Kargaltsev, O., Volkov, I., & Pavlov, G. G. 2011b, ApJ, 741, 65
- Ferraro et al. (2012) Ferraro, F. R., et al. 2012, ApJ, 749, 84
- Gonzalez & Reisenegger (2010) Gonzalez, D., & Reisenegger, A. 2010, A&A, 522, A16+
- Granot & Mészáros (2004) Granot, J., & Mészáros, P. 2004, ApJ, 609, L17
- Guillemot et al. (2013) Guillemot, L., et al. 2013, ApJ, 768, 169
- Jenet & Ransom (2004) Jenet, F. A., & Ransom, S. M. 2004, Nature, 428, 919
- Kargaltsev et al. (2006) Kargaltsev, O., Pavlov, G. G., & Garmire, G. P. 2006, ApJ, 646, 1139
- Kargaltsev et al. (2004) Kargaltsev, O., Pavlov, G. G., & Romani, R. W. 2004, ApJ, 602, 327
- Kramer & Stairs (2008) Kramer, M., & Stairs, I. H. 2008, ARA&A, 46, 541
- Lomiashvili & Lyutikov (2013) Lomiashvili, D., & Lyutikov, M. 2013, ArXiv, 1310.2204
- Lorimer et al. (2007) Lorimer, D. R., et al. 2007, MNRAS, 379, 1217
- Lyne et al. (2004) Lyne, A. G., et al. 2004, Science, 303, 1153
- Lyutikov (2004) Lyutikov, M. 2004, MNRAS, 353, 1095
- McLaughlin et al. (2004) McLaughlin, M. A., et al. 2004, ApJ, 605, L41
- Pavlov et al. (2002) Pavlov, G. G., Zavlin, V. E., & Sanwal, D. 2002, in Neutron Stars, Pulsars, and Supernova Remnants, ed. W. Becker, H. Lesch, & J. Trümper, 273–+
- Pavlov et al. (2001) Pavlov, G. G., Zavlin, V. E., Sanwal, D., Burwitz, V., & Garmire, G. P. 2001, ApJ, 552, L129
- Pellizzoni et al. (2004) Pellizzoni, A., De Luca, A., Mereghetti, S., Tiengo, A., Mattana, F., Caraveo, P., Tavani, M., & Bignami, G. F. 2004, ApJ, 612, L49
- Pellizzoni et al. (2008) Pellizzoni, A., Tiengo, A., De Luca, A., Esposito, P., & Mereghetti, S. 2008, ApJ, 679, 664
- Possenti et al. (2008) Possenti, A., Rea, N., McLaughlin, M. A., Camilo, F., Kramer, M., Burgay, M., Joshi, B. C., & Lyne, A. G. 2008, ApJ, 680, 654
- Romani et al. (2005) Romani, R. W., Kargaltsev, O., & Pavlov, G. G. 2005, ApJ, 627, 383
- Stairs et al. (2004) Stairs, I. H., Thorsett, S. E., & Arzoumanian, Z. 2004, Physical Review Letters, 93, 141101
- Verbiest et al. (2012) Verbiest, J. P. W., Weisberg, J. M., Chael, A. A., Lee, K. J., & Lorimer, D. R. 2012, ApJ, 755, 39
- Yakovlev & Pethick (2004) Yakovlev, D. G., & Pethick, C. J. 2004, ARA&A, 42, 169
- Zacharias et al. (2012) Zacharias, N., Finch, C. T., Girard, T. M., Henden, A., Bartlett, J. L., Monet, D. G., & Zacharias, M. I. 2012, VizieR Online Data Catalog, 1322, 0
- Zavlin & Pavlov (2004) Zavlin, V. E., & Pavlov, G. G. 2004, ApJ, 616, 452
- Zhang & Loeb (2004) Zhang, B., & Loeb, A. 2004, ApJ, 614, L53
- Zharikov et al. (2006) Zharikov, S., Shibanov, Y., & Komarova, V. 2006, Advances in Space Research, 37, 1979