Nucleation of a new phase on a surface that is changing irreversibly with time
Abstract
Nucleation of a new phase almost always starts at a surface. This surface is almost always assumed not to change with time. However, surfaces can roughen, partially dissolve and change chemically with time. Each of these irreversible changes will change the nucleation rate at the surface, resulting in a time-dependent nucleation rate. Here we use a simple model to show that partial surface dissolution can qualitatively change the nucleation process, in a way that is testable in experiment. The changing surface means that the nucleation rate is increasing with time. There is an initial period during which no nucleation occurs, followed by relatively rapid nucleation.
I Introduction
Nucleation of a new phase, such as a crystal or a liquid, almost always occurs with the nucleus at a surface debenedetti ; sear_rev ; sear_rev12 . The rate of nucleation is known to be extremely sensitive to microscopic details of the surface. For example, microscopic changes in the surface geometry page06 ; page09_jacs ; sear_rev12 ; hedges12 ; meel10 can change rates by orders of magnitude. It is also well known that surfaces change irreversibly over time. Mineral surfaces in the atmosphere are subject to weathering white03 , smooth metal surfaces corrode and become pitted callister_book , and polymer surfaces degrade callister_book . Despite the fact that forming a nanoscale pit is known to hugely increase the nucleation rate page06 ; meel10 ; hedges12 , no attempts have been made to model and understand the effect on nucleation, of pitting and other dynamic changes in a surface. We model this here, using a simple generic model of nucleation of a new phase on a slowly dissolving surface. In this simple model, we find that dissolution, by roughening the surface, greatly increases the nucleation rate, i.e., the nucleation rate, , becomes an increasing function of time.
The classical picture of nucleation of a new crystal is that the nucleus is a large and rare thermal fluctuation of the nucleating phase. The rate is low due to the rareness of the fluctuation; it is necessary to wait a long time for such a rare fluctuation to occur. In this classical picture of nucleation, the fluctuation occurs in a system that is at a metastable local equilibrium and so is not changing with time debenedetti ; sear_rev ; sear_rev12 . Nucleation is then a stochastic process, with a time-independent nucleation rate, (that depends exponentially on the free energy cost of the fluctuation). For a stochastic process with a time-independent rate, the probability that nucleation has not occurred at a time , is an exponential function of time: . However, if the surface is changing with time, so will the free energy of forming a nucleus and hence the nucleation rate, and is no longer an exponential function of time.
The property is easily measurable in experiment, and this has been done for a number of crystallising systems duft04 ; carvalho11 ; diao11_langmuir ; diao12_cgd ; murray11 ; kulkarni13 ; toldy12 ; kim13 . For crystallisation, can be estimated in experiment by preparing a set of tens or more identical droplets and then plotting the fraction of them in which crystals have nucleated, as a function of time. The signature of a rate increasing with time, is an initial plateau with due to a small initial nucleation rate, followed by dropping faster and faster, and so curving downwards, as the nucleation rate increases. This signature has been in observed in the crystallisation of the explosive RDX by Kim et al. kim13 . Thus our model provides a possible qualitative explanation for this observation. It is only qualitative as our model is a simple lattice model, not an accurate model of RDX in solution, and the experiments do not characterise the surface that nucleation is occurring on. Further experiments to characterise the source of the increasing nucleation rate, and simulation of more detailed models will be needed to develop our understanding of time-dependent nucleation rates.
In the next section we will describe our simple model, and the simulation algorithm we will use. We will then present and discuss results, before comparing these results with a simple analytic theory. We discuss the generality of our observed in nucleation and note that a similar form is seen for cancer. The final section is a conclusion.
II Model
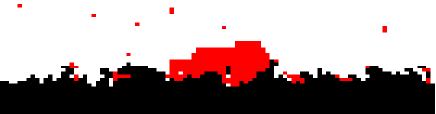
Our simple model for nucleation on a slowly dissolving surface is a modified two-dimensional Ising model or lattice gas (the two models are equivalent chandler_book ), with Glauber Monte Carlo dynamics binder_book10 . See Fig. 1 for a simulation snapshot. We will use lattice-gas terminology here. Each lattice site is either empty (left white in Fig. 1), filled with a particle (red) or part of the surface and so filled by a surface particle (black). We will study nucleation of the high-particle-density (liquid so mostly red) phase from the dilute phase (vapour so mostly white), as we did in earlier work on nucleation in pores page06 . Nucleation is via a rare barrier-crossing thermal fluctuation, that occurs on an irreversibly changing surface.
Neighbouring particles interact via an energy , and a particle interacts with a neighbouring surface particle with an energy . This results in the nucleus of the liquid phase having a contact angle with the surface. We work at a temperature such that . The chemical potential of the particles , where is the supersaturation in units of ( is the magnetic field in spin language). All our results are for simulations of systems of 100 () by 400 () lattice sites. Our unit of time is one cycle: one attempted Monte Carlo move per site.
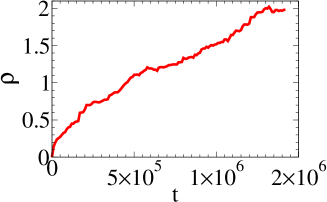
Each surface starts out as perfectly flat, and parallel to the axis, but dissolves at a rate along during the simulation. Dissolution and nucleation is shown in Supplementary Movie 1 supp_mat_pre14 . Our model for dissolution is simple. In our Monte Carlo simulations we select lattice sites at random. If a site is occupied by a surface particle, then if all 4 of its neighbours are also surface particles we do nothing. If between 1 and 3 of its neighbours are surface particles, we flip it irreversibly to an empty site with probability . If none of its 4 neighbours are surface particles we flip it irreversibly to an empty site with probability 1. This is a simple model of irreversible dissolution that creates rough surfaces. We measure height variations in the surface by , the standard deviation of the surface height. The height is defined as the coordinate of the highest lattice site occupied by a surface particle. The roughness as a function of time is plotted for a single run in Fig. 2.
To obtain statistics of the nucleation times we simply run many simulations, each time starting with a perfectly smooth surface. Nucleation is defined as having occurred when the fraction of particles is greater than 10%. This fraction is defined as being the ratio of the number of particles to the total number of particles and empty sites. The equilibrium fraction of sites occupied by particles in the dilute phase is %, so this threshold is only crossed once nucleation has occurred.
III Computer Simulation Results
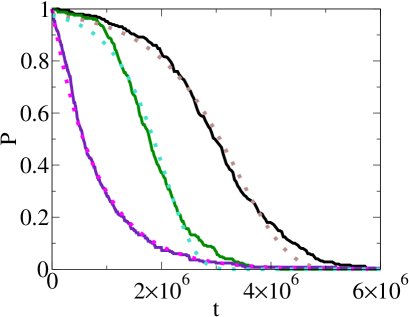
Results for the probability that nucleation has not occurred, , are plotted in Fig. 3. In Fig. 3 we plot for systems with and without surface dissolution. The purple curve is for no dissolution, and at a higher supersaturation. We see that this is well fit by a simple exponential function. The fitted rate is . This agrees well with the nucleation rate of for this surface calculated using the Forward Flux Sampling (FFS) method of Allen et al. allen05 ; allen09 ; page06 . This is just what we expect for a time-independent nucleation rate. Note that the curve without dissolution in Fig. 3 cannot be directly compared with the curves for the surfaces with dissolution, because the supersaturations are different.
However, with slow dissolution (black and green curves) the functional form is very different. In particular, whereas the exponential function is steepest at , with dissolution the is almost horizontal there. Initially, there is a waiting period during which almost no nucleation occurs and so is almost horizontal, then significant nucleation occurs and drops. The waiting time is increased if the dissolution rate is decreased. The black curve is for a half that of the green curve, and we see that the initial plateau at short times is longer.
The form of with dissolution is also very different from the stretched exponential that results from quenched (i.e., time-independent) disorder sear12 ; sear13 . Thus the shape of allows us to distinguish between systems with a single time-independent rate (simple exponential), systems with quenched disorder (stretched exponential), and systems with a time-dependent nucleation rate due to dissolution (initially almost horizontal ). See Refs. duft04, ; carvalho11, for examples of experimental systems with simple exponential , and Ref. diao12, for an experimental system showing stretched exponential behaviour. I am aware of two experimental studies, which show ’s with a plateau at short times. Both are on crystallisation from solution, of glycine in the case of Badruddoza et al. badruddoza13 , and of the explosive RDX in the case of the work of Kim et al. kim13 . In both sets of results, the effective nucleation rate is clearly increasing with time, and so they are both consistent with nucleation occurring on a surface that is changing with time in such a way as to increase the nucleation rate. Determining if a time-dependent surface is responsible for the form of the experimental , would require finding the surface that nucleation is occurring on. This was not done in these experiments but could be attempted in future work. As estimating is straightforward in experiment diao11_langmuir ; diao12_cgd ; murray11 ; kulkarni13 , is probably the best way to obtain evidence for a time-dependent nucleation rate.
In the snapshot showing nucleation, Fig. 1, and in Supplementary Movie 1 supp_mat_pre14 , we see that nucleation occurs with the nucleus in a concave part, or pit, in the surface. This is as expected page06 ; meel10 ; hedges12 ; page09_jacs ; sear_rev12 ; sear_rev . The free energy barrier to nucleation comes from the cost of creating the interface around the growing nucleus. The shorter the length of interface that needs to be created, the lower the free-energy barrier. At any surface there is a pre-existing interface. This pre-existing part of the interface does not contribute to the barrier, which is why the barrier is lower at interfaces. At any concave part of a surface, the length of this pre-existing interface is larger than at a flat or convex surface, and so nucleation is faster there debenedetti ; sear_rev ; sear_rev12 .
At a supersaturation , the radius of the critical nucleus . This used Onsager’s exact expression onsager44 , for the surface tension , which gives at . This critical radius is larger but of the same order of magnitude as the roughness of the surface seen in Fig. 2. A roughness of around 2, or about one quarter of the critical radius is enough to dramatically increase the nucleation rate here.
The key finding of our computer simulations is that roughening of the surface with time causes the nucleation rate to increase (by orders of magnitude) until it is fast enough to observe nucleation. Although this is not an example of self-organised criticality (SOC) bak88 , it does have features in common with SOC systems. In both cases the dynamics drive the system until a threshold is exceeded, at which point a sudden event occurs (an avalanche in the sand pile model of self-organised criticality, and nucleation here). Future work could perhaps take ideas from the study of the approach to the point where an avalanche occurs in SOC, and apply them here.
IV Analytical Model: Derivation, Results and Comparison with Computer Simulation Results
We will now develop a simple general model of nucleation with a time-dependent rate. We do this in order to generalise our findings for our lattice model, and to make experimentally testable predictions. We can construct a simple model for the increasing rate as follows. The probability that nucleation has not occurred, , satisfies the differential equation
| (1) |
where is the nucleation rate of the system at time . It has dimensions of one over time. Our observations require a rate that increases by orders of magnitude, and so we assume that is an exponentially increasing function of time:
| (2) |
where is the rate at , and is the rate of increase of the nucleation rate. This exponential time dependence will give us the required large increase in rate, and would follow if the free-energy barrier is decreasing linearly as a function of time. The roughness is not increasing linearly with time, see Fig. 2, so this is unlikely to be exactly true, but it does provide a simple model. Note that with this assumption of an exponentially increasing rate our model becomes the Gompertz model mueller95 , a model widely used for predicting lifetimes, for example the lifetimes of living organisms.
Putting Eq. (2) into Eq. (1), and solving we obtain mueller95
| (3) | |||||
| (4) |
We are interested in systems where the initial rate is much lower than , as then the rate increases for some time before nucleation occurs. So, in the second line we took the limit and simplified the equation. It is worth noting that Eq. (4) has the functional form of the Gumbel distribution of extreme-value statistics castillo_book , which can also arise in nucleation problems via other mechanisms sear13_unpub .
Fits of Eq. (4) to the simulation data are shown as the brown and turquoise dotted curves in Fig. 3. They provide reasonably good fits to the data. The best fit values of (, ) are (, ) and (, ), for the fits to data with dissolution rates and respectively. So, the best-fit values of satisfy our assumption that .
We can obtain an independent estimate of the value of by approximating it as the rate of change of the free energy barrier to nucleation, , with time: , which is expressed in terms of the rate of change of the roughness. In Fig. 2 we see that the rate of increase of is not a constant but is always of order for , i.e., . We can estimate by assuming that approximately halves when becomes of order . At the supersaturation , the initial nucleation rate on a flat surface is (from FFS simulations). Taking the barrier for a flat surface . As , we then have . Thus, our estimate for at is , which is close to the best fit value.
Equation (4) gives a standard deviation of nucleation times (obtaining this expression requires extending the integration over but for our parameter values this is a very good approximation). Thus experimental measurements of the spread of nucleation times directly measure the timescale for the increase in nucleation rate. The ratio of the standard deviation to the mean, , is given by , for the Euler-Mascheroni constant. In other words, for large , scales as , i.e., decreases but only as the log of the ratio. Thus the prediction is that for systems with low initial rates, , the ratio should be significantly less than one, but due to the logarithmic dependence, values will presumably almost always be around or above. Very small values are not achievable.
There is experimental data in which , for example the work of Fasano and Khan fasano01 on the crystallisation from solution of calcium oxalate. A small value of this ratio is characteristic of a system with a nucleation rate increasing with time. In the calcium oxalate system, the surface the calcium oxalate crystals are nucleating on may be changing with time in such a way as to increase the rate of nucleation at this surface.
V Generality of our results and comparison with the initiation of cancer
Our Eq. (4), by definition, will apply to any process in which the nucleation rate varies exponentially with time. Our model of a slowly dissolving surface is just one member of a class of systems, defined by having an increasing rate of a stochastic process. In other systems, other processes may cause the surface and hence the rate to change with time. Another example of such a process may be a chemical reaction that modified the surface such as to reduce the contact angle of the nucleus at the surface. Another might be nucleation on some growing aggregate in solution, where the nucleation rate increases as the size of the aggregate grows sear12 . Nucleation of lysozyme crystals is known to be affected by aggregates parmar07 . All members of this class should have qualitatively similar ’s.
Finally, we note that our surfaces are an example of a system where multiple random steps (not just one) are required before the event of interest occurs. A number of erosion steps is needed, followed by a nucleation step. Systems where multiple steps are required may generically result in cumulative probabilities that are similar to those in Fig. 3. An example in a very different context, but with a of a similar form, is that of lung cancer. The probability that a smoker does not have lung cancer has a similar form to our ’s in Fig. 3; see Refs. halpern93, ; peto11, , where they plot the probability of dying of cancer, equivalent to . Smoking greatly increases the probability of getting lung cancer, but for typical smokers who start when young, this risk remains low until their 40s halpern93 ; peto11 , after which it rises rapidly.
VI Conclusion
Nucleation occurs on surfaces, and in practice all surfaces change over time, it is simply a question of whether this change is faster, slower, or comparable to the timescale of the experiment. Almost all prior work studying nucleation has implicitly assumed that it is much slower. Here we introduced a simple model for nucleation on a slowly dissolving surface, and showed that it predicts a characteristic (Fig. 3). This should be straightforward to observe in experiment. It is also indicative of a mechanism determining the time until nucleation, that is fundamentally different to that predicted by classical nucleation theory. Here, the time until nucleation is the time taken for dissolution to increase the nucleation rate to the point that it is fast enough to occur before further change at the surface. This is of course qualitatively different from the mechanism in classical nucleation theory, where the nucleation time is the time for a rare thermal fluctuation to occur.
A consistent with a nucleation rate increasing with time has been in observed by Kim et al. kim13 . Our model provides a possible qualitative explanation for this observation. Toldy et al. toldy12 also see a similar , in that case for glycine crystallising in solution, but there the crystallising droplets may not be independent of each other. They sometimes observe that once one droplet has crystallised, then neighbouring droplets may crystallise. This means droplets are not independent, which can give an effective nucleation rate for the ensemble of droplets that increases with time, even when the rate in an isolated droplet may not be increasing with time. This effect complicates understanding the nucleation behaviour.
Further experimental studies will be needed to understand what sorts of crystallising systems have nucleation rates that vary with time, and to understand what determines the key parameter: the rate at which the nucleation rate increases with time, . If we are to predict and control systems with time-dependent nucleation rates we will need to determine what are the physical processes that control this time dependence. Finally, computer simulations of crystallisation in simple off-lattice models will be needed to better understand how crystals nucleate on a time-dependent rough surface.
Acknowledgements.
It is a pleasure to acknowledge discussions with Sathish Akella, Seth Fraden, James Mithen, and Patrick Warren. I acknowledge financial support from EPSRC (EP/J006106/1).References
- (1) P. G. Debenedetti, Metastable Liquids (Princeton University Press, Princeton, 1996)
- (2) R. P. Sear, J. Phys. Cond. Matt. 19, 033101 (2007)
- (3) R. P. Sear, Int. Mat. Rev. 57, 328 (2012)
- (4) A. J. Page and R. P. Sear, Phys. Rev. Lett. 97, 065701 (2006)
- (5) A. J. Page and R. P. Sear, J. Am. Chem. Soc. 131, 17550 (2009)
- (6) L. O. Hedges and S. Whitelam, Soft Matt. 8, 8624 (2012)
- (7) J. A. van Meel, R. P. Sear, and D. Frenkel, Phys. Rev. Lett. 105, 205501 (2010)
- (8) A. F. White and S. L. Brantley, Chem. Geology 202, 479 (2003)
- (9) W. D. Callister, Materials Science and Engineering (John Wiley, 2010)
- (10) D. Duft and T. Leisner, Atmos. Chem. Phys. 4, 1997 (2004)
- (11) J. L. Carvalho and K. Dalnoki-Veress, Euro. Phys. J. E 34, 6 (2011)
- (12) Y. Diao, A. S. Myerson, T. A. Hatton, and B. L. Trout, Langmuir 27, 5324 (2011)
- (13) Y. Diao, M. E. Helgeson, Z. A. Siam, P. S. Doyle, A. S. Myerson, T. A. Hatton, and B. L. Trout, Crys. Growth Des. 12, 508 (2012)
- (14) B. J. Murray, S. L. Broadley, T. W. Wilson, J. D. Atkinson, and R. H. Wills, Atmos. Chem. Phys. 11, 4191 (2011)
- (15) S. A. Kulkarni, S. S. Kadam, H. Meekes, A. I. Stankiewicz, and J. H. ter Horst, Crys. Growth Des. 13, 2435 (2013)
- (16) A. I. Toldy, A. Z. M. Badruddoza, L. Zheng, T. A. Hatton, R. Gunawan, R. Rajagopalan, and S. A. Khan, Crys. Growth Des. 12, 3977 (2012)
- (17) J.-W. Kim, J.-H. Park, H.-M. Shim, and K.-K. Koo, Crys. Growth Des. 13, 4688 (2013)
- (18) D. Chandler, Introduction to Modern Statistical Mechanics (Oxford University Press, New York, 1987)
- (19) K. Binder and D. W. Heermann, Monte Carlo Simulation in Statistical Physics: An Introduction (Springer Verlag, Heidelberg, 2010)
- (20) A. movie of a simulation run showing dissolution followed by nucleation plus details of this simulation are in the Supplemental Material at [url].
- (21) R. J. Allen, P. B. Warren, and P. R. ten Wolde, Phys. Rev. Lett. 94, 018104 (2005)
- (22) R. J. Allen, C. Valeriani, and P. R. ten Wolde, J. Phys. Cond. Matt. 21, 463102 (2009)
- (23) R. P. Sear, J. Phys. Cond. Matt. 24, 052205 (2012)
- (24) R. P. Sear, Cryst. Growth Des. 13, 1329 (2013)
- (25) Y. Diao, K. E. Whaley, M. E. Helgeson, M. A. Woldeyes, P. S. Doyle, A. S. Myerson, T. A. Hatton, and B. L. Trout, J. Am. Chem. Soc. 134, 673 (2012)
- (26) A. Z. Md. Badruddoza, A. I. Toldy, T. A. Hatton, and S. A. Khan, Crys. Growth Des. 13, 2455 (2013)
- (27) L. Onsager, Phys. Rev. 65, 117 (1944)
- (28) P. Bak, C. Tang, and K. Wiesenfeld, Phys. Rev. A 38, 364 (1988)
- (29) L. D. Mueller, T. J. Nusbaum, and M. R. Rose, Expt. Gerontology 30, 553 (1995)
- (30) E. Castillo, Extreme Value Theory in Engineering (Academic Press, San Diego, 1988)
- (31) R. P. Sear, unpublished(2013)
- (32) J. M. Fasano and S. R. Khan, Kidney Int. 59, 169 (2001)
- (33) A. S. Parmar, P. E. Gottschall, and M. Muschol, Biophys. Chem. 129, 224 (2007)
- (34) M. T. Halpern, B. W. Gillespie, and K. E. Warner, J. Nat. Cancer Inst. 85, 457 (1993)
- (35) J. Peto, Br. J. Cancer 104, 389 (2011)